Migration & Modernization
Migrating and Modernizing Oracle Databases to PostgreSQL on AWS – Part 4: Post-cutover optimization
Introduction
In this blog post, we cover the post-cutover phase of an Oracle-to-PostgreSQL migration on Amazon Web Services (AWS), demonstrating how to transform a functional PostgreSQL system into an operationally excellent one. We walk through immediate validation, comprehensive observability, systematic performance optimization, disaster recovery validation, Oracle decommissioning, and the operational excellence foundation, including the continuous improvement lifecycle, that delivers the real value of modernization.
Post-cutover optimization transforms a functional PostgreSQL system into an operationally excellent one tuned for PostgreSQL’s architectural patterns, delivering the real value of modernization.
The first focus is on validation: confirming data integrity, monitoring for unexpected behaviors, and ensuring functional requirements are met. After validation, the mindset must shift from “does it work?” to “does it work optimally?” Our composite case study, Zulon City Insurance (ZCINS) discovered this distinction two weeks post-cutover when intermittent latency spikes appeared, the system functioned but didn’t perform optimally.
This post covers the final phase of a four-part Oracle-to-PostgreSQL migration series. After the cutover executed in Part 3, organizations must shift focus from operational stabilization to systematic optimization. The solution encompasses five pillars of observability, core PostgreSQL tuning strategies that differ architecturally from Oracle, disaster recovery validation, infrastructure decommissioning, and an operational excellence foundation built on Infrastructure as Code (IaC) and team enablement.
ZCINS’s hybrid architecture demonstrates workload-specific service selection: Amazon Aurora PostgreSQL-Compatible Edition for high-concurrency claims processing, Amazon RDS for PostgreSQL for predictable billing workloads, and Aurora Serverless v2 for variable customer portal traffic.
Prerequisites
This post builds on Parts 1 through 3 of the series (Discovery, Assessment, and Planning and Execution). Familiarity with Amazon RDS for PostgreSQL, Amazon Aurora PostgreSQL-Compatible Edition, AWS Database Migration Service (AWS DMS) and Amazon CloudWatch is recommended. No additional AWS infrastructure deployment is required for this post; the walkthrough describes post-cutover operational practices applicable to existing PostgreSQL environments.
Cutover execution and immediate validation
Cutover execution represents the culmination of months of planning: the live transition from Oracle to PostgreSQL. While Part 3 of this series detailed strategies and preparation, the reality of execution brings unique challenges and learning opportunities.
In the validation phase, teams monitor for unexpected behaviors, verify data integrity through automated reconciliation scripts, and confirm that all functional requirements meet performance baselines. During this window, incident response protocols strictly prioritize data integrity over performance optimization.
ZCINS’s experience across four migration waves revealed distinct patterns in post-cutover issues:
- Waves 1–2: Connection pool exhaustion emerged within hours as application servers failed to release connections properly. Amazon CloudWatch alarms triggered when connections exceeded 80% of max_connections, allowing for rapid intervention via connection timeout adjustments.
- Waves 3–4: Performance regressions surfaced in mission-critical systems during production load, a best practice reminder that POC testing must use production-scale datasets to surface realistic performance characteristics.
Only after this critical period, once integrity is confirmed and functional requirements are met, does the focus shift to systematic optimization. This discipline prevents premature optimization while ensuring business continuity during the high-risk transition.
Building comprehensive observability
Post-migration optimization depends on visibility into PostgreSQL’s operational health. Without comprehensive observability, issues surface as user-visible latency rather than early warnings enabling proactive intervention. ZCINS built monitoring across five pillars using AWS-native tools and PostgreSQL extensions, establishing the foundation for all subsequent optimization work.
CloudWatch metrics and alarms
Amazon CloudWatch provides foundational visibility into instance health by automatically collecting Amazon RDS for PostgreSQL and Amazon Aurora PostgreSQL-Compatible Edition metrics at one-minute granularity. To prevent alert fatigue, ZCINS implemented a multi-tiered alerting strategy that aligns thresholds with specific response workflows:
- Critical: Immediate pager escalation for service-disrupting issues.
- High-priority: Timely investigation for concerning performance trends.
- Medium-priority: Backlog items for optimization during business hours.
| Metric | Threshold | Primary response | Migration impact |
| CPUUtilization | >70% sustained (15min) | Investigate query load or consider upsizing | Policy Admin CPU: before 25% (under-provisioned); after downsizing instance, cost savings confirmed |
| DatabaseConnections | >80% of max_connections | Check for connection leaks or increase pool size | Detected application not releasing connections |
| FreeableMemory | <15% of total | Review shared_buffers configuration | Identified memory pressure requiring tuning |
| ReadLatency / WriteLatency | >20ms sustained | Check for I/O bottlenecks or storage issues | Billing engine: led to gp3 IOPS increase |
| BufferCacheHitRatio | <95% | Increase shared_buffers or optimize queries | Policy Admin: before 87% hit ratio; after increasing shared_buffers to 40% of RAM → 96% hit ratio |
To capture deeper engine-level insights, ZCINS deployed AWS Lambda functions to publish custom metrics from PostgreSQL system tables every 15 minutes. For bloat monitoring, it collected dead tuple percentages from pg_stat_user_tables for the top 50 tables. For capacity planning, it collected weekly table growth rates tracked via daily snapshots. For memory management, it tracked pg_stat_database to detect insufficient work_mem settings.
Deep query analysis with CloudWatch Database Insights
Amazon CloudWatch Database Insights serves as the Amazon Aurora and Amazon RDS equivalent to Oracle’s Automatic Workload Repository (AWR). It provides a time-series visualization of database load, allowing for granular drilldowns into SQL execution patterns and wait events.
While traditional monitoring might indicate that CPU usage is high, Database Insights reveals why by correlating load with specific queries. It tracks how execution patterns shift over time and identifies the exact wait events responsible for bottlenecks.
| Dimension | Description | Insight |
| Database Load (AAS) | Average Active Sessions over time | Peak load during open-enrollment window (Month 11) reached 3x normal AAS baseline |
| Top SQL by Load | Queries consuming most database time | Customer search (45ms avg, 8.5M calls/day) outweighed expensive but infrequent analytical queries |
| Wait Events Analysis | Bottleneck identification | Buffer-pin contention from background batch job revealed Policy Admin latency spikes |
| SQL Digest Grouping | Aggregate similar queries with different parameters | Digest grouping surfaced 40% of load from a single parameterized search query pattern |
| Dimension Slicing | Filter by host, user, database | Isolated Wave 3 application server generating 10x connection rate vs. peers |
Two weeks post-cutover, the Policy Administration System began exhibiting 8-second latency spikes every 30 minutes. Application-side metrics showed P99 latency jumping from 850ms to over 8 seconds.
Using Database Insights, ZCINS diagnosed the issue in just two hours: Database Insights mapped the latency spikes directly to buffer-pin wait events. Top SQL analysis pinpointed a background batch job that was creating temporary tables. The wait event details revealed sequential scans on these temporary tables were blocking concurrent transactions.
ZCINS solved the issue by adding indexes to the temporary tables and rescheduled the job to off-peak hours. Without the drill-down capabilities of Database Insights, this diagnosis likely would have taken days of manual log analysis.
Enhanced monitoring using AWS tools and PostgreSQL statistics
While CloudWatch monitors the “container,” the pg_stat_statements extension looks inside the engine. It provides normalized query-level metrics that are essential for identifying the root cause of performance shifts.
ZCINS automated the export of these statistics to CloudWatch using AWS Lambda, focusing on four key indicators:
- Execution volume: Call counts and total execution time.
- Latency distribution: Min/Max/Avg duration per query structure.
- Cache efficiency: Buffer hits vs. reads to identify “noisy neighbors” in memory.
- Resource spillage: Temporary file usage, signaling insufficient work_mem allocation.
Monitoring replication requires a nuanced approach based on the underlying architecture. Because Amazon Aurora uses shared storage, lag is typically sub-100ms. In this environment, a 30-second lag is not just a spike, it is a critical indicator of long-running transactions on the replica blocking the application of changes.
In contrast, Amazon RDS Read Replicas use WAL (Write Ahead Log) streaming. This architecture naturally exhibits higher baseline lag, especially during write-heavy operations or large bulk loads.
| Metric | Source | Threshold | Response strategy |
| ReplicaLag | CloudWatch | >30 seconds | Check for long transactions on replica |
| OldestReplicationSlotLag | CloudWatch | >1GB | Investigate stalled replication slot |
| TransactionLogsDiskUsage | CloudWatch | >80% | WAL archiving falling behind |
Observability impact on operations
Comprehensive observability transforms a migration’s operational posture from reactive “firefighting” to proactive optimization. Without these tools, teams often discover issues only after user reports surface, leading to days of manual correlation across fragmented logs.
By unifying CloudWatch, Database Insights, and PostgreSQL statistics, ZCINS shifted to a model where patterns are identified before they impact users. This integrated approach allows for rapid root-cause diagnosis through correlated time-series data.
| Incident type | Detection (legacy) | Resolution (with observability) | Time reduction |
| Batch job blocking | 2 days of user complaints and investigation | 2 hours via Database Insights wait events | 95% |
| Table bloat | Discovered when queries slow significantly | CloudWatch alarm on dead tuple % | Prevented issue |
| Connection leak | Database restart during emergency | CloudWatch connection count trend detected early | Prevented issue |
| Query regression | Manual testing after deployment | Database Insights SQL digest comparison | 90% |
The economics of observability prove compelling when examining incident prevention and resolution acceleration. While comprehensive monitoring represents non-trivial investment, a single 2-hour production outage for ZCINS’s claims processing system costs approximately $50,000 in business impact from processing delays and customer support escalation. The observability investment paid for itself in the first month by preventing one outage and reducing mean-time-to-resolution from 6 hours to 45 minutes across multiple incidents.
With the observability foundation established and its operational value confirmed, ZCINS turned to the systematic tuning work that transforms a functional migration into a high-performance production system.
Core post-cutover optimizations
With observability established, systematic optimization can proceed. These strategies address PostgreSQL’s architectural differences from Oracle, tuning areas that differ architecturally from Oracle and warrant focused attention from experienced DBAs.
Vacuum and autovacuum management
In Oracle, undo-based Multiversion Concurrency Control (MVCC) maintains old row versions in separate undo tablespaces. PostgreSQL uses tuple-based MVCC, writing new versions directly into the tables. When rows are updated or deleted, PostgreSQL marks old versions as “dead” tuples. If not reclaimed by VACUUM, these tuples cause table bloat, which degrades query performance and wastes storage.
The Lesson: ZCINS’s claims table grew from 85GB to 142GB in just two weeks because the default autovacuum_vacuum_scale_factor (20%) required 2 million changes on a 10M-row table before triggering. With 500,000 daily updates, dead tuples accumulated faster than they could be cleared.
| Parameter | Default value | Tuned value | Impact |
| autovacuum_vacuum_scale_factor | 0.2 (20% threshold) | 0.01–0.1 | More frequent vacuum prevents accumulation |
| autovacuum_analyze_scale_factor | 0.1 (10% threshold) | 0.05 | Keeps statistics current for planner |
| autovacuum_vacuum_cost_limit | 200 | 1000+ | Vacuum completes faster |
| autovacuum_vacuum_cost_delay | 20ms | 2ms or 0 | Reduces total vacuum duration |
Long-running transactions (for example, idle reporting sessions) block VACUUM from reclaiming space. ZCINS eliminated this by implementing strict connection timeouts.
WAL and checkpoint tuning
In write-heavy workloads, PostgreSQL’s defaults often trigger frequent checkpoints, causing “checkpoint storms”, periodic I/O spikes as dirty buffers are flushed to disk. ZCINS’s billing engine (450k invoices/month) saw write latency jump to 3.2s during these events.
They stabilized performance with the following tuning strategy:
- max_wal_size (from 1GB to 8GB): Reduced checkpoint frequency by allowing more WAL to accumulate during batch loads.
- checkpoint_completion_target (from 0.5 to 0.9): Smoothed out I/O by spreading the write load across 90% of the checkpoint interval.
- checkpoint_timeout (from 5min to 15min): Reduced overhead during stable periods.
After adjusting these parameters, ZCINS noticed that checkpoint-related latency spikes dropped from 3.2s to 400ms, while write throughput increased by 35%.
Note: max_wal_size is only modifiable in Amazon RDS for PostgreSQL. In Amazon Aurora PostgreSQL, WAL management is handled by the distributed storage layer and this parameter is not user configurable. The remaining checkpoint settings (checkpoint_completion_target and checkpoint_timeout) apply to both RDS and Aurora for local memory management.
Work memory and temporary space management
The default work_mem (4MB) is often too low for production datasets, forcing PostgreSQL to spill sort/hash operations to temporary files on disk.
ZCINS saw a 15x slowdown in fraud detection queries (from 1.2s to 18s) due to disk spills. They moved to a tiered strategy:
- Global baseline: 32MB (for standard OLTP).
- Connection-level: 256MB (for complex analytical sessions).
- Transaction-level: 512MB (for specific month-end reporting scripts).
Note: Since work_mem is allocated per-operation, a query with three hash joins could consume 3x the allocated memory. The goal is to keep spills for datasets under 500MB entirely in RAM.
Query performance optimization
PostgreSQL’s planner is only as good as its statistics. ZCINS found that the planner was underestimating 450,000 rows as 10,000 because it treated correlated columns (for example, claim_status and claim_amount) as independent.
ZCINS solved this issue by using CREATE STATISTICS to capture column correlations and increasing the statistics_target to 500. The planner correctly switched from slow nested loops to efficient hash joins, reducing execution time from 3.2s to 1.3s.
Note: Don’t wait for autovacuum. Running a manual ANALYZE immediately after a large batch load (for example, a 2M-row claim import) prevents the 2–3 hour performance degradation that occurs while waiting for the background collector.
Backup, recovery, and disaster recovery validation
Theoretical recovery capabilities must be validated through rigorous testing to confirm they match operational reality. Post-cutover, ZCINS implemented monthly recovery drills across all production databases. These drills measured three critical success factors: actual restoration time (RTO), cache warming duration, and application readiness.
- Aurora resiliency: For the Claims system, ZCINS validated that Aurora’s shared storage allows a replica to take over as primary in just 18 seconds if the writer fails.
- RDS restore performance: For RDS-based systems, ZCINS tested full Point-in-Time Recovery (PITR). While restoring a 100GB instance can take roughly 45–65 minutes to provision and replay transaction logs, this recovery time safely met the 2-to-4-hour business RTO requirements.
- RPO confidence: ZCINS confirmed an Actual RPO of 5 minutes for RDS, representing the standard interval for transaction log uploads to Amazon S3.
| System | RTO Target | Actual RTO (validated) | Recovery scenario | Status |
| Claims Processing | 15 min | 18 sec | Aurora storage-level failover | Exceeds Target |
| Policy Admin | 2 hr | 45 min | RDS PITR (Restore to new instance) | Exceeds Target |
| Billing Engine | 4 hr | 65 min | RDS PITR (Restore to new instance) | Exceeds Target |
With recovery objectives validated and the PostgreSQL environment proven stable under production load, ZCINS shifted focus from operational validation to the systematic wind-down of the existing Oracle infrastructure.
Decommissioning Oracle infrastructure
The decommissioning of Oracle infrastructure must be a methodical progression that balances immediate cost savings against long-term risk management. After the 72-hour active validation window described in Part 3, ZCINS maintained the Oracle environment in an idle state for an additional four weeks, providing the necessary buffer to address unforeseen PostgreSQL issues without the pressure of a forced rollback.
| Week | Action | Primary objective | Reversibility |
| 0–4 | Oracle idle, PostgreSQL operational | Insurance against unforeseen issues | Fully reversible |
| 4 | Stop DMS CDC tasks | Confirm PostgreSQL handles load | Restartable |
| 4–7 | Archive to S3 Glacier Deep Archive | 7-year compliance retention at reduced cost | Archived data retrievable |
| 7 | Oracle instance shutdown | End active operation | Restartable if needed |
| 8 | License return processing | Begin savings realization | Administrative process |
| 16 | Hardware decommissioning | Full decommissioning | Irreversible |
The financial benefits of decommissioning extend far beyond the elimination of high-cost licensing and infrastructure. For ZCINS, the shift to a cloud-native PostgreSQL architecture unlocked:
- Operational efficiency: Simplified management and automated patching allowed the redeployment of DBA personnel to higher-value tasks.
- Reinvestment in innovation: The substantial annual savings were redirected into real-time analytics and machine learning capabilities, initiatives that were previously cost-prohibitive under Oracle’s licensing model.
The financial and operational savings from decommissioning create the runway for the next phase of maturity: establishing the automation and team capabilities that sustain long-term PostgreSQL operational excellence.
Operational excellence foundation
Successful workload modernization requires a dual focus: automating the technical environment to provide consistency and support for the people who manage it. By combining IaC with a rigorous team training curriculum, ZCINS transitioned from existing management to a cloud-native model where both the stack and the staff are optimized for PostgreSQL.
Infrastructure provisioning
ZCINS accelerated its migration by using AWS CloudFormation, reducing provisioning time from days to hours. ZCINS established standardized templates to provide environment consistency:
- Compute: Aurora clusters launched with db.r6g.2xlarge primaries and three db.r6g.xlarge Multi-AZ read replicas.
- Memory tuning: Parameters were pre-configured for PostgreSQL, setting shared_buffers to 25% and effective_cache_size to 75% of instance RAM.
- Storage and networking: High-demand systems (Billing) used io2 with 10,000 IOPS, while the Policy system leveraged gp3. All clusters were deployed in private subnets across three AZs, using VPC Endpoints for secure Amazon S3 and Lambda access.
Hybrid platform strategy validation
Workload-specific service selection produces superior outcomes compared to dogmatic single-service approaches. ZCINS’s hybrid strategy demonstrates that matching service capabilities to workload characteristics optimizes both performance and cost. Aurora (auto-scaling Aurora variant) was used for high-concurrency workloads, Amazon RDS with gp3 storage for predictable I/O patterns, and Aurora Serverless v2 for variable traffic.
| Service category | AWS service | Characteristic | Impact |
| Claims Processing | Aurora I/O-Optimized | High concurrency, read scaling, <30s failover. Aurora I/O-Optimized selected for Claims due to high read/write ratio. Serverless v2 auto-scales between 0.5 and 64 ACUs. | Performance justified premium |
| Billing Engine | RDS with gp3 | Predictable I/O patterns | Significant monthly savings vs io2 |
| Policy Admin | RDS → Aurora (Month 9) | Growth required read replicas | Workload evolution drove change |
| Customer Portal | Aurora Serverless v2 | 8x traffic variation | Eliminated idle capacity costs |
Continuous improvement framework
To maintain long-term stability and efficiency for the modernized PostgreSQL environment, organizations need a continuous improvement lifecycle focused on monitoring, analysis, optimization, and validation. See Figure 1.
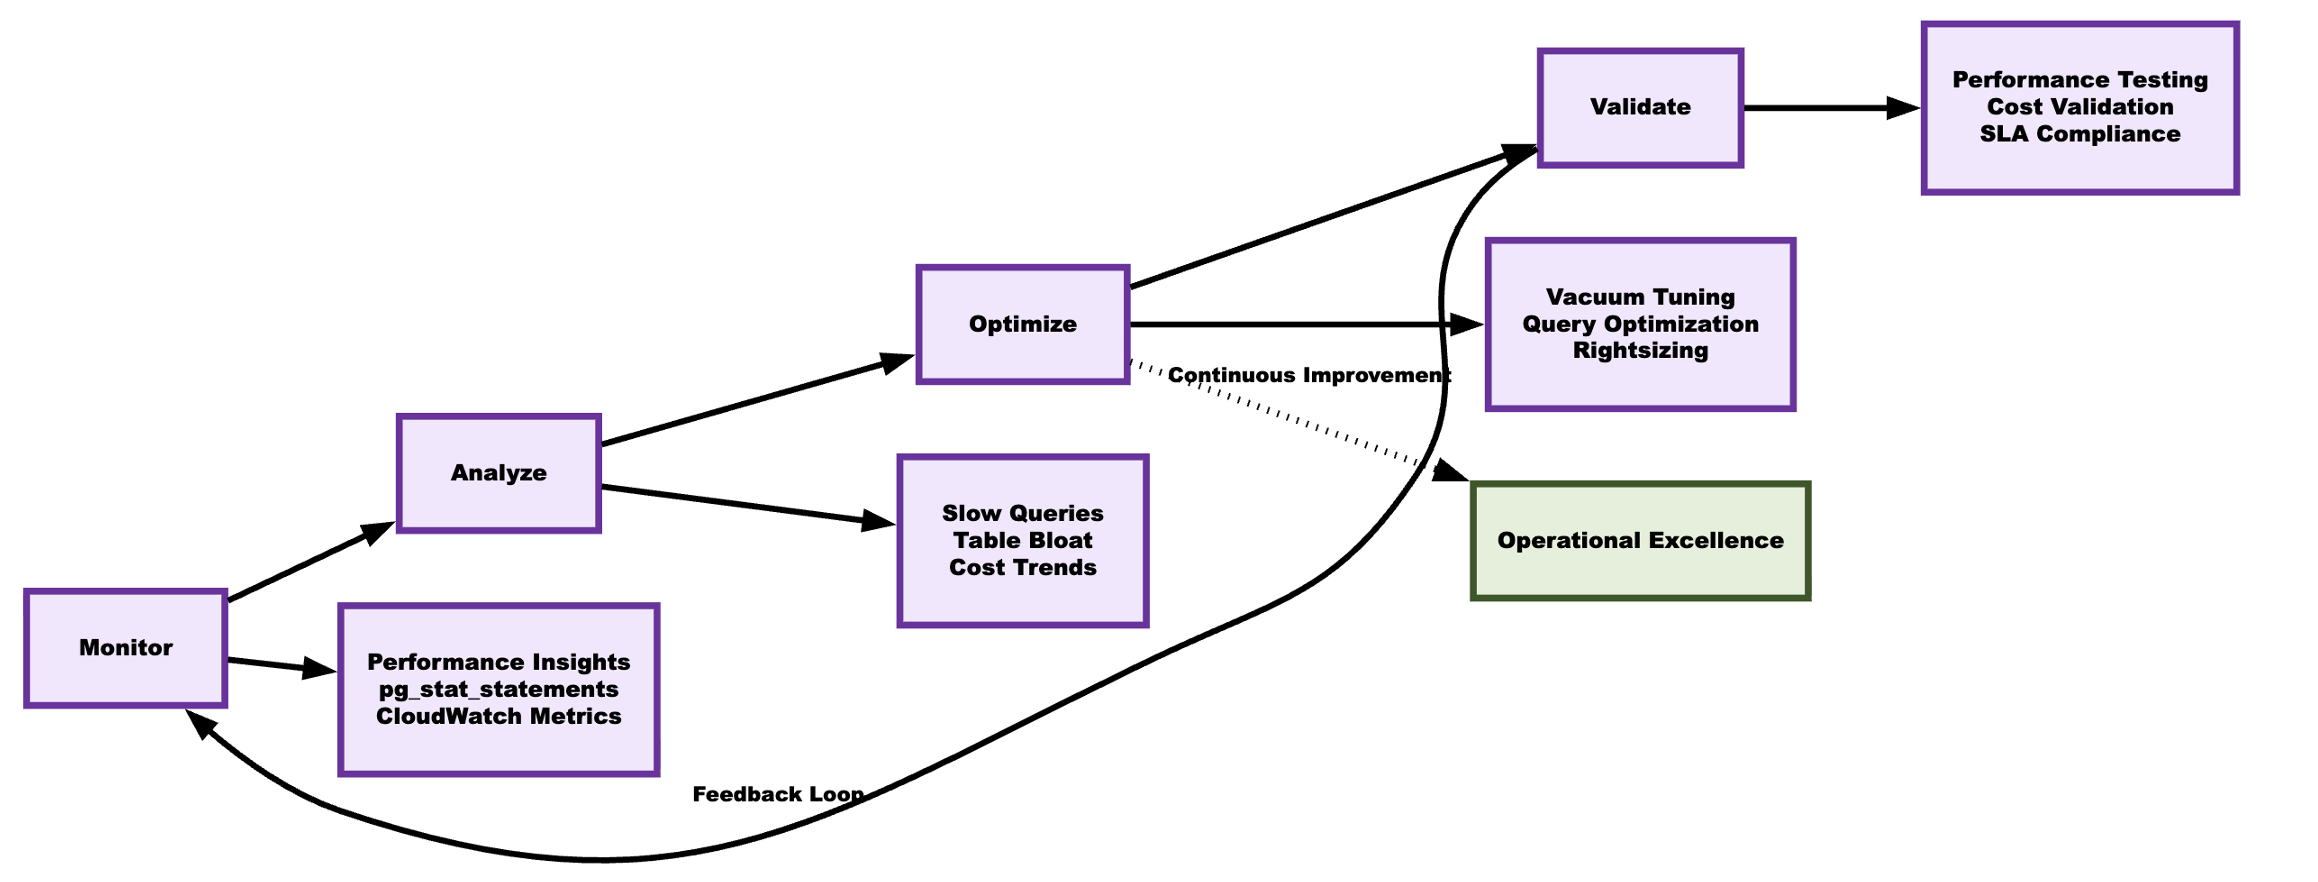
Figure 1: Continuous improvement lifecycle
ZCINS established a quarterly review cadence covering performance baselines (established at month 3 post-cutover to enable regression detection), capacity forecasting (claims DB growing at 8GB/month, projecting 96GB annually), version upgrades, and architecture assessment (Policy Admin workload growth justified migrating from RDS to Aurora for read scaling).
Team enablement investment
Technical optimization is only sustainable if the team evolves alongside the stack. ZCINS invested in a 40-hour per-person training program that combined formal PostgreSQL certification with hands-on Runbook development.
For ZCINS, this investment paid for itself within three months by eliminating external consulting fees, slashing troubleshooting time, and allowing the internal team to identify optimizations, like the shared_buffers tuning, proactively.
Cleanup
This post describes operational practices for an existing PostgreSQL environment. No new AWS resources are provisioned as part of this walkthrough. The decommissioning roadmap in Table 7 includes the structured cleanup of legacy Oracle infrastructure. Follow the week-by-week guidance to systematically retire Oracle instances, stop AWS DMS CDC tasks, archive data to Amazon S3 Glacier Deep Archive, and return Oracle licenses to realize the full financial benefits of migration.
Conclusion
Modernization isn’t complete at cutover. Organizations treating cutover as the finish line miss the real value. ZCINS’s commitment to 12 months of systematic optimization, comprehensive observability using CloudWatch Database Insights, continuous cost management, and team enablement transformed their substantial annual savings into sustained operational excellence.
The journey from Oracle to PostgreSQL on AWS represents more than a database migration, it is an organizational transformation from existing operational models to cloud-native practices. Organizations that embrace optimization as continuous evolution rather than a discrete project discover that modernization delivers not just cost savings, but capabilities that transform how they build and operate applications in the cloud.
To begin realizing these benefits in your own environment, start by implementing the observability foundation described in this post for your most critical PostgreSQL workloads. Deploy the Amazon CloudWatch dashboards and Amazon CloudWatch Database Insights configurations and use the AWS CloudFormation templates referenced throughout this series to provision consistent, well-tuned environments. The systematic approach ZCINS followed, observability first, then optimization, then decommissioning, provides a repeatable framework for any Oracle-to-PostgreSQL migration.