AWS Cloud Operations Blog
Announcing Private VPC data source support for Amazon Managed Grafana
Today, we are announcing Amazon Managed Grafana support for connecting to data sources inside an Amazon Virtual Private Cloud (Amazon VPC). Customers using Amazon Managed Grafana have been asking for support to connect to data sources that reside in an Amazon VPC and are not publicly accessible. Data in Amazon OpenSearch Service clusters, Amazon RDS instances, self-hosted data sources, and other data sensitive workloads often are only privately accessible. Customers have expressed the need to connect Amazon Managed Grafana to these data sources securely while maintaining a strong security posture.
Amazon Managed Grafana is a fully managed service based on open-source Grafana that allows customers to set up and use Grafana in their environments easily. Using Amazon Managed Grafana, customers can free themselves from the operational burden of provisioning and managing infrastructure, deploying and patching software, scaling the infrastructure and securing the workload. Amazon Managed Grafana also supports enterprise grade authentication for customers through AWS IAM Identity Center (successor to AWS Single Sign-On) and SAML integration with 3rd party identity providers.
Setup instructions
In this example, we will connect to an OpenSearch Service cluster that is deployed in a VPC. Follow the instructions here to launch an OpenSearch Search cluster in a VPC if you don’t have one.
Create the IAM Role to connect to the Amazon OpenSearch Service endpoint
- Go to the AWS Identity and Access Management (IAM) console and create a policy with the following trust policy. This will allow Amazon Managed Grafana to make calls to the Amazon OpenSearch Service on your behalf.
- Create a Permission policy with the following statement and attach to the role. This will allow the Amazon Managed Grafana workspace to query the OpenSearch Service.
- Give the role a name and save it. We have named the IAM Role as grafanaOpenSearchRole in my environment.
Create Amazon Managed Grafana workspace
- Login to the AWS console and go to Amazon Managed Grafana home page.
- Select Create workspace.
- Provide a name for your workspace on the Specify workspace details page.
- In the Configure settings screen select one of the Authentication methods between AWS IAM Identity Center and Security Assertion Markup Language (SAML).
- On the same screen under Permission type, select Customer managed option. As an alternate, you could also simply use the Service managed option to connect to OpenSearch. If you choose to do that, you wouldn’t need the IAM Role created in the previous section.
- In the Select an existing role lookup text box, select the IAM Role created earlier. Here, we are selecting the grafanaOpenSearchRole which was created before.
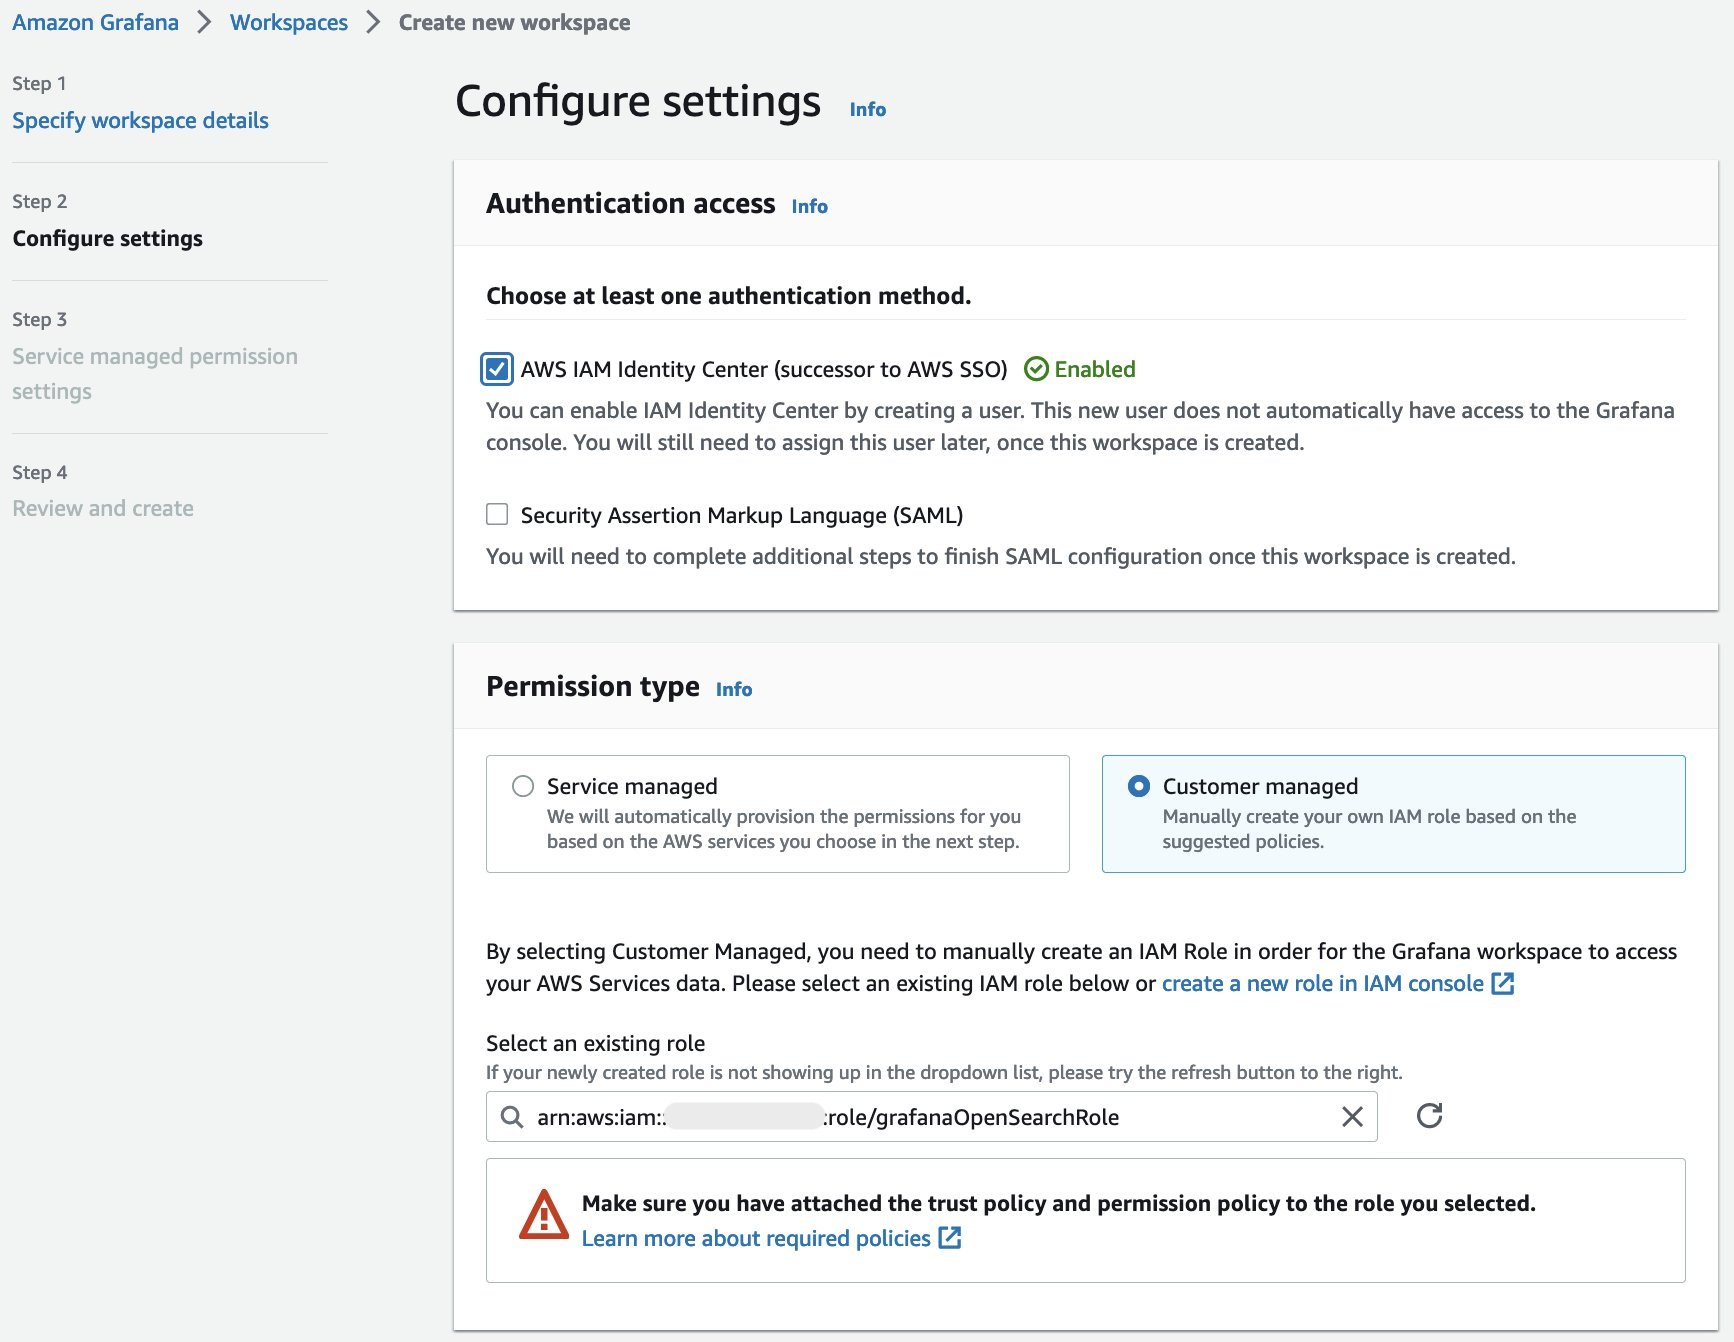
Figure 1. Fig 1: Creating Amazon Managed Grafana workspace with a customer managed role
- Under Outbound VPC connection section, select the VPC and the subnet of your private data source and select the required security groups.
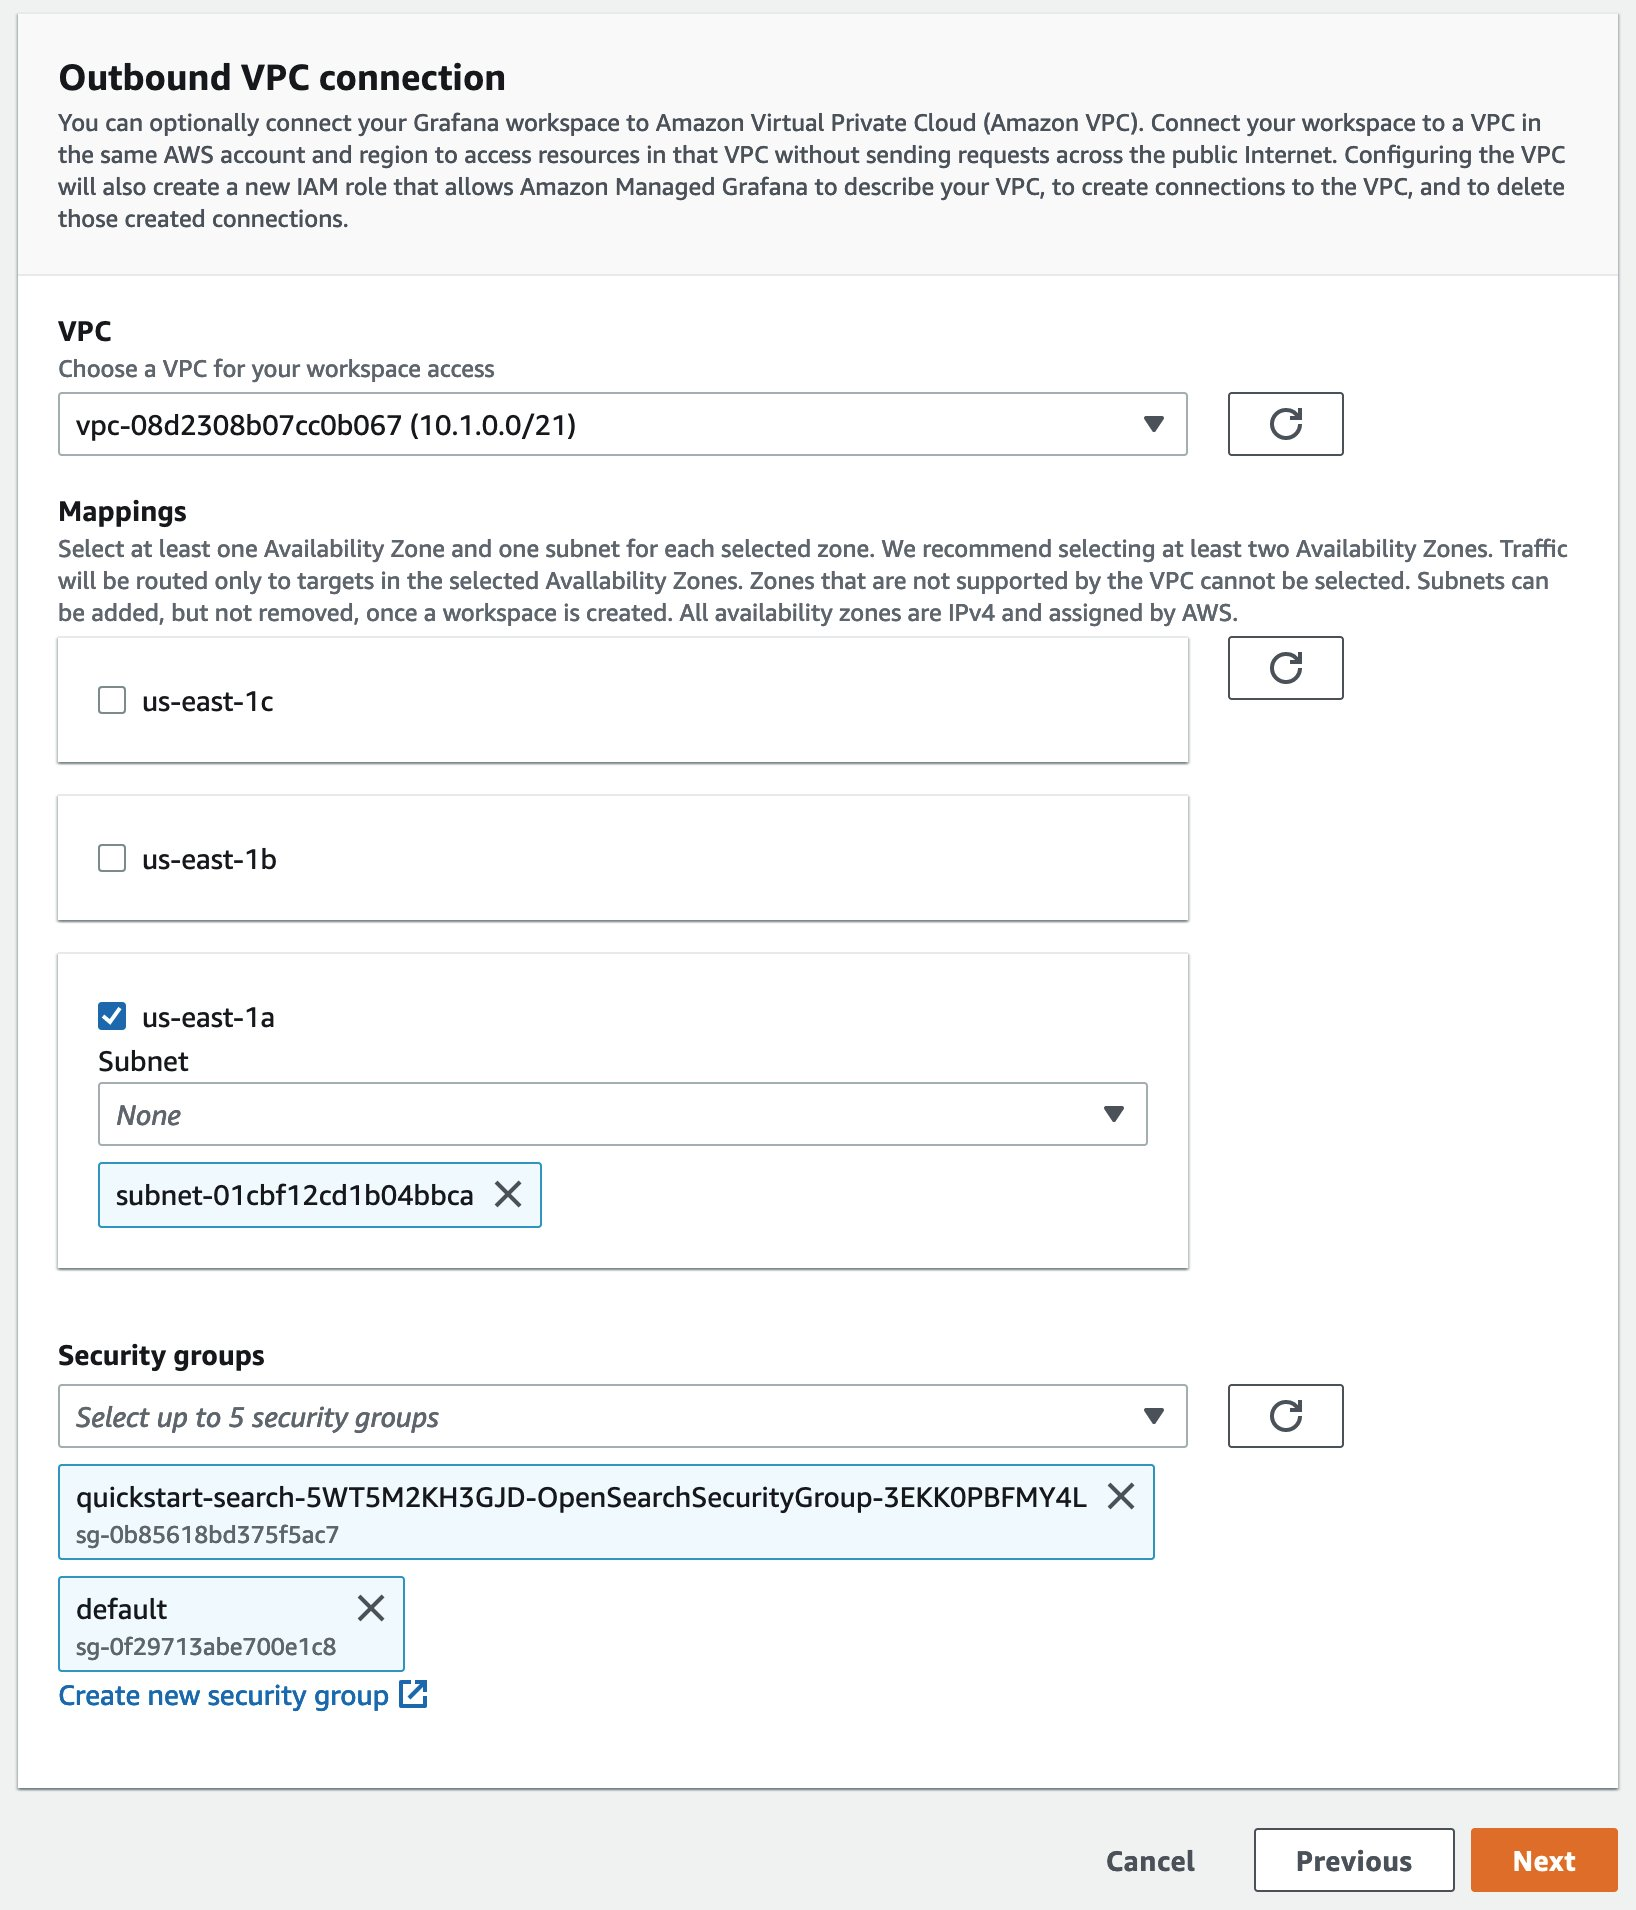
Figure 2. VPC data source connection settings for Amazon Managed Grafana workspace
- Select Next on the Service managed permission settings screen.
- Select Create workspace on the Review and create screen to create the workspace.
Once you configure direct connectivity between a Grafana workspace and a VPC, Amazon Managed Grafana creates and manages an elastic network interface (ENI) per subnet to connect to the VPC. This enables the Grafana workspace to connect to data sources within the VPC, such as OpenSearch domains or RDS databases. Additionally, all traffic is now routed through the configured VPC, including alert destination and data source connectivity. In this mode, if the Grafana workspace needs to connect to data sources in another VPC, you can establish a VPC peering connection to route traffic between VPCs. If the Grafana workspace needs to connect to Internet-facing data sources such as DataDog and PagerDuty, establish a connection between your VPC and a gateway such as an internet gateway or transit gateway to connect your VPC to the internet. You can also use a transit gateway as a central hub to route traffic between your VPCs, VPN connections, and AWS Direct Connect connections.
Connect to the private data source from Grafana
- Login to the Amazon Managed Grafana console and click on Data sources under the gear icon on the left navigation bar.
- Select Add the OpenSearch Service data source from the AWS Data Sources option from the left navigation bar.
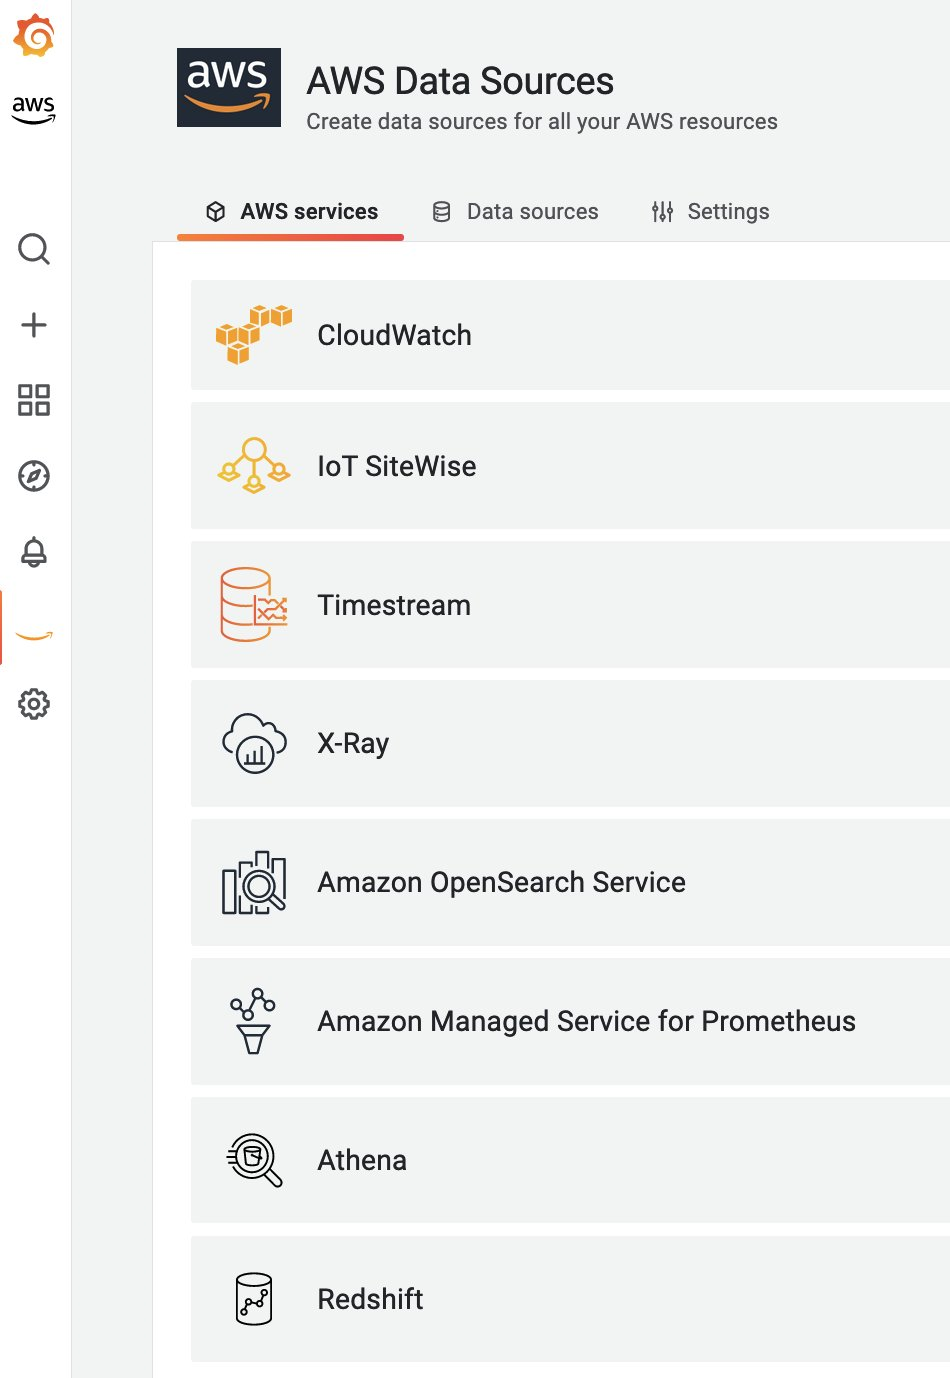
Figure 3. List of AWS data sources in Amazon Managed Grafana
- Select the AWS Region where your OpenSearch Service is and select Add 1 data source
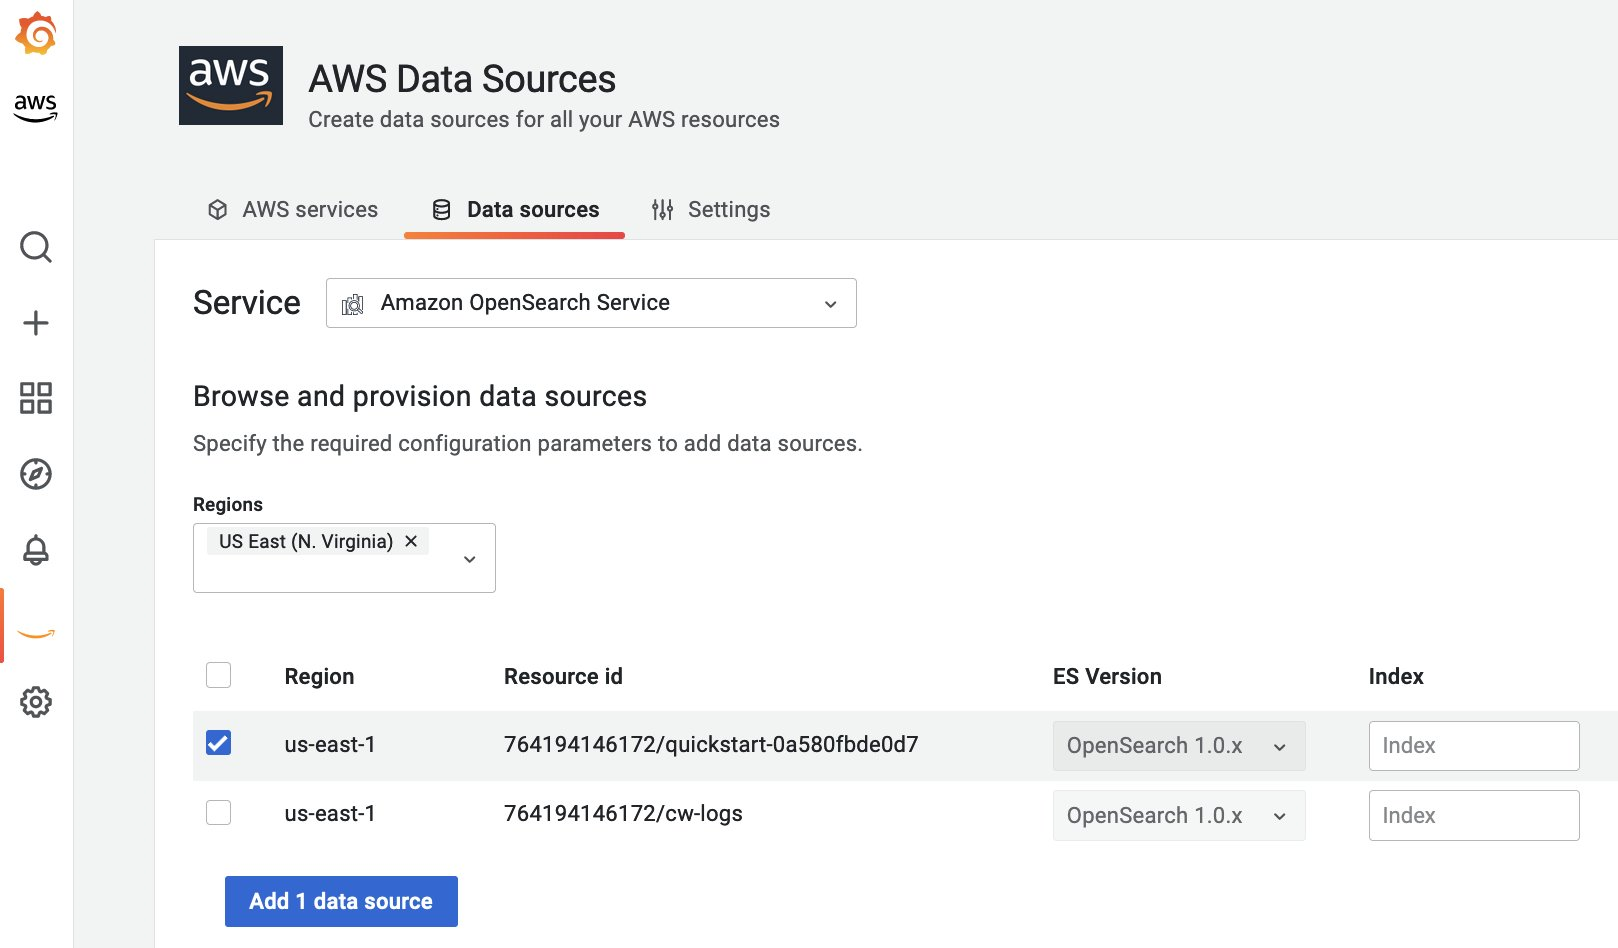
Figure 4. Connecting to OpenSearch Service data source
- The endpoint URL will be automatically fetched by the data source, as shown here. Ensure your Time field name is set to the right field on the index. Select Save & test and you should see a message as shown below indicating a successful connection to the data source.
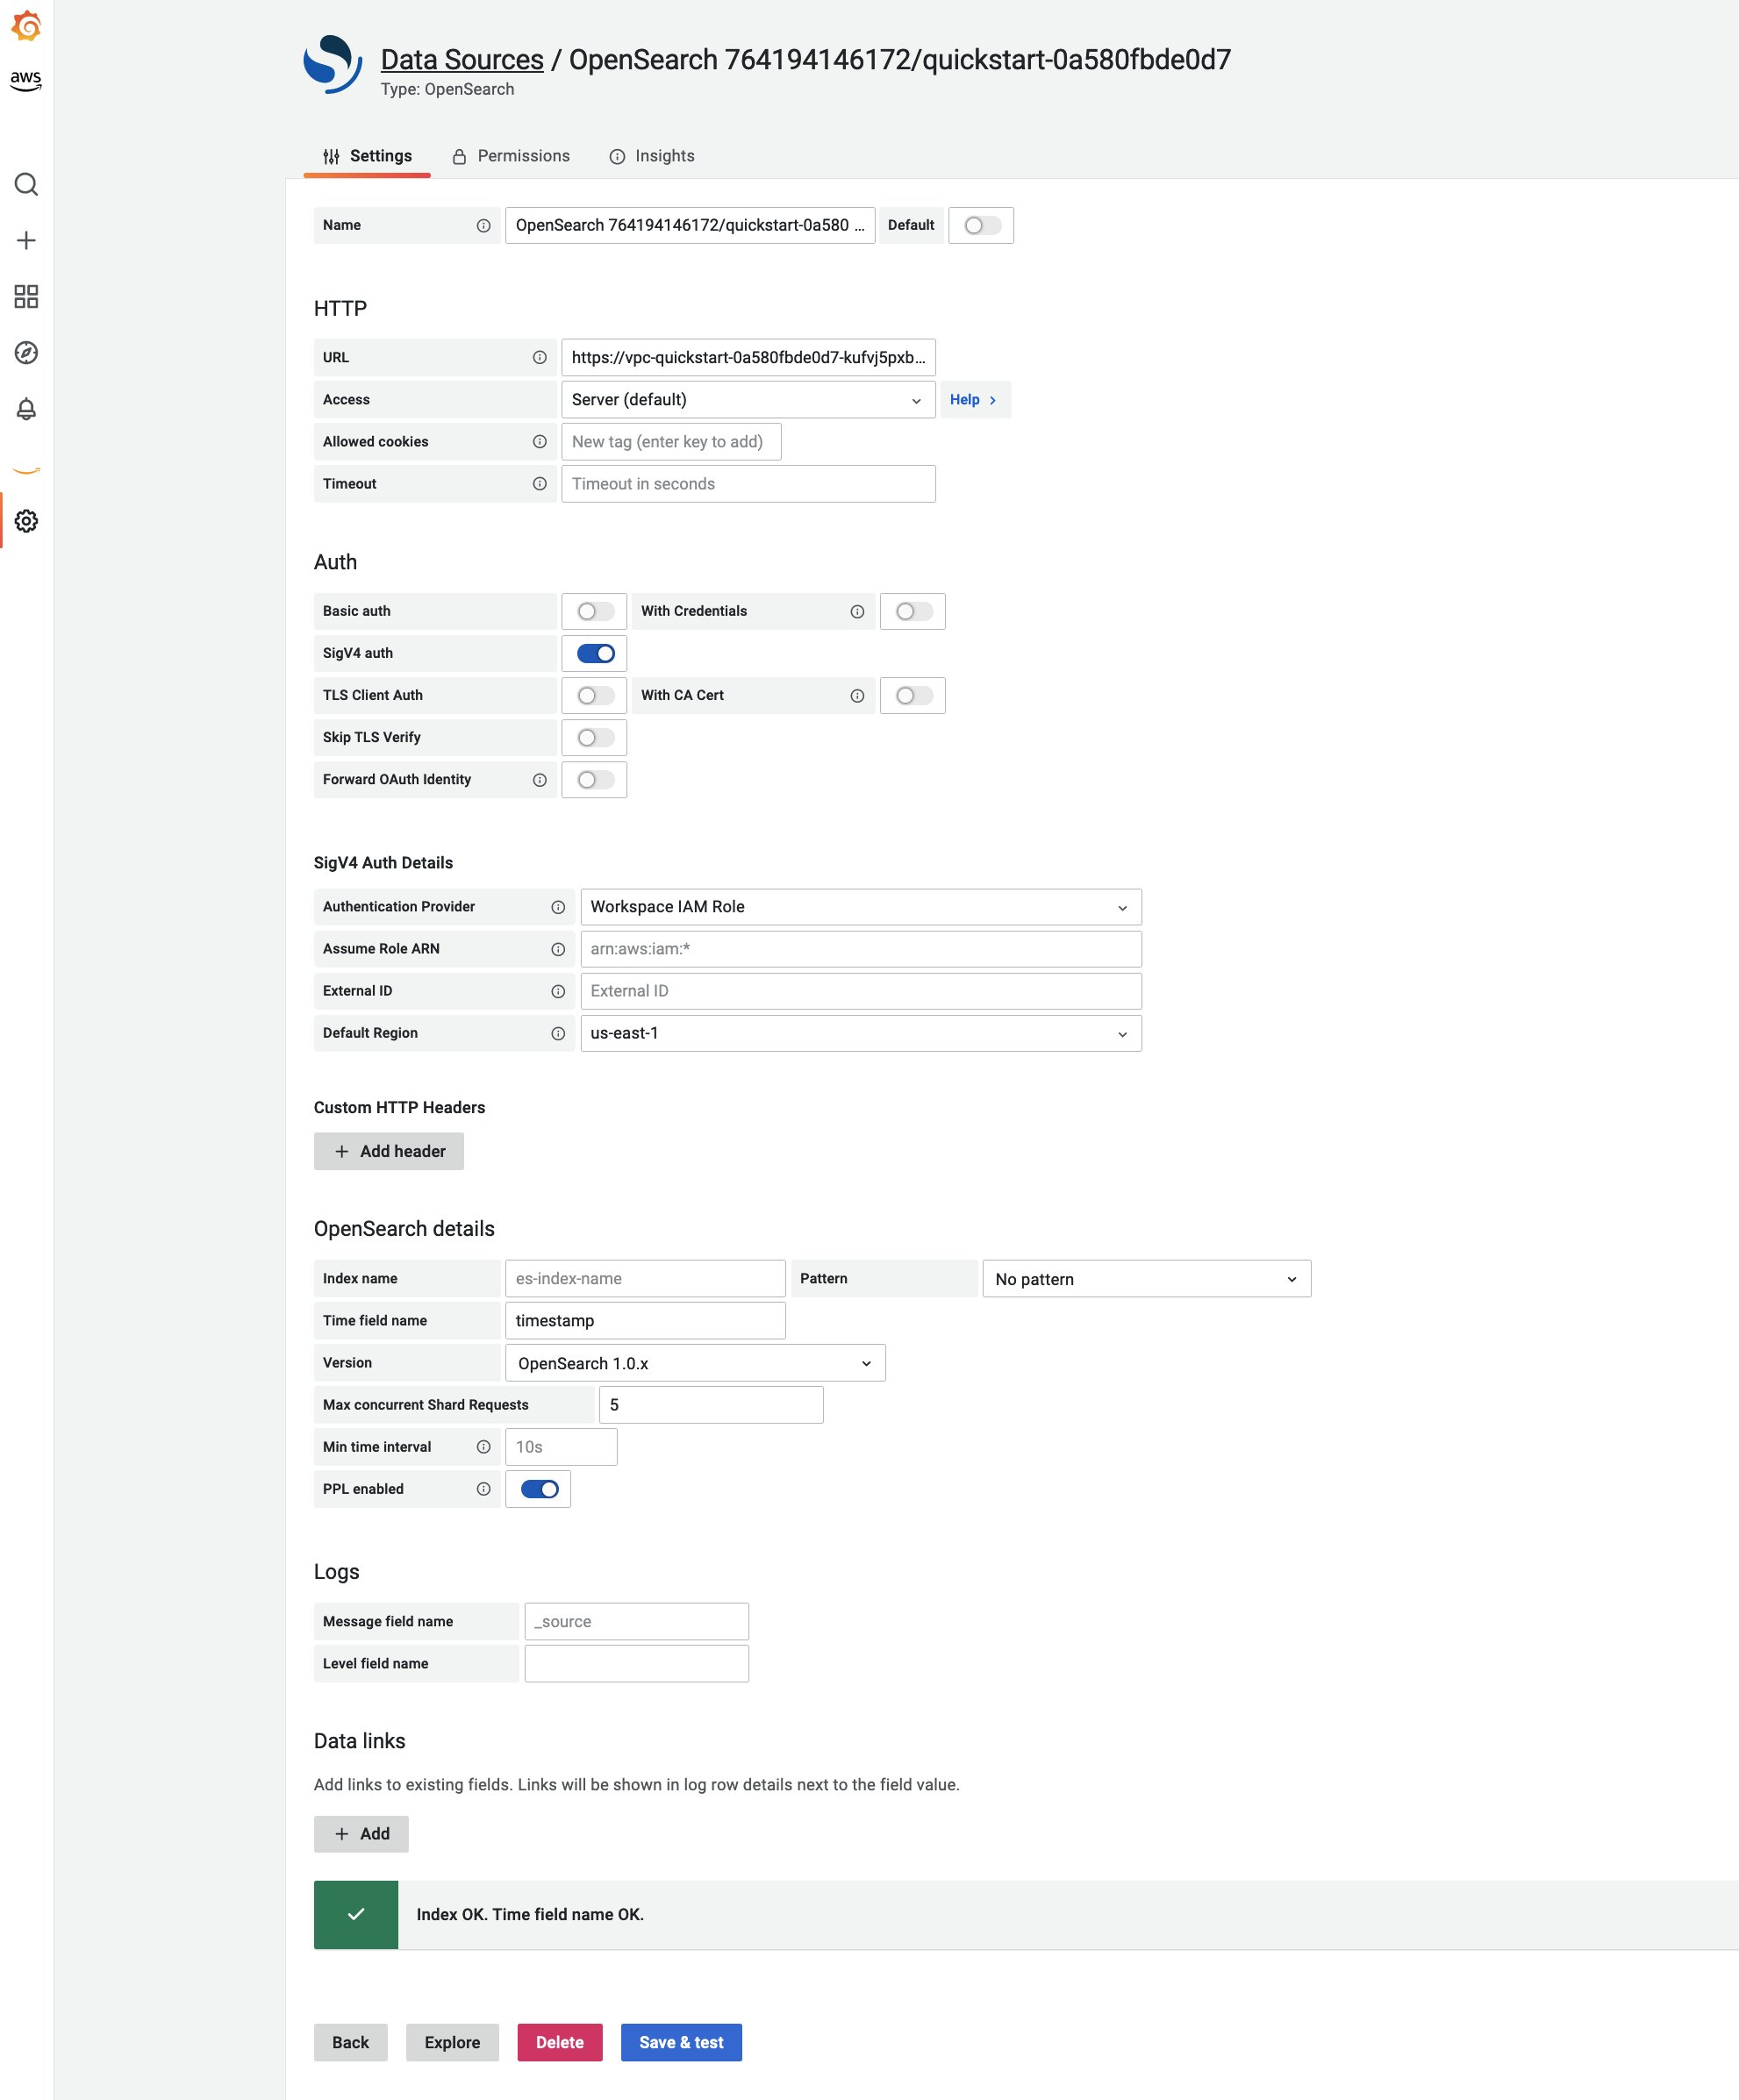
Figure 5. Successful connection setup to OpenSearch Service endpoint
Querying OpenSearch Service
- Now go to the Explore screen on Amazon Managed Grafana and select the OpenSearch Service data source we just created.
- You can run your query to see results from the OpenSearch Service cluster using Piped Processing Language (PPL).
- In this screenshot below, we are executing the following PPL query which makes use of the sample log dataset that you can deploy after you setup the OpenSearch Service cluster.
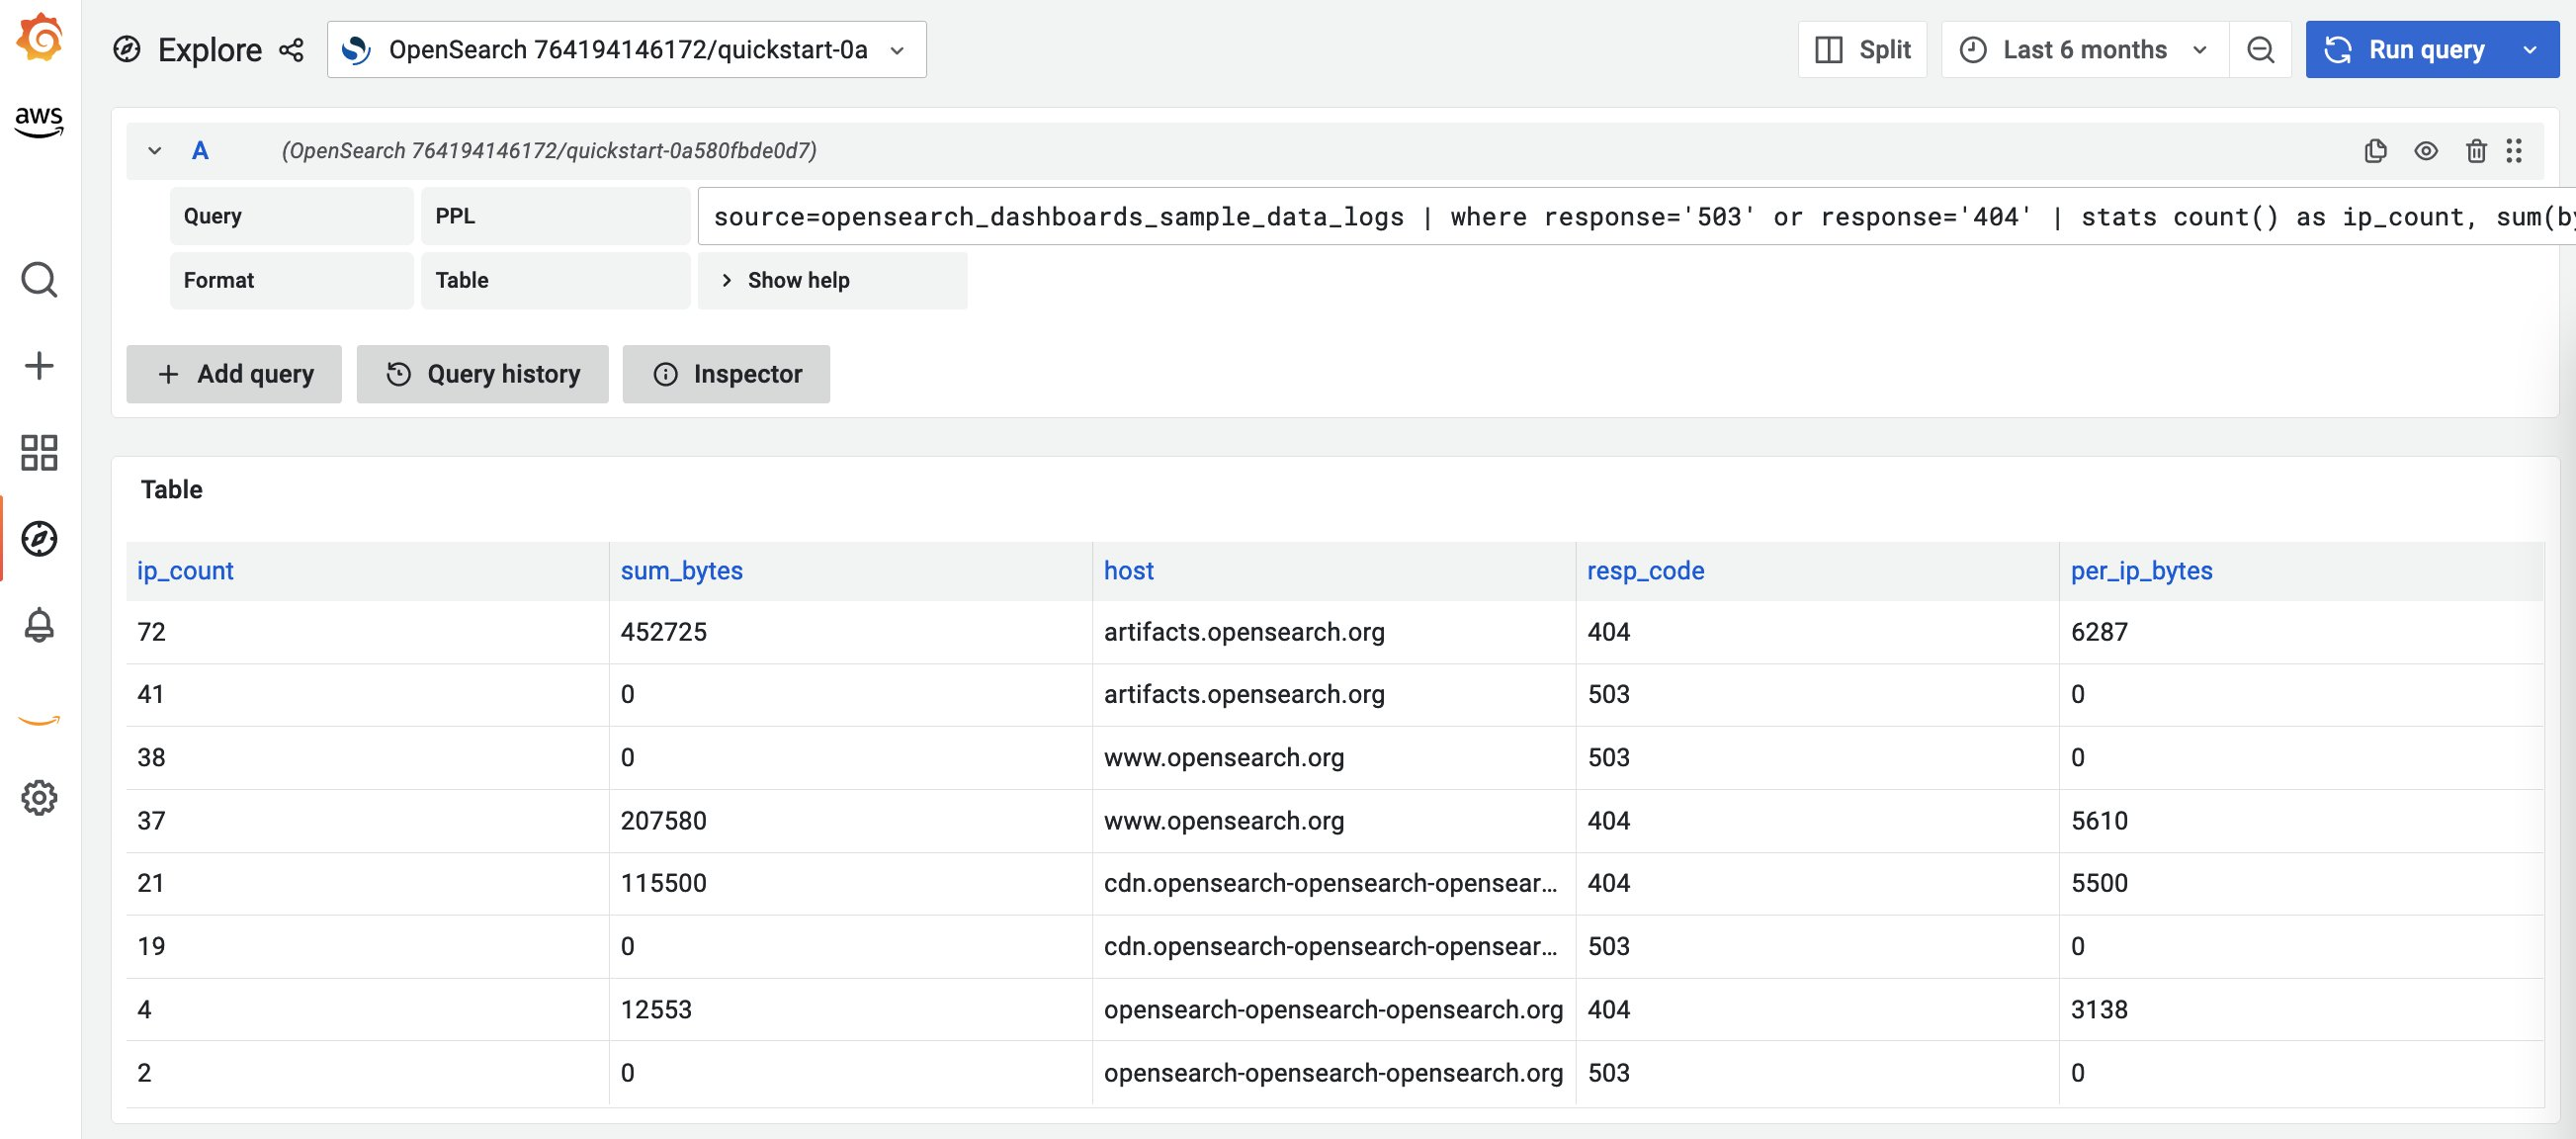
Figure 6. Querying OpenSearch Service endpoint
Conclusion
In this blog post, we showed how you can use Amazon Managed Grafana to securely connect to a data source deployed in a VPC that is not publicly accessible. This has been one of the important features that our customers have requested for and we encourage customers to provide inputs through GitHub as we are actively collecting use cases and feedback from the community on how we should expand this the future. Learn more about this feature in our documentation.
To get a hands-on experience on this feature, go to the One Observability workshop.
Other useful resources on Amazon Managed Grafana:
- Fine-grained access control in Amazon Managed Grafana using Grafana Teams.
- Setting up Amazon Managed Grafana cross-account data source using customer managed IAM roles.
About the authors: