AWS Cloud Operations Blog
AWS Observability ICYMI: Jan-May 2026
Welcome to the first edition of the AWS Observability ICYMI (In Case You Missed It) recap! The first five months of 2026 has been transformational for AWS observability with over 40 launches across Amazon CloudWatch, AWS X-Ray, Amazon Managed Grafana, and Amazon Managed Service for Prometheus. Two major themes defined this period: OpenTelemetry as the unified instrumentation standard and AI-powered operations that make observability accessible to everyone.
Whether you’re running containers on Amazon Elastic Kubernetes Service (EKS), managing databases across Regions, or building AI-assisted workflows, there’s something here for you. Let’s dive in.
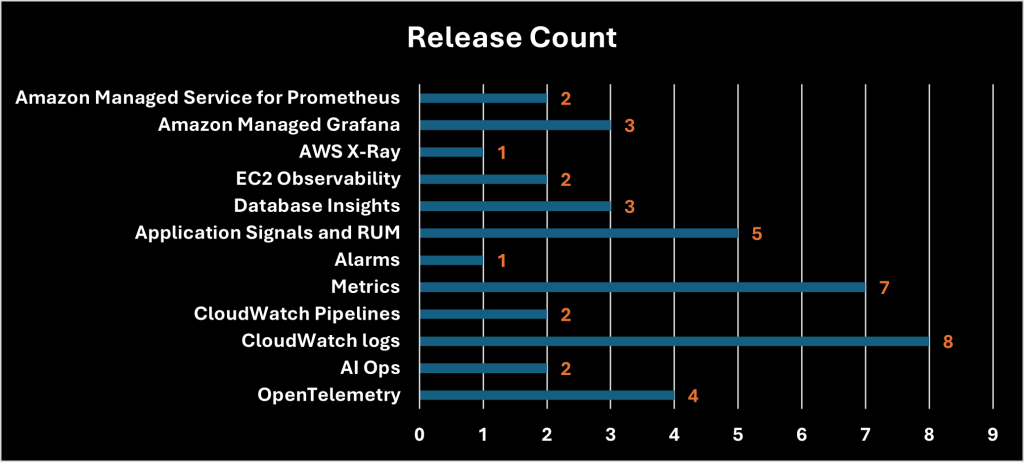
Fig 1. AWS Observability release count by category
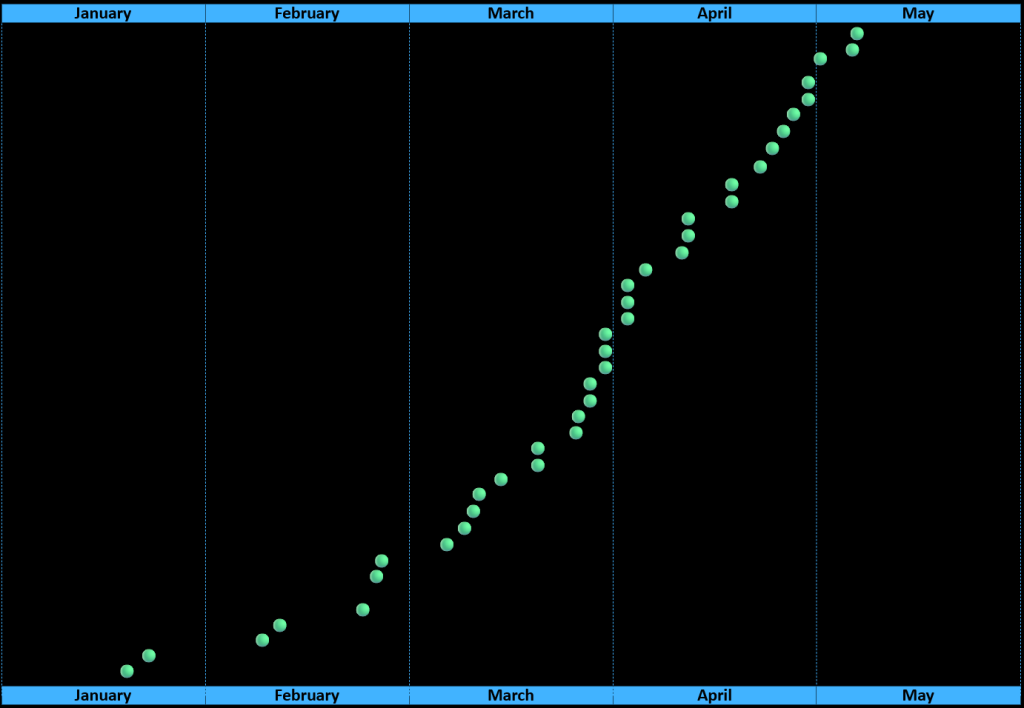
Fig 2. AWS Observability Release Calendar List
OpenTelemetry Goes Native in CloudWatch
CloudWatch OpenTelemetry Metrics (Preview)
Send metrics directly using the OpenTelemetry Protocol (OTLP) without custom conversion logic or additional tooling. OpenTelemetry metrics support up to 150 labels per metric and metric types including gauge, sum, histogram, and exponential histogram.
PromQL and Query Studio (Preview)
Query Studio combines PromQL and CloudWatch Metric Insights in a single interface-query AWS vended metrics and OpenTelemetry metrics using the language you prefer without switching between consoles. Includes a visual form builder and code editor. Available in US East (N. Virginia), US West (Oregon), Asia Pacific (Sydney), Asia Pacific (Singapore), and Europe (Ireland).
Container Insights with OpenTelemetry for EKS (Preview)
OpenTelemetry-native metrics collection comes to Kubernetes monitoring, aligning container observability with the broader OpenTelemetry strategy.
Cross-Region Telemetry Enablement Rules
Audit and enable telemetry across multiple Regions from a single region. Available in all AWS commercial Regions.
AI-Powered Operations: The New Interface for Observability
CloudWatch Pipelines AI Configuration
Configure log processors using natural language descriptions powered by generative AI. Instead of manually writing transformation rules, describe your intent and have the system generate the appropriate configuration.
Investigate application health issues faster with AI agent-assisted workflows directly in Kiro. This provides AI-native observability embedded directly in developer tooling.
CloudWatch Logs: More Power, More Flexibility
Concurrent query limit for Logs Insights QL increased from 30 to 100. You can now execute 10 StartQuery API and 10 GetQueryResults API calls per second per account per Region.
New support for HTTP Log Collector, ND-JSON, Structured JSON, and OpenTelemetry protocols for log ingestion-more flexible options beyond the CloudWatch agent or AWS SDK.
Infrequent Access Enhancements
The Infrequent Access log class gained data protection capabilities and support for OpenSearch PPL and SQL query languages, making the cost-optimized tier viable for workloads that previously required Standard class.
Telemetry Collection Auto-Enablement Expansion
Automatic enablement now supports Amazon CloudFront Standard access logs, AWS Security Hub CSPM finding logs, and Amazon Bedrock AgentCore memory and gateway logs/traces.
Multi-Account Centralization by Data Source
Centralize logs based on data source name and type across multiple accounts-granular control over which logs flow to central accounts versus remaining local.
CloudWatch Logs Insights lookup query command
With the lookup command, you can join log data against a lookup table at query time, automatically enriching your results with meaningful values.
Logs Insights JOIN and sub-query commands
With JOIN and sub-query commands, you can accelerate troubleshooting across scenarios such as correlating application and infrastructure errors across different services and log groups, analyzing security events across multiple services, or tracking user sessions across distributed systems.
Logs Insights querying by log group tags
With this launch, customers can run a query across all log groups that share common tags. As log group tags are added or removed, queries automatically reflect the matching log groups, reducing operational overhead as environments grow.
CloudWatch Pipelines: Filter, Route, and Transform
Drop Events and Conditional Processing
New drop events processor and conditional processing capabilities allow content-aware filtering, routing, and transformation within pipelines. For more information on CloudWatch Pipelines, visit Amazon CloudWatch Pipelines documentation.
Compliance and Governance Controls
Data integrity and access control capabilities for log pipelines-addressing enterprise audit trail and controlled data flow requirements.
Metrics
Amazon Bedrock Time To First Token and Quota Consumption
TimeToFirstToken measures the latency from when a request is sent to when the first token is received, for streaming APIs (ConverseStream and InvokeModelWithResponseStream). EstimatedTPMQuotaUsage tracks your estimated Tokens Per Minute (TPM) quota consumption, including cache write tokens and output burndown multipliers, across all inference APIs (Converse, InvokeModel, ConverseStream, and InvokeModelWithResponseStream)
Three new Amazon CloudWatch metrics for virtual interfaces (VIFs) that provide visibility into Border Gateway Protocol (BGP) session health and route counts. Network engineers and operations teams managing hybrid cloud connectivity can now monitor BGP sessions natively through CloudWatch without building custom solutions or polling APIs.
AWS Private CA utilization metrics
The new metrics track the number of certificates issued by each CA and the total number of CAs in each Region, enabling you to monitor usage against these quotas and proactively manage CA lifecycle to maintain high availability.
Amazon S3 Express One Zone request metrics
You can use request metrics to track performance and monitor the operational health of applications that use S3 Express One Zone.
Amazon ECS Managed Instances supports NVIDIA GPU metrics
With the new GPU metrics, Amazon ECS Managed Instances customers can now monitor GPU capacity, utilization, memory, hardware health, and thermal conditions directly in CloudWatch.
AWS Outposts racks LagStatus CloudWatch metric
This metric provides you with the ability to monitor Outposts LAG connectivity status directly within the CloudWatch console, without having to rely on external networking tools or coordination with other teams.
Amazon ElastiCache customers can now detect network throttling, memory fragmentation, and connection exhaustion, using thirteen new Amazon CloudWatch metrics for node-based clusters. You can monitor these host-level and engine-level diagnostics directly from CloudWatch without running INFO commands on individual nodes or calculating baselines from raw byte counters.
Alarms, Application Signals, and RUM
Temporarily mute alarm notifications during planned deployments, maintenance windows, and off-hours without compromising monitoring visibility. Finally -a native solution to alert fatigue during planned changes.
Application Signals SLO Capabilities
Three new capabilities for Service Level Objectives:
● SLO Recommendations: Suggests appropriate SLO targets based on historical performance
● Service-Level SLOs: Aggregates individual SLOs into service-level views
● SLO Performance Report: Executive-ready summaries of SLO compliance
RUM in European Sovereign Cloud
CloudWatch RUM expanded to the AWS European Sovereign Cloud (eusc-de-east-1) monitor web application performance without data leaving the sovereign boundary.
An improved overview surfaces fleet-wide health, SLO breaches, and distributed tracing coverage on a single page.
Amazon CloudWatch RUM Session Replay for Web Applications
Session Replay helps developers identify user experience issues — such as forms that fail to render or navigation flows that break — that can silently impact conversion and engagement, even when no one reports them
Amazon CloudWatch Database Insights
Regional Expansion January 20 & March 11
On-demand analysis expanded to Asia Pacific (New Zealand, Taipei, Thailand) and Mexico (Central), followed by AWS GovCloud (US). The feature automatically compares selected time periods against baseline performance, identifies anomalies, and provides specific remediation advice.
Lock Contention Diagnostics for RDS PostgreSQL
Provides lock contention diagnostics for Amazon RDS for PostgreSQL instances. This feature helps you identify the root cause behind both ongoing and historical lock contention issues within minutes. The lock contention diagnostics feature is available exclusively in the Advanced mode of CloudWatch Database Insights.
Amazon EC2
Organization-Wide EC2 Detailed Monitoring
Auto-enable EC2 for detailed monitoring across your entire AWS Organization from a single configuration point.
EC2 Visual Agent Configuration Editor
The EC2 console now includes a visual configuration editor for the CloudWatch agent-no more manual JSON editing.
AWS X-Ray: The OpenTelemetry Migration Is Official
X-Ray SDKs and Daemon Enter Maintenance Mode
AWS X-Ray SDKs and Daemon formally entered maintenance mode. From this date forward, releases are limited to security fixes only.
What this means for you:
● The X-Ray service remains fully supported-console, trace processing, and backend capabilities continue unchanged
● Migrate to OpenTelemetry-based instrumentation via AWS Distro for OpenTelemetry (ADOT)
● Language-specific migration guides are available for Java, Python, Node.js, .NET, Go, and Ruby
● Both zero-code auto-instrumentation and manual instrumentation are supported
Amazon Managed Grafana
AWS GovCloud (US) Availability
Available in both GovCloud US-West and US-East Regions for government customers and regulated industries.
Encrypt with KMS Customer Managed Keys
Encrypt workspace data with your own encryption keys for compliance. Available in all Regions except GovCloud.
Grafana 12.4 Workspace Creation
A packed release:
● Drilldown apps Queryless, point-and-click exploration of Prometheus metrics, Loki logs, Tempo traces, and Pyroscope profiles
● Scenes-powered dashboards Boosted rendering performance
● Enhanced CloudWatch plugin PPL/SQL query support, cross-account Metrics Insights, and log anomaly detection
● Rebuilt table visualization CSS cell styling and interactive Actions buttons
Amazon Managed Service for Prometheus
While no standalone Amazon Managed Service for Prometheus features launched this period, two ecosystem integrations significantly enhance its value:
OpenSearch Ingestion → Amazon Managed Service for Prometheus Sink
Build fully managed, end-to-end metrics ingestion pipelines without custom forwarding infrastructure. Route metrics to Amazon Managed Service for Prometheus for PromQL analysis while sending logs/traces to OpenSearch through a single pipeline.
Amazon OpenSearch Service supports Managed Prometheus and agent tracing
Query Prometheus metrics directly using native PromQL syntax alongside logs and traces in OpenSearch without duplicating data.
Recap
If you take away three things:
1. Start your OpenTelemetry migration now. With native OpenTelemetry metrics in CloudWatch, PromQL Query Studio, and X-Ray SDKs entering maintenance mode, the path forward is clear. ADOT is your instrumentation layer.
2. AI is the new observability interface. MCP servers, natural-language pipeline configuration, and Kiro integration mean you can increasingly talk to your monitoring data instead of writing queries.
3. Cost optimization got easier. Infrequent Access log class enhancements, free OpenTelemetry metrics during preview, and no-cost Pipeline features lower the barrier to comprehensive observability.
Still looking for more?
● Join a live or hands-on session from our Cloud Operations Enablement series: https://aws-experience.com/amer/smb/events/series/Cloud-Operations-Enablement
● Check out the CloudWatch documentation: https://docs.aws.amazon.com/AmazonCloudWatch/latest/monitoring/
● Read the MCP servers blog post: https://aws.amazon.com/blogs/mt/enhance-your-aiops-introducing-amazon-cloudwatch-and-application-signals-mcp-servers/
See you next quarter!