AWS Cloud Operations Blog
Build a Multi Account Patch Compliance Dashboard with Kiro Specs
Introduction
Robust patch management is essential for maintaining system security, reliability, and compliance across your IT infrastructure. AWS Systems Manager Patch Manager provides a full-featured patching solution, enabling you to automate the deployment of operating system updates to managed nodes across AWS accounts, on-premises, and multicloud environments. However, as your organization scales across dozens or hundreds of accounts, tracking and reporting on patch compliance can become increasingly challenging.
AWS Systems Manager offers features including Inventory, Explorer, and Compliance to report the overall compliance of managed nodes. Resource Data Sync exports this patch compliance data to Amazon S3 for each instance.
In this post, you learn how to build a lightweight, self-contained patch compliance dashboard with Kiro that provides unified visibility across all your AWS accounts. The dashboard provides compliance visibility in seconds, is cost-efficient to run (serverless, pay-per-use), and exposes zero public attack surface by using AWS Systems Manager Session Manager Port forwarding feature for private access.
This post uses Kiro’s spec-driven development approach — a structured workflow that moves from requirements to design to implementation tasks — to build this solution systematically.
Solutions Overview
Kiro’s spec-driven approach structures the work into three phases: requirements (what to build), design (how it fits together), and tasks (implementation steps). Kiro generates each phase based on your description and steering file context, then implements the tasks one by one. All the components described below — Amazon Virtual Private Cloud (Amazon VPC), AWS Lambda functions, Elastic Load Balancing(ELB), Amazon S3, Amazon EventBridge rule, and AWS CloudFormation templates — are created as part of this spec-driven development process.
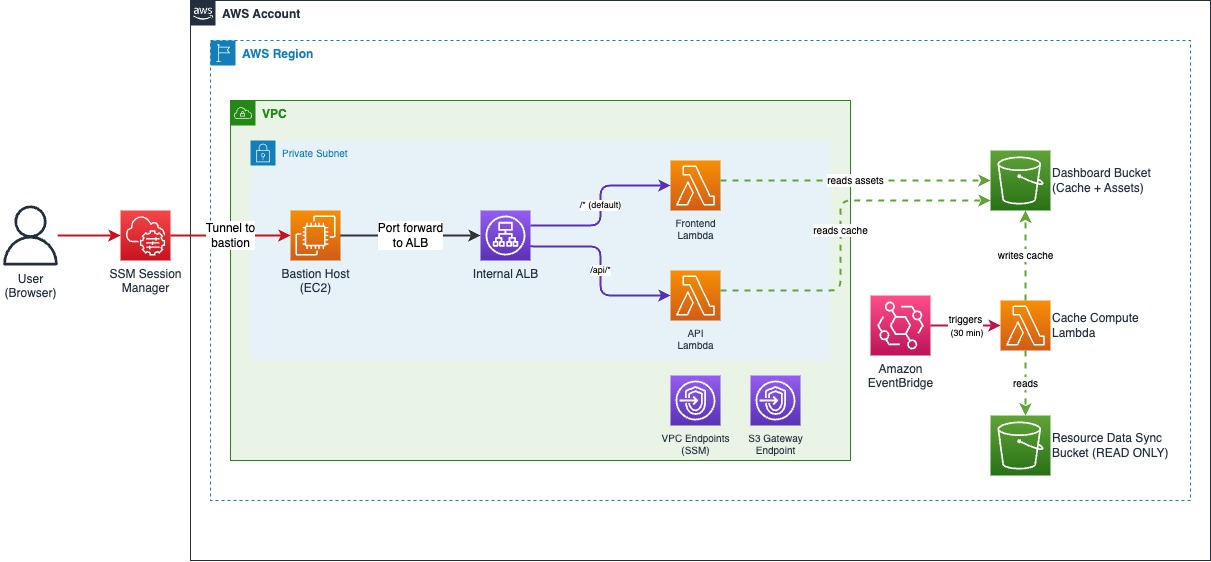
Here’s how the dashboard works:
- User initiates SSM port forwarding — The user runs an AWS Systems Manager Session Manager command to forward local port 8443 to the internal Application Load Balancer through a bastion host.
- Browser requests the frontend — The user opens https://localhost:8443/ in their browser. The request travels through the SSM tunnel to the bastion, then to the internal ALB.
- ALB routes to Frontend Lambda — The ALB’s default rule (/*) forwards the request to the Frontend AWS Lambda target group. The Frontend Lambda serves the React application, from the Dashboard Amazon S3 bucket. The frontend is built with Cloudscape Design System.
- React app loads and fetches data — Once the React application loads in the browser, it makes API calls to /api/compliance-summary for the main dashboard view.
- API Lambda reads from cache — The API Lambda reads pre-aggregated JSON files from the Dashboard Amazon S3 bucket’s /cache/ prefix reducing dashboard load time.
- User drills down — When the user clicks an account row, the frontend requests /api/compliance-detail?accountId=X®ion=Y. The API Lambda reads the corresponding detail cache file and returns instance-level data.
The cache files are refreshed every 30 minutes by a separate Cache Compute Lambda triggered by an Amazon EventBridge rule. This Lambda reads the raw compliance data from your Resource Data Sync bucket, aggregates it, and writes the results to the Dashboard bucket.
This architecture prioritizes security and compliance over simplicity. The internal ALB, VPC with private subnets, and SSM-based access pattern address specific enterprise requirements:
- Zero public attack surface — The ALB is internal-only, Lambda functions run in private subnets, and no public endpoints are exposed. Access requires valid AWS credentials and SSM permissions.
- Strict data separation — The solution creates its own private Amazon S3 bucket for cached data and frontend assets. The Resource Data Sync bucket is only read to create cache and is never used to serve the dashboard directly.
- Private-only access patterns — Organizations with strict security requirements mandate that internal tools remain inaccessible from the public internet. This dashboard meets those requirements by design.
- Encryption in transit and at rest — The ALB serves HTTPS only with TLS 1.3, S3 buckets use SSE-S3 by default (or customer-managed CMKs), and bucket policies deny any non-TLS request.
- Comprehensive logging — VPC Flow Logs, ALB access logs, and explicit Lambda CloudWatch Log Groups with 90-day retention.
Prerequisites:
Before starting, ensure you have:
- Kiro IDE installed and configured. Use this guide to install Kiro.
- AWS Account with AWS Systems Manager Patch Manager in use.
- Resource Data Sync bucket configured with Inventory & Patch Compliance data.
- AWS Command Line Interface (AWS CLI) configured with appropriate credentials.
- Python3.11 and Node.js 18+ for building the frontend.
- uvx for MCP servers.
- SSM Session Manager Plugin for accessing the dashboard.
What the Dashboard Displays
At the top level, teams need a quick answer to “how compliant are we?” — total instances, compliance rate, compliant vs non-compliant counts. Below that, breakdowns help identify patterns: compliance by platform (Linux vs Windows have different patching cycles), and missing patches by severity (critical patches need immediate attention, low-severity can wait).
A list of accounts table lets teams drill down to see which accounts need attention. Clicking an account shows instance-level detail — which instances are non-compliant, the count of patches missing, when they were last scanned. A missing patches list shows which specific patches are missing and the number of instances that need each one.
This shapes the dashboard into two levels:
- Main view: Overview cards, pie charts (compliance status, platform, severity), accounts table
- Detail view: Instance table, missing patches list, status filter
Setting Up a Steering File
Steering files are markdown documents in .kiro/steering/ that Kiro automatically includes in every conversation. They solve a recurring frustration with AI coding assistants — having to re-explain project conventions repeatedly.
For this dashboard, the core architecture decisions are: serverless compute with Lambda behind an internal ALB (no public endpoints), SSM Session Manager for secure access, a two-tiered caching strategy to avoid reading thousands of Amazon S3 files on every request, and strict separation between the source Resource DataSync bucket (read-only) and the Dashboard’s bucket (cache + assets). These decisions balance security, cost, and usability.
We capture these decisions across five steering files:
- architecture.md — Infrastructure decisions: internal ALB with Lambda targets, VPC with private subnets, SSM access via bastion, EventBridge for 30-minute cache refresh, Lambda memory and timeout settings.
- data-schemas.md — Data structure from Resource Data Sync, cache file formats for summary and detail views.
- compliance-logic.md — Business rules such as an instance is compliant exclusively when MissingCount=0 AND InstalledPendingRebootCount=0, terminated instances excluded from aggregations but visible with filter etc.
- frontend-specs.md — UI components, Cloudscape Design System usage, dashboard layout and user interactions.
- security.md — Baseline security controls applied during spec generation: HTTPS-only ALB, S3 baseline (PublicAccessBlock, encryption, versioning, TLS-only), least-privilege IAM, security response headers, input validation, and dependency pinning.
The complete steering files for this project are available in the GitHub repository. Browse the complete set in the GitHub repository to see how each file is written.
Add MCP servers for validation
Steering files tell Kiro what to build. MCP servers help verify what Kiro actually produces. We recommend configuring two public MCP servers from AWS before starting the spec:
An example mcp.json is available in the GitHub repository for reference. With these MCP servers active, Kiro can validate the design against AWS best practices and scan generated code as each implementation task completes.
Creating the Spec
Step 1: Create a New Spec
- Create a folder for the project.
- Download .kiro folder from the Github repository to the Project Folder. This consists of Steering files and MCP config as mentioned in the previous sections.
- Launch Kiro, select File, choose Open Folder, and open the folder you just created.
- Open the Specs panel in Kiro (click the Specs icon in the sidebar)
- Click “New Spec” (or use Command Palette → “Kiro: New Spec”)
- Name it, e.g. patch-compliance-dashboard.
- Kiro will ask if you are developing a Feature or fixing a Bug. Choose Feature and start with Requirements workflow.
Step 2: Describe What to Build
With the steering file providing technical context, the spec description can focus on features and architecture:
“Build a serverless multi-account patch compliance dashboard. The data source is Resource Data Sync which exports patch compliance data to Amazon S3. The dashboard displays compliance overview with pie charts and an accounts table, with drill-down to instance details and missing patches. Follow the architecture and UI specs in the steering files.”
If prompted for input, start with generating a requirement file. If Kiro presents options during Requirement Analysis, accept the defaults — the steering files already encode the decisions.
Step 3: Review Generated Requirements
Kiro analyzes the description and generates a requirements.md file in .kiro/specs/patch-compliance-dashboard/ with formal requirements and acceptance criteria.
Open the file and review it. Because the steering files contain detailed specs, Kiro incorporates the compliance logic, cache schemas, and UI layout automatically. Verify the requirements match your intended behavior and adjust if needed before moving to design.
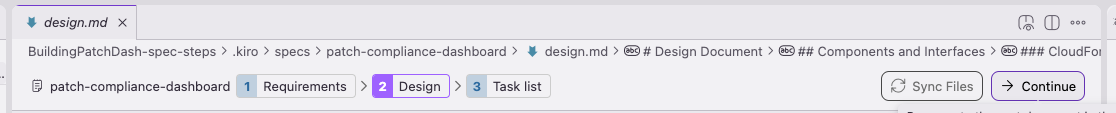
Design Phase
Tell Kiro to move to design.

It generates a design document, design.md with architecture diagram, component responsibilities, API contracts, and cache file schemas. Since the steering files already capture the architecture decisions, the design phase serves as a validation step. Review to confirm:
- Network architecture — Does the design avoid public endpoints? Check that access flows through your chosen secure access method (SSM) rather than exposing the dashboard directly to the internet.
- Data flow — Is there a clear separation between reading source data and serving the dashboard? The design must show how raw data gets transformed into cached aggregations, and how the frontend reads from cache rather than hitting the source directly.
- Compute boundaries — Are the responsibilities clearly separated? Look for distinct components handling: periodic data refresh, API requests, and static file serving. Each must have a single responsibility.
- Cache structure — Does the caching strategy match your steering file? Check that summary-level data (for sub-second dashboard loads) is separate from detailed per account level data. Verify the cache refresh interval matches your requirements.
- Storage separation — Are source data and dashboard assets in separate locations with appropriate access controls? The design must never write to the source data location.
If the design diverges from the steering files, clarify with Kiro before proceeding to tasks.
Implementation Phase
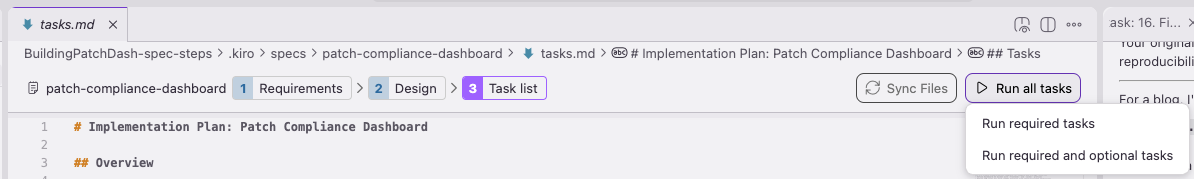
Generate Tasks
Click Continue or type “Create Task lists”. Kiro creates a checklist of implementation tasks organized by component.
What to look for:
- Logical order — Tasks must build on each other. E.g. Core compliance logic first, then Cache Lambda, then API Lambdas, then frontend.
- Checkpoint tasks — Look for tasks that pause to verify a component works before moving on.
- Requirement references — Each task references specific requirements for traceability.
- Tech stack alignment — Confirm tasks use Python 3.11 for Lambda, React + Cloudscape for frontend, and CloudFormation for infrastructure (as specified in the steering file). If something differs, clarify before running tasks.
Work Through Tasks
Run all the tasks. Kiro implements each based on the requirements and design documents — Cache Lambda, API Lambdas, Frontend Lambda, and the React components. If something fails, kiro automatically corrects it.
Deployment
After completing spec tasks, create a deployment script. Ask Kiro:
” Create a bash deployment script that handles both deploy and delete actions. For deploy, it takes stack-name, datasync-bucket-name, and region as arguments — it validates the DataSync bucket exists, builds the React frontend, packages the Lambda functions as zip files, deploys the bucket, infrastructure, and compute CloudFormation stacks in order, generates a self-signed TLS certificate and imports it into ACM for the internal ALB, looks up the AWS-managed S3 prefix list ID so the Lambda security group can reach S3 through the Gateway Endpoint, uploads frontend assets and Lambda zips to the Dashboard bucket, force-updates each Lambda function’s code so re-deploys pick up new code without waiting for a CloudFormation drift, and shows status at each step. After deployment completes, invoke the cache compute Lambda and wait for it to finish before showing the SSM access command. Display the access instructions after the cache is ready so the dashboard has data to display. For delete, it takes stack-name and region — it deletes the compute stack, then empties and deletes the retained ALB access log bucket (versions and delete markers), deletes the infrastructure stack, empties the Dashboard buckets including all object versions and delete markers (the buckets are versioned), deletes the bucket stack, and removes the self-signed ACM certificate. Follow architecture.md steering file for the stack layout, TLS helper pattern, and bucket naming conventions.”
The result is a single command, like below:
The Result
The dashboard provides:
-
- Overview cards with total instances, compliance rate, compliant and non-compliant counts
-
- Pie charts showing compliance status, platform breakdown, and missing patches by severity
-
- Accounts table with drill-down to instance details
-
- Instance-level view with missing patches
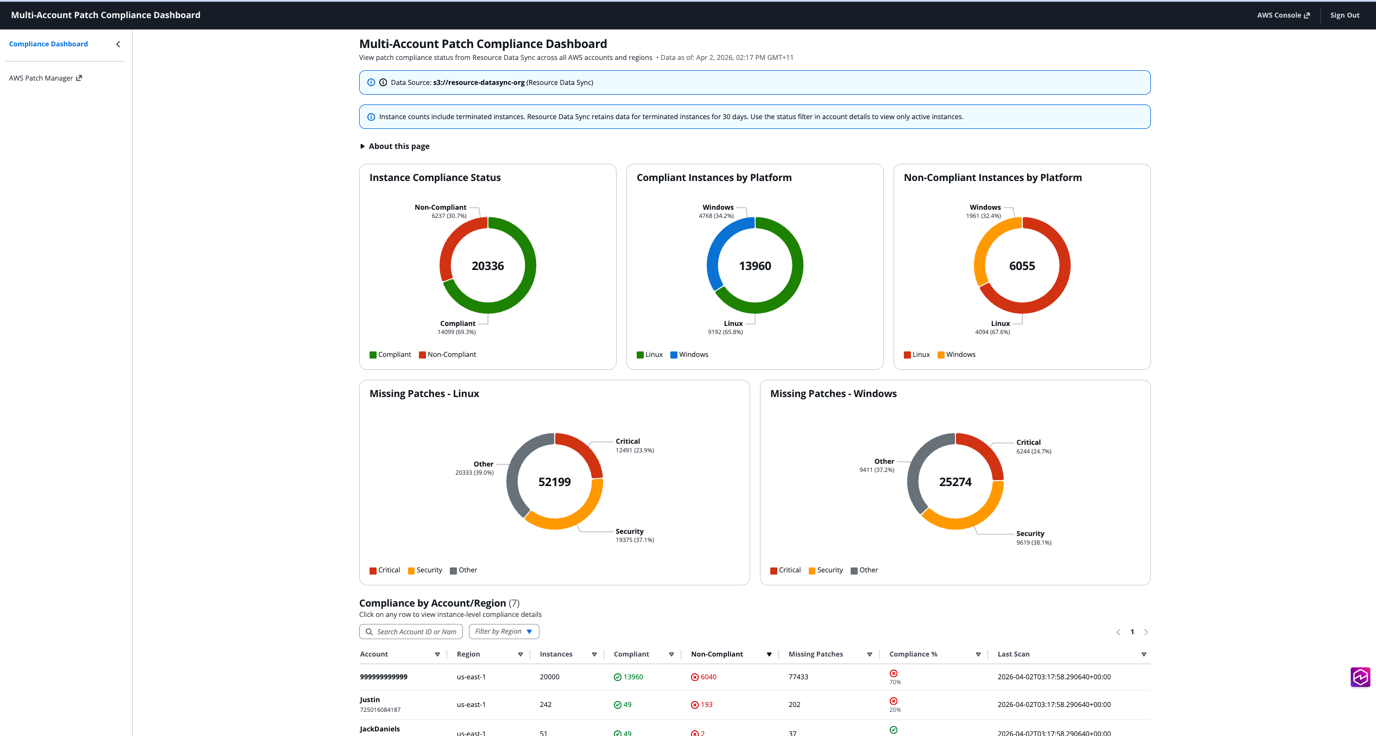
Your dashboard may not look exactly like this. The spec-driven workflow produces a working foundation, but the final product depends on the steering files, the refinements you make during each phase, and the follow-up conversations with Kiro. Treat the generated code as a starting point, then iterate until it matches what you need.
Beyond the Generated Tasks
The generated implementation gets you 90% of the way there. When issues arise, paste the logs or error message to Kiro and it can diagnose and fix the problem. The spec provides the blueprint; the conversation refines it into a ready solution. Ideas for extending the dashboard:
-
- Add Amazon Cognito authentication for multi-user access
-
- Implement server-side pagination for accounts with 10,000+ instances
-
- Create custom widgets for your specific compliance metrics
-
- Creating pie charts for compliance monitoring for teams, applications etc.
-
- Integrate with Amazon SNS for compliance alerts.
-
- Integrate with Amazon Inspector to get CVE details for the patches.
Cleanup
To avoid ongoing charges, delete the resources created by this solution:
This removes all CloudFormation stacks, empties and deletes all S3 buckets (including versioned objects and ALB access logs), removes the VPC, ALB, Lambda functions, bastion instance, and the self-signed ACM certificate.
Conclusion
You’ve seen how Kiro’s spec-driven development turns architecture decisions into a working dashboard — from steering files through requirements, design, and implementation.
The complete project — including steering files, spec documents, and all source code — is available in the GitHub repository. Clone the repo to explore the architecture, experiment with the deploy script, and see how spec-driven development translates into a working solution. The steering files are there if you want to extend or adapt the patterns for your own environment.
For details on Kiro’s spec-driven workflow, see the Kiro documentation. To explore AWS Systems Manager Patch Manager, visit the documentation.