AWS Cloud Operations Blog
How to monitor AWS WAF logging centrally using Amazon Managed Grafana
It is important for cloud security operations teams to maintain a high level of cloud security and detect and respond to malicious web activity in near real-time. AWS WAF helps protect web applications from common web exploits that could affect application availability, compromise security, or consume excessive resources. However, as your cloud environment scales with your business needs, analysis and monitoring of the logs across multiple AWS Accounts and Regions can become a challenge in the absence of a centralized visualization platform.
In this blog post, you will learn how to configure logging on your AWS WAF web ACLs centrally using an AWS Firewall Manager policy and monitoring AWS WAF logs in near real-time through Amazon Managed Grafana. Additionally, you can create dashboards in Amazon Managed Grafana to help you visualize AWS WAF logs which is useful for threat intelligence, hardening rules, troubleshooting false positives, and responding to an incident.
Architecture Overview
The following architecture diagram illustrates the use of AWS services in the solution:
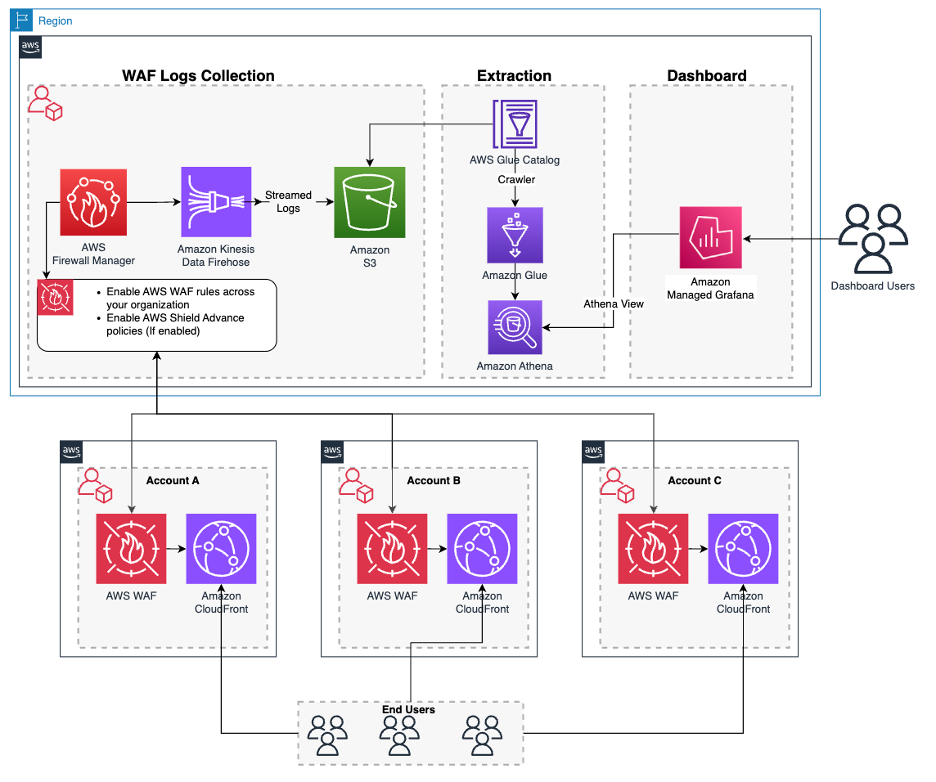
Figure 1: Architecture Overview
In the solution, you are using Firewall Manager to retrieve AWS WAF logs from all accounts to a centralized account. With this feature, you can log all traffic inspected by AWS WAF into Amazon Simple Storage Service (Amazon S3) buckets by configuring Amazon Kinesis Data Firehose for your WAF policy created in AWS Firewall Manager. You will then set up an AWS Glue crawler job, an Amazon Athena table and an Amazon Athena view to build a Managed Grafana dashboard to visualize the events in near real time.
Prerequisites:
- Setting up Amazon Athena workgroups with Amazon Grafana pre-requisites.
- Verify that your IAM user/role has permissions to access AWS Firewall Manager. Refer to Access to AWS Firewall Manager resource.
- In order to use AWS Firewall Manager, complete the AWS Firewall Manager prerequisites.
- Create an AWS Firewall Manager default administrator account.
- Create and apply WAF policy if not already created in your Firewall Manager administrator account.
- Amazon Managed Grafana workspace. Refer to Amazon Managed Grafana – Getting Started for information on configuration and setup. For information and steps on creating the Amazon Managed Grafana workspace, refer Creating a workspace.
-
- Amazon Managed Grafana lets you to configure user access through AWS IAM Identity Center or other SAML based Identity Providers (IdP). Review Amazon Managed Grafana supports direct SAML integration with identity providers
- In this post, you will be using the AWS IAM Identity Center option. To set up Authentication and Authorization, follow the instructions in the Amazon Managed Grafana User Guide to enable AWS IAM Identity Center.
- To use AWS data source configuration, first use the Amazon Managed Grafana console to enable service-managed AWS Identity and Access Management (IAM) roles that grants the workspace with AWS IAM policies necessary to access resources in your AWS Account/Organization. Then, use the Amazon Managed Grafana workspace console to add Amazon Athena data source.
Walk-through:
Step 1: Launch the AWS CloudFormation template
Launch the following AWS CloudFormation template to deploy Glue Crawler, Glue Database and its related components.
Note: Some of the resources that this stack deploys incur costs when in use.
To create your resources using AWS CloudFormation template, complete the following steps:
- Sign in to the AWS Management Console.
- Navigate to the AWS CloudFormation console > Create Stack > “With new resources”.
- Specify a “Stack name” and choose Next.
- Leave the “Configure stack options” at default values and choose Next.
- Review the details on the final screen and under “Capabilities” check the box for “I acknowledge that AWS CloudFormation might create IAM resources with custom names”.
- Choose Submit.

Figure 2: Acknowledgement
Note: You can review the progress of your new stack under AWS CloudFormation > Stacks > [StackName] > Events tab
Once the Stack is created successfully, the following resources will be deployed:
Amazon S3 Bucket, AWS Glue Crawler, AWS Glue Database, Amazon Kinesis Data Stream and Amazon Athena Query (under ‘“Saved Queries” tab to create the view in Athena) and the corresponding AWS IAM Roles and Policies are created successfully. Further, go to outputs Tab and copy KinesisDeliveryStreamName.
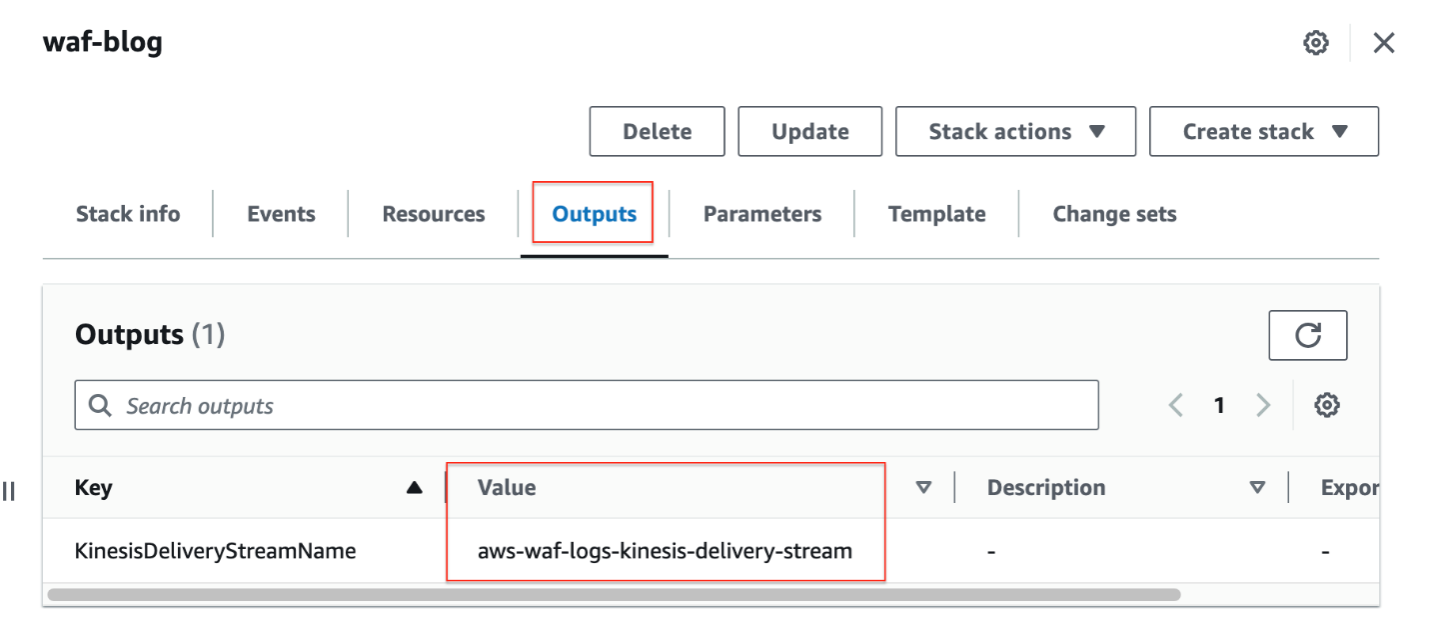
Figure 3: AWS CloudFormation Outputs
Step 2: Configure centralized logging for AWS WAF policy
- Sign in to the AWS Management Console using your Firewall Manager administrator account, and then open the Firewall Manager console.
- In the navigation pane, choose Security Policies and choose your AWS WAF policy.
- On the Policy details tab, in the Policy rules section, choose Edit.
- For Logging configuration status, Select “Enable Logging”.
- Choose the Kinesis Data Firehose stream created through CloudFormation in Step 1 with name “aws-waf-logs-kinesis-delivery-stream” for logging configuration.
- Choose Next, review your settings and Save changes to the policy.
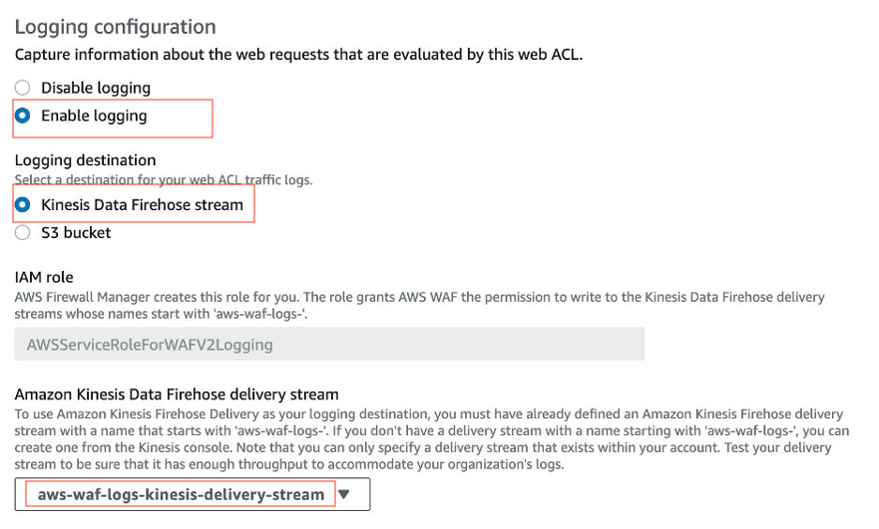
Figure 4: AWS WAF Centralized Logging
The web ACLs publish their log files to the Amazon S3 bucket at 5-minute intervals. Each log file contains log records for the traffic recorded in the previous 5 minutes. However, for the purpose of this blogpost, we have configured AWS Glue Crawler schedule as 1 hour. You can make changes and adjust as per your requirements.
Once the Log file is generated and stored in S3, AWS Glue Crawler will run and get the data from S3 in Amazon Glue Database and Tables.
Step 3: Create a View in Amazon Athena using the saved queries created as part of the AWS CloudFormation stack
1. Go to Amazon Athena > Query editor > Saved queries tab and choose the query named “aws_waf_centralized_logging”.
Note: Workgroup created is named “waf-logs-athena”

Figure 5: Amazon Athena Saved Queries
2. On the Query editor, verify the Data source, Database and Table names while running the query. Upon successful execution, the query creates a View named “waflogs”.
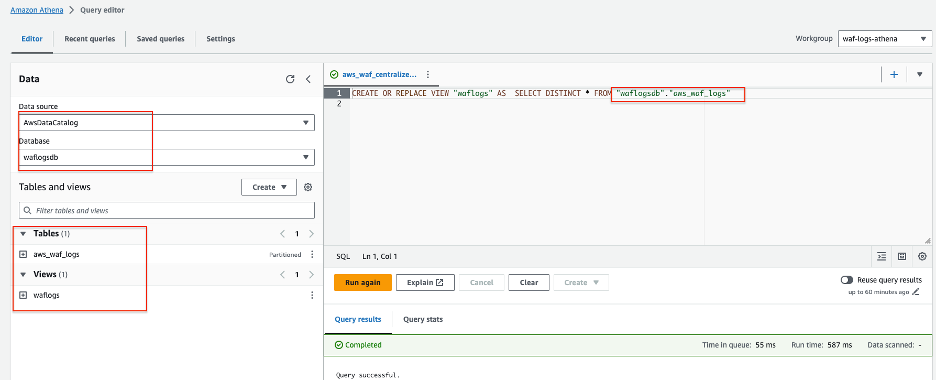
Figure 6: Amazon Athena Query Editor
Step 4: Configure Amazon Athena Data Source in Amazon Managed Grafana
- Launch the Amazon Managed Grafana console using the Managed Grafana workspace URL and login using the user credentials you configured.
- Under Administration > Data sources > choose Amazon Athena.
- Configure the Amazon Athena settings by choosing Default Region (us-east-1), Data source (AWSDataCatalog), Database (waflogsdb), Workgroup (waf-logs-athena) and the Output Location of your Athena query.
- Choose Save & test to verify that the data source is working. Start querying and visualizing the metrics from the AWS environment.
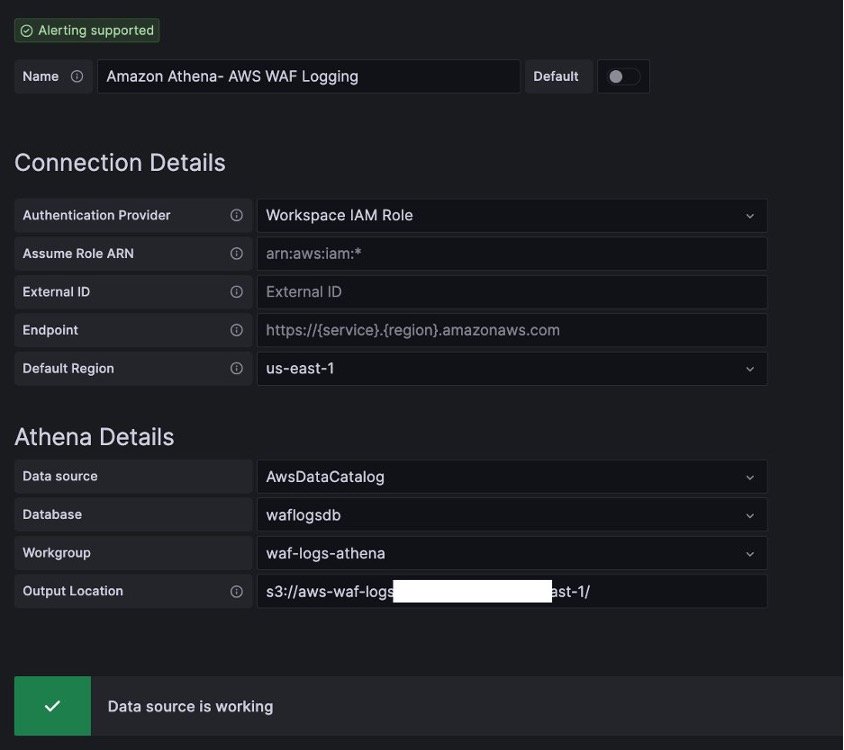
Figure 7: Amazon Athena as Data source
Step 5: Create an Amazon Managed Grafana dashboard
You can use Amazon Managed Grafana to create a near real-time AWS WAF Logging dashboard. Amazon Managed Grafana is a fully managed service that makes it easy to create, configure, and share interactive dashboards and charts for monitoring your data. You can use Amazon Grafana to set up alerts and notifications based on specific conditions or thresholds, allowing you to quickly identify and respond to issues.
Now that you have completed all the previous steps successfully, we will create Amazon Managed Grafana dashboard by following the steps:
- Download the AWS WAF Logging dashboard JSON file from this link.
- To import a dashboard, choose the “+” or go to the Dashboards tab on the Amazon Managed Grafana console and choose Import.
- Copy and paste the contents of the JSON file into the Import via panel JSON textbox and choose Load.
Note: You can either upload a dashboard JSON file, paste a dashboard URL or paste dashboard JSON text directly into the text area and choose Load
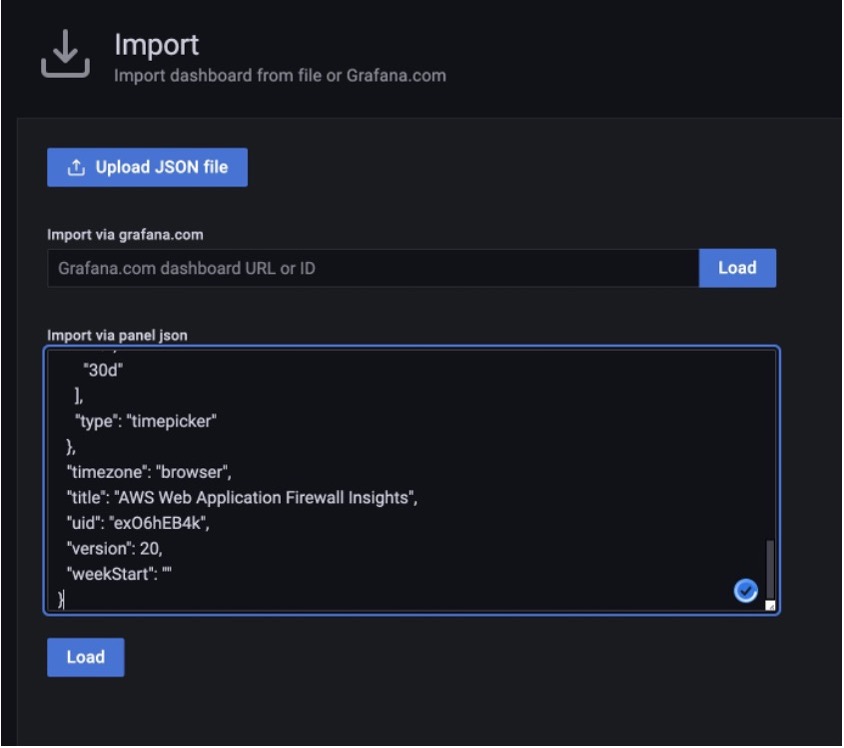
Figure 8: Load the JSON code
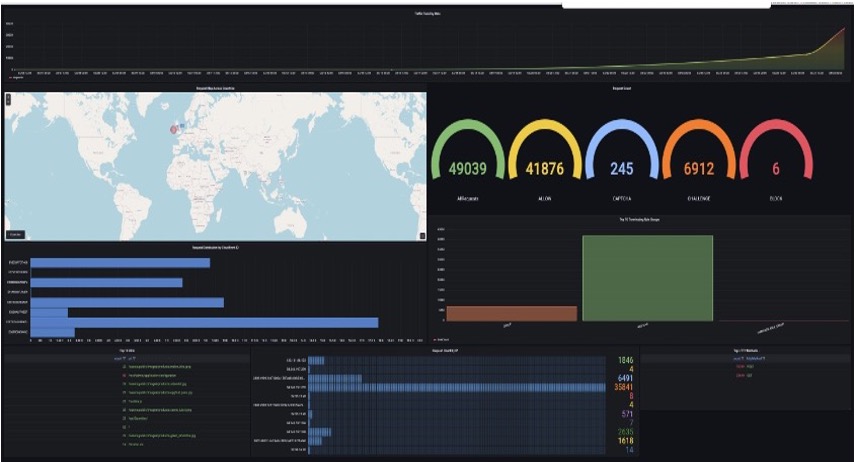
Figure 9: Grafana Dashboard
Now that you have the AWS WAF Insights on Amazon Managed Grafana, this dashboard refreshes every 5 seconds and runs a query against the materialized views that you previously created in Amazon Athena. You can visualize and troubleshoot false positives, respond to a security incident empowering you to take timely actions and minimize the impact.
Finally, Grafana alerting provides us with robust and actionable alerts that help us learn about problems in the system moments after they occur. To learn more about Grafana alerting visit Alerts in Grafana.
Clean up
To avoid incurring future charges, delete all resources used in this post.
- Empty S3 bucket before deleting the AWS CloudFormation stack.
- Delete AWS CloudFormation Stack
- Delete Amazon Managed Grafana Workspace
- Delete Amazon Athena workgroup
Conclusion
In this blog post, you learnt how to configure logging your AWS WAF web ACLs centrally using an AWS Firewall Manager policy and monitoring AWS WAF logs in near real-time through Amazon managed Grafana. This visualization will help you with threat intelligence, hardening rules, troubleshooting false positives, and faster incident response.
To learn more and get hands-on experience on AWS observability services, check the One Observability Workshop.