AWS Cloud Operations Blog
Turn Your Amazon CloudWatch Alarms into Actionable Signals
Your alarm fires at 2 AM. You grab your phone, squint at the notification, and see: “ALARM: my-service-alarm has transitioned to ALARM state.” No context. No application. No hint about which of your 200 instances is the problem, or whether it even matters.
I’ve been there. We’ve all been there.
Alarm frustration often comes from the gap between “something is wrong” and “I know what to do about it”. When all you get is a metric name and a threshold, you’re left filling in the context yourself: which resource, which application, how critical is this service?
Amazon CloudWatch alarms are often the first line of defense for detecting problems in your AWS environment. In this blog post we show you how to design CloudWatch alarms that close that gap: alarms that watch the right things, carry the context you need, and trigger the right response.
- Right Data – scope your alarm to watch the resources and metrics that matter, adapt automatically as your environment changes, and set thresholds that reflect real problems.
- Right Context – include the information you need in your notifications: what’s affected, where, and how to act.
- Right Actions – go beyond “send an email” to automated remediation, enriched notifications, and orchestrated incident response.
Prerequisites
To follow along with this post, you need
- An AWS Account with access to Amazon CloudWatch
- Existing AWS resources to monitor (such as Amazon EC2 instances, AWS Lambda functions, or Application Load Balancers)
- Permissions to create and manage CloudWatch alarms, metrics, and dashboards
- (Optional) Resource tags applied to your AWS resources for tag-based filtering
Note: CloudWatch alarms, dashboards, and EventBridge will incur AWS charges. See Amazon CloudWatch Pricing for details. Remember to delete these resources when you are finished to avoid ongoing charges.
Right Data: Scope Your Alarms to What Matters
Consider this: you create a CloudWatch alarm on the CPUUtilization metric for a specific Amazon EC2 instance. It works great, until your Amazon EC2 Auto Scaling group launches three new instances. Those new instances have no alarm coverage. You’re flying blind on 75% of your fleet.
Or, because you have dynamic resources, you create an alarm on the average Latency metric across all your Application Load Balancer targets. The average looks fine, but one target is returning 5-second responses while the others are at 50 ms. The average masks the problem.
Single-metric and single-aggregate alarms are straightforward to create and manage, but single-metric alarms leave gaps in dynamic environments, and single-aggregate alarms mask problems behind averages.
Handling dynamic resources
CloudWatch Metrics Insights lets you write SQL-like queries that dynamically discover and aggregate metrics across your resources. Instead of creating one alarm per instance, you create a single alarm across multiple resources with a query that automatically adapts as your environment changes:
SELECT AVG(CPUUtilization)
FROM SCHEMA("AWS/EC2", InstanceId)
This Metrics Insights query automatically covers all Amazon EC2 instances, no manual updates required. If your EC2 Auto Scaling group scales from 3 to 30 instances, the alarm adapts. And instead of creating and managing 30 individual alarms, you only manage one alarm.
Or for a serverless workload, you might create a Metrics Insights query on duration across your AWS Lambda functions:
SELECT AVG(Duration)
FROM SCHEMA("AWS/Lambda", FunctionName)
The concept is the same. This query covers any Lambda function, whether you have 3 Lambda functions or 30.
While the examples in this blog post use Metrics Insights, you can also query your metrics using PromQL and include labels in your query to achieve the same effect.
Targeting the right resources
So now your alarm adapts to dynamic resources, but you probably want to target specific applications or environments. Raw dimension values like InstanceId don’t tell you much about what a resource does or how critical it is.
For custom metrics, you control the dimensions yourself. Include context like Application and Environment, and query against them directly:
SELECT AVG(ProcessingTime)
FROM SCHEMA("Custom/PaymentService", Application, Environment)
WHERE Application = 'PaymentService'
  AND Environment = 'Production'
AWS services like Amazon EC2 and Lambda automatically publish vended metrics with predefined dimensions (for example: InstanceId, FunctionName). You cannot add your own additional dimensions. Instead you add your business context with resource tags for telemetry.
When you enable resource tags on telemetry, CloudWatch exposes your existing resource tags as dimensions in Metrics Insights. Tags already applied to a resource (for example, Environment=Production or Application=PaymentService on an Amazon EC2 instance) become available for use in WHERE and GROUP BY clauses.
SELECT AVG(CPUUtilization)
FROM SCHEMA("AWS/EC2", InstanceId)
WHERE tag.Environment = 'Production'
  AND tag.Application = 'PaymentService'
Now the alarm specifically watches production instances belonging to the PaymentService application. When a new instance launches with those tags, it’s automatically included in the alarm. You never have a blind spot, and you never alarm on your development environment at 2 AM.
One alarm, multiple resources
Your alarm now adapts dynamically and targets the right resources. But remember the other issue, the average masking the problem? That’s where GROUP BY comes in. Add GROUP BY to your query and you can create a multi-time-series alarm. CloudWatch evaluates the threshold independently against each series in the query result. If any series breaches the threshold, the alarm fires, even if the fleet average looks healthy.
SELECT AVG(CPUUtilization)
FROM SCHEMA("AWS/EC2", InstanceId)
WHERE tag.Environment = 'Production'
  AND tag.Application = 'PaymentService'
GROUP BY InstanceId
With GROUP BY, the graph shows multiple series, one per matching EC2 instance. Without it, you’d see a single aggregated line. To verify your query for your alarm, check the graph in the “Specify metric and conditions” step to confirm you’re evaluating multiple series, not one aggregate. Note the “Order By” options beneath the query, which are required for multi-series alarms.
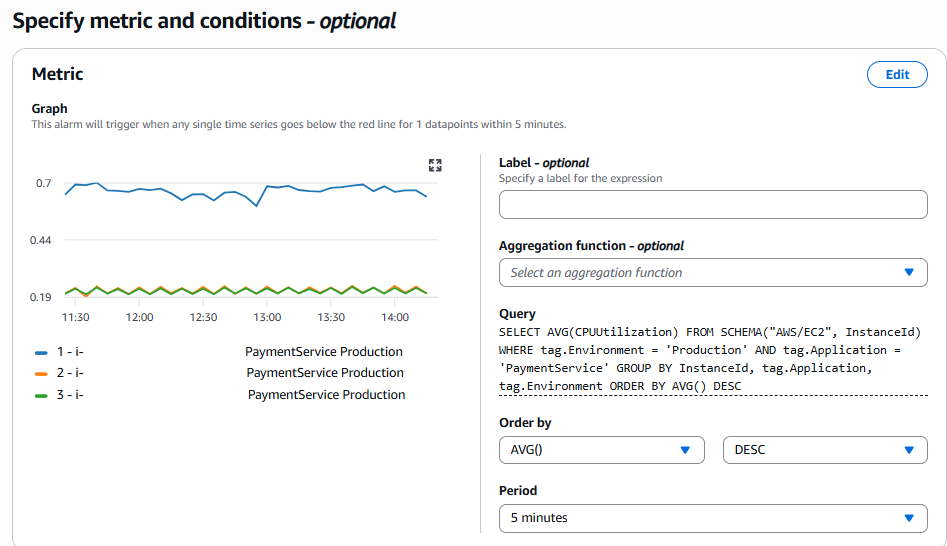
Figure 1: Alarm creation showing a Metrics Insights query returning multiple metric series.
You are now watching the right resources and evaluating each one independently. But what value should invoke the alarm?
Choose the right threshold
The threshold is the final piece of Right Data. It’s the difference between an alarm that catches real problems and one that fires too often or stays silent while customers are affected.
Alarms with static thresholds work well for metrics with hard limits, i.e. disk utilization approaching 100%, a queue depth growing unbounded, or error counts that should always be zero. If you know the “bad” value, set it and forget it.
But many metrics have natural variance. CPU utilization at 70% might be normal during peak hours, but the same 70% would be concerning at 2 AM. Latency that’s healthy at 200 ms on Monday could be abnormally high on a quiet Sunday. For these, a static threshold forces you to choose between too sensitive (alert fatigue) and too lenient (missed incidents).
Anomaly detection alarms solve this. CloudWatch learns your metric’s baseline pattern, its daily and weekly trends and expected range, and alarms when the metric deviates from that learned profile. You don’t set a number; you set a sensitivity. This is ideal for “I don’t know what the threshold should be” scenarios, or metrics where “normal” changes over time. For more information on how anomaly detection works see Using CloudWatch anomaly detection.
Right Context: Make Notifications Actionable
Remember that gap between “something is wrong” and “I know what to do”? Context closes it. The more your notification tells you, the faster you respond; and with enough context, you can automate the response entirely.
Regardless of alarm type, the notification always includes your alarm name and description, the state change, the reason for the change, and threshold. Of these, the name and description are two things you fully control, and they’re the first things your responder sees. A well-written name and description can carry a lot of context. The alarm name gives a quick signal: production, payments, CPU. Use the description to provide links to documentation, a runbook, a dashboard, and an escalation path.
Alarm Details:
- Name:          prod-payments-cpu
- Description:   Alarm on payments service CPU.
                 Impact: Payment processing may slow.
                 Runbook: https://wiki.example.com/runbooks/payment-cpu
                 Dashboard: https://console.aws.amazon.com/cloudwatch/...
                 Escalation: #payments-oncall
- State Change:  OK -> ALARM
- Reason for State Change:    Threshold Crossed: 1 out of the last 1 datapoints [3.0705 (15/06/26 12:49:00)] was more than the threshold (90.0) (minimum 1 datapoint for OK -> ALARM transition).
- Timestamp:     Monday 15 June, 2026 12:54:30 UTC
- AWS Account:   xxxxxxxxxxxx
- Alarm Arn:     arn:aws:cloudwatch:us-east-xxxxxxxxxxxx:alarm:prod-payments-cpu
Dashboards: Showing the shape of the problem
An alarm fires at a single point in time. You know the value, but not how quickly it is changing or the broader impact. A dashboard can show the bigger picture: the metric behavior over time (is it a spike or a gradual degradation? When did it start to change?), along with an opinionated view of what’s relevant when that alarm fires, the application’s RED metrics (Requests, Errors, Duration) and related resources. Include the dashboard URL in your alarm description so the responder can easily access it.
Getting context from your metric query
The name and description are context you add yourself, and notification events from all alarm types contain the alarm details. But the alarm notification also carries context automatically, and what it includes depends on how you build the alarm.
- Single-metric alarm: metric namespace, name, dimensions, statistic and metric value.
- Multi-time-series alarm (Metrics Insights with GROUP BY): Metrics Insights query, and Contributor Attributes identifying which series breached.
A single-metric alarm notification tells you what metric breached the threshold:
Monitored Metric:
- MetricNamespace:    AWS/EC2
- MetricName:         CPUUtilization
- Dimensions:         [InstanceId = i-xxxxxxxxxxxxxxxxx]
- Statistic:          Average
For example, an alarm on Amazon EC2 CPUUtilization shows the InstanceId dimension; an alarm on Lambda Duration shows FunctionName. What you see here depends on the metric and dimensions you selected when creating the alarm.
With an alarm created on a Metrics Insights query, the only way to get information on the specific instance is to use a GROUP BY clause in the query. The notification includes a Contributor Attributes section showing exactly which series from your query breached the threshold:
Contributor Attributes:
- InstanceId            i-xxxxxxxxxxxxxxxxx
- tag."Environment"     Production
- tag."Application"     PaymentService
Threshold:
- The alarm is in the ALARM state when the metric is GreaterThanThreshold 90.0 for at least 1 of the last 1 period(s) of 300 seconds.
Monitored Metrics:
- MetricExpression:  SELECT AVG(CPUUtilization) FROM SCHEMA("AWS/EC2", InstanceId) GROUP BY InstanceId, tag.Environment, tag.Application ORDER BY AVG() DESC
Because we included InstanceId, tag.Environment, and tag.Application in the GROUP BY, the Contributor Attributes shows all three values. This is the difference between “an instance is hot” and “the payments app in production has a problem.”
Composite alarms for impact-level signals
Individual alarms tell you about individual symptoms. Composite alarms summarize multiple symptoms into a single health signal.
A composite alarm combines the state of multiple child alarms using Boolean logic. For example a composite alarm that fires only when both the error rate AND latency alarms are in ALARM state gives your engineer an impact-level signal ( “the service is degraded” ) rather than two separate alarms.
Composite alarms also reduce noise. If you have 10 child alarms and only want to page when 3 or more are firing simultaneously, a composite alarm handles that logic for you.
Right Actions: From Notification to Resolution
Your alarm fires. You’ve scoped it to the right resources (Right Data) and the notification tells you what’s affected (Right Context). Because you have that context (the application, the environment, the specific resource) you can do more than notify. You can automate.
Many times the alarm action is “someone gets an email.” But here’s the question worth asking: when this alarm fires, what should actually happen?
Automate the actions
Some alarms need a human to investigate, decide, and coordinate. For these, use the GROUP By, tags, and dimensions, to make sure the notification carries enough context for quick action.
But where the response is deterministic (i.e. restart the task, scale the fleet, recover the impaired instance) wire the alarm directly to that action. CloudWatch can invoke Amazon EC2 actions (stop, reboot, recover), invoke Amazon EC2 Auto Scaling policies, or invoke a Lambda function. No human in the loop. The AWS Well-Architected Framework calls this out explicitly: if a human follows the same runbook the same way every time, that’s a candidate for automation.
Orchestrate complex responses
CloudWatch sends events to Amazon EventBridge when an alarm changes state, and with EventBridge you can send these events to multiple targets. When an alarm fires, you can simultaneously:
- Page the on-call engineer via PagerDuty
- Create an incident in your ticketing software
- Post to a dedicated Slack channel with enriched context
A single alarm event kicks off a coordinated response across your entire incident management workflow.
Suppress actions during planned maintenance
When you’re deploying a new version, running a load test, or rotating infrastructure, you don’t want alarms invoking auto-remediation or paging engineers for expected behavior.
CloudWatch alarm mute rules let you temporarily suppress alarm actions during predefined time windows. Unlike disabling alarm actions (which requires someone to remember to re-enable the alarm again), mute rules are for a specific time window. The alarm continues to evaluate and change state but does not invoke actions during the mute window. Mute rules can be scoped to specific alarms. You mute the alarms for the service you’re deploying, while the rest of your monitoring stays fully active.
Without mute rules, deployments generate unnecessary alarm noise: alarms fire for expected behavior, responders learn to dismiss them, and trust in the alarm system erodes.
A practical pattern: set up your CI/CD pipeline to create a mute rule before deploying, with an expiry window covering deployment and stabilization time. If the alarm fires after the window expires, you know it’s a real problem, not deployment noise.
Putting It All Together
Back to that 2 AM alarm. Here’s what it looks like when you put Right Data, Right Context, and Right Actions together:
- The alarm uses a Metrics Insights query with GROUP BY and filtered on resource tags, so it automatically covers your full fleet and scopes to the right environment and application.
- The notification carries the specific instance, the environment, and the application name, plus an alarm description that explains the impact and links to a runbook and a dashboard showing RED metrics.
- The alarm action invokes automated recovery for known issues. If recovery fails, or cannot be automated, it escalates to your incident management process with enriched context.
The alarm fires at 2 AM. The instance is auto-recovered. The alarm returns to OK. Nobody gets paged.
Conclusion
CloudWatch alarms are most effective when they watch the right resources, carry the context you need, and trigger appropriate responses. By using Metrics Insights queries with GROUP BY, enriching notifications with tags and descriptions, and automating responses where possible, you transform alarms from noise into actionable signals.
Ready to get started?
Here’s a practical starting path:
- Enable resource tags on telemetry in your CloudWatch Settings for your key services.
- Review AWS recommended alarms for your existing resources.
- Convert your highest-value static alarms to Metrics Insights queries with GROUP BY and tag-based scoping.
- Add anomaly detection for metrics with no clear static threshold.
- Write meaningful alarm descriptions with useful links.
- Create dashboards for your critical services and link them in your alarm descriptions.
- Set up alarm mute rules for deployment windows and planned maintenance.
- Create composite alarms for your critical services: surface impact-level signals, not individual symptoms.
- Implement automated actions for known resolutions: save human attention for problems that need human judgment.
You don’t have to do it all at once. Start with one service, get the pattern right, and expand from there. Your 2 AM self will thank you.
Clean Up
CloudWatch alarms, dashboards, and EventBridge rules will incur AWS charges. See Amazon CloudWatch Pricing for details. Remember to delete these resources when you are finished to avoid ongoing charges.