Networking & Content Delivery
Automated network incident response with AWS DevOps Agent
Your on-call engineer gets paged at 2 AM. A payment service in Workload Account cannot reach a shared database in Shared Services Account. The Amazon CloudWatch alarm fired eight minutes ago. The engineer starts by checking route tables across two accounts, Amazon Virtual Private Cloud (Amazon VPC) attachment states, security group rules on both sides, network ACLs, and DNS resolution logs. An hour later, the root cause turns out to be a AWS Transit Gateway route table association that was swapped to the wrong route table during a network migration earlier that evening, quietly dropping all traffic between the two VPCs while every other spoke kept working fine.
AWS DevOps Agent solves this problem by automating the entire investigation process. When a CloudWatch alarm fires, DevOps Agent receives the alert through a webhook, then correlates metrics, logs, network flow data, and API change history. DevOps Agent then provides a root cause analysis with a ready-to-run fix, reducing that hour of manual correlation to minutes of automated analysis.
This post demonstrates how to integrate CloudWatch monitoring with DevOps Agent to enable automated incident response for network failures. We walk through four common scenarios: security group misconfigurations, NAT Gateway routing issues, VPC endpoint policy restrictions, and Interface Endpoint subnet problems. We provide a CloudFormation template you can deploy in your own account to follow along, with each scenario showing how DevOps Agent automatically investigates and generates remediation plans with human oversight. We then show a complex multi-account scenario where a Transit Gateway route table misconfiguration blocks traffic between VPCs across accounts, demonstrating how DevOps Agent scales to enterprise environments. The full stack of the simulated workload application is available on aws-samples GitHub repo.
The simulated workload
To demonstrate DevOps Agent’s automated incident response capabilities, we use a simulated workload: a Node.js service running on Amazon Elastic Compute Cloud (Amazon EC2) behind an Application Load Balancer (ALB). This application performs health checks on a loop and displays results on a status dashboard. For the sake of simplicity and illustration, the application checks connectivity to four types of resources:
- Database connectivity to an Amazon RDS instance (every 5 seconds).
- Outbound internet reachability through a NAT Gateway (every 15 seconds).
- Amazon Simple Storage Service (Amazon S3) bucket access through a VPC Gateway Endpoint (every 10 seconds).
- Amazon Bedrock access through an interface VPC Endpoint (every 60 seconds).
When a check fails, the application publishes a custom Amazon CloudWatch metric that triggers an alarm. The whole stack deploys from a single AWS CloudFormation template. Figure 1 shows the architecture diagram of the simulated workload.
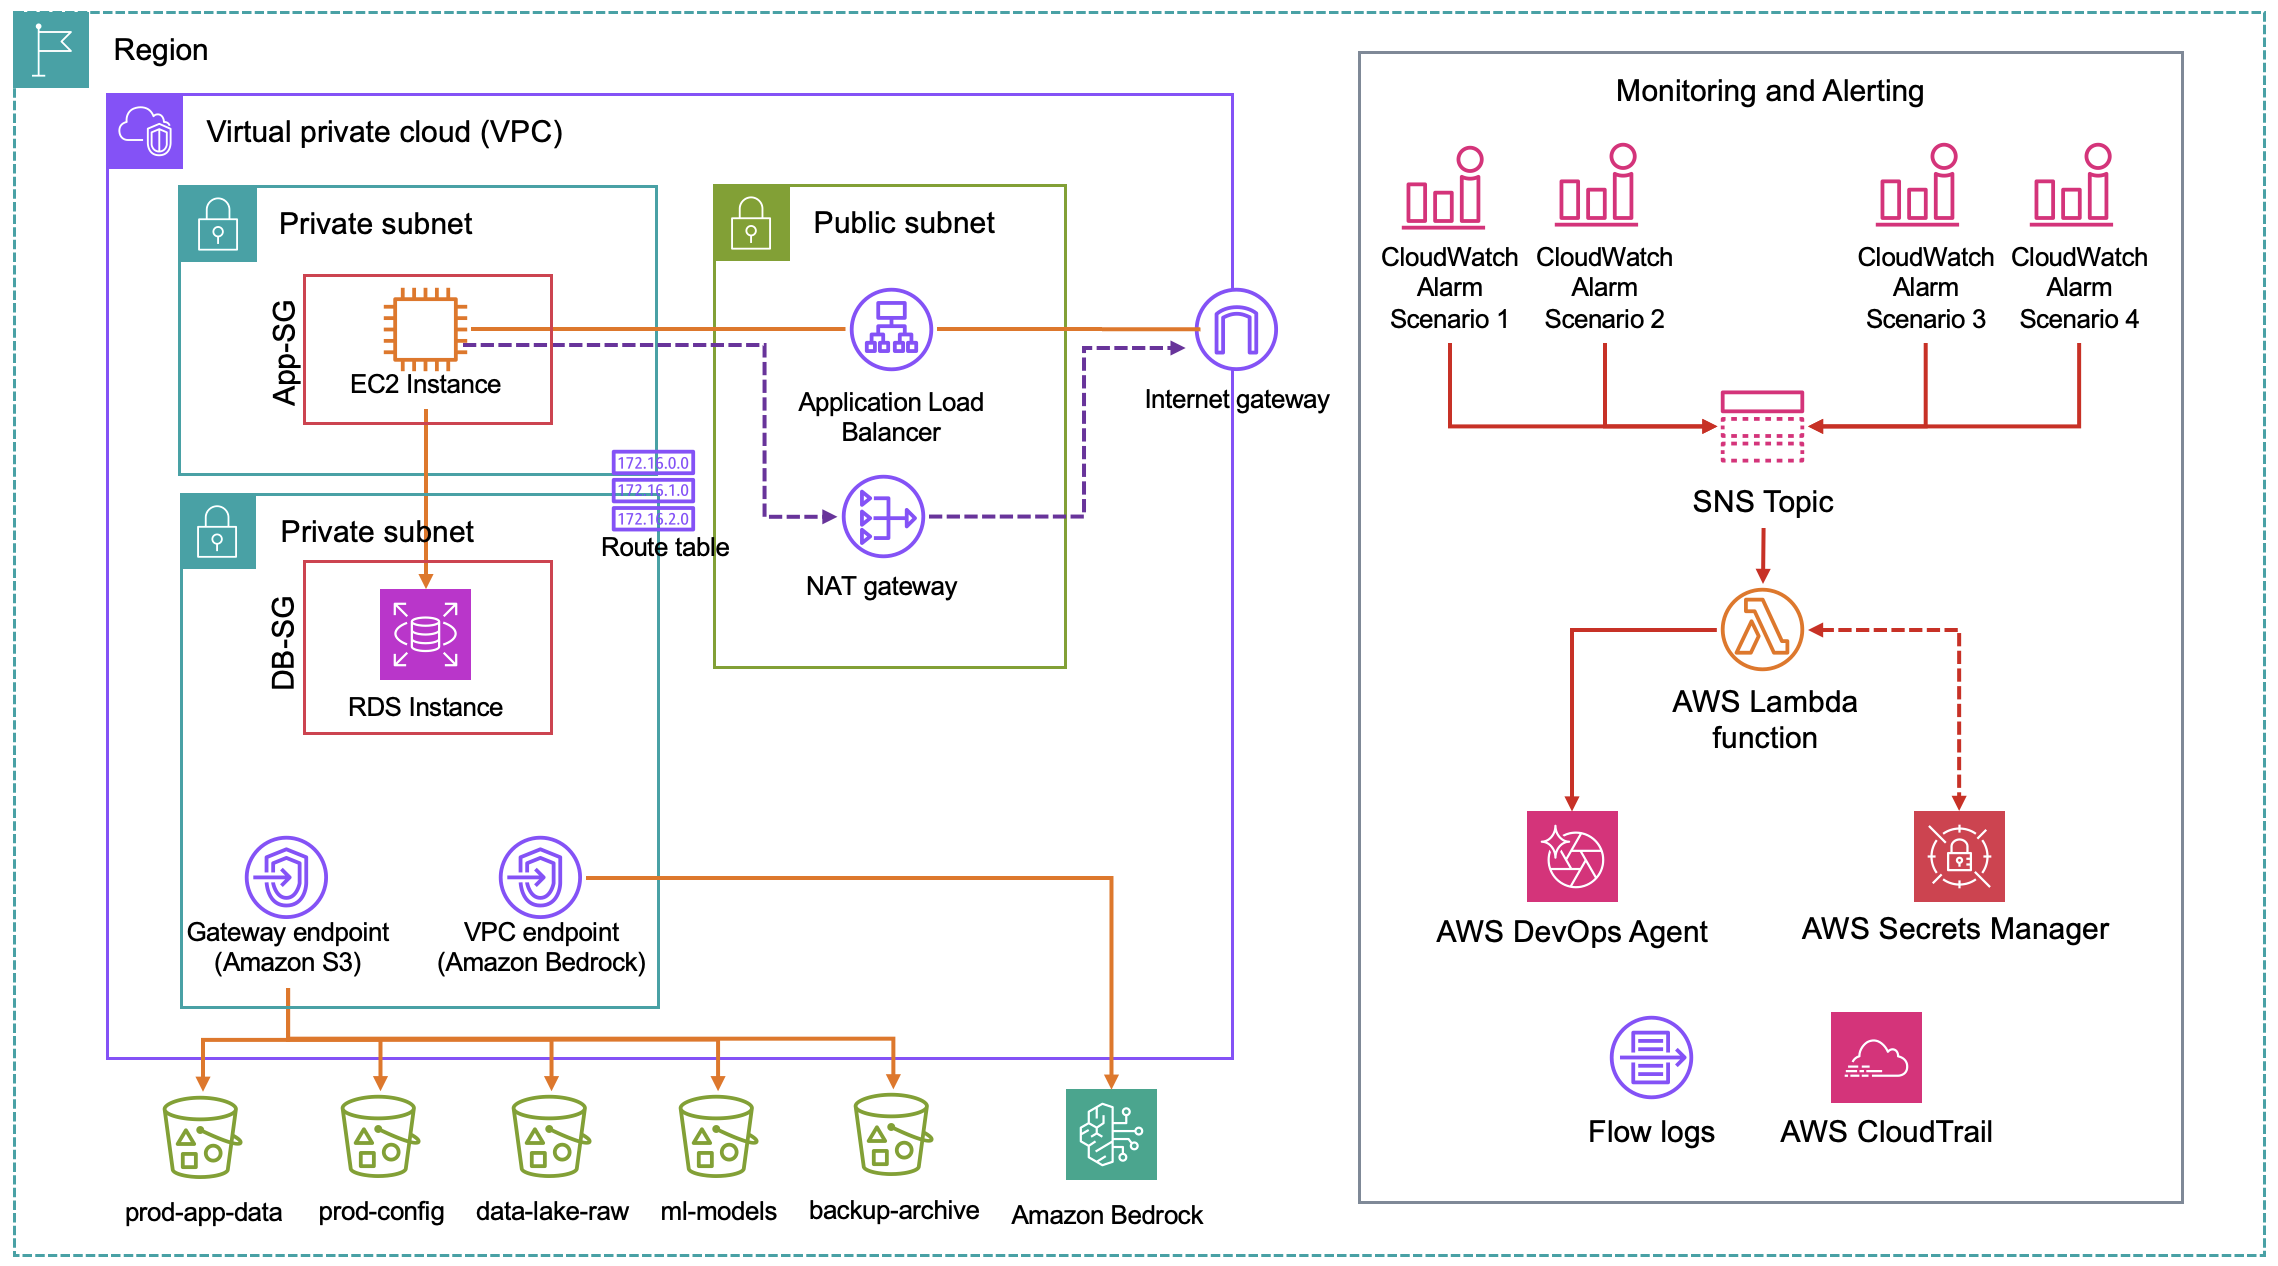 Figure 1: Simulated workload architecture showing the ALB, EC2 instance in private subnets, RDS, S3 Gateway Endpoint, Interface VPC Endpoint, NAT Gateway, and the alarm pipeline
Now that you understand the simulated workload and what DevOps Agent can do, let’s walk through setting up the environment and running through the scenarios.
Deploy the simulated workload using AWS CloudFormation
Download the CloudFormation template from the GitHub repository, then open the AWS CloudFormation console in the us-east-1 region.
- Choose Create stack, then select With new resources (standard).
- Select Upload a template file, upload the downloaded file, and choose Next.
- Enter a stack name, acknowledge any IAM checkboxes, and choose Submit.
Once your CloudFormation deployment is complete, navigate to the Outputs tab in the CloudFormation console where you’ll find a link to access the simulated workload application status page. The status page will show the application running correctly, with green “Connected” boxes confirming all checks are passing.
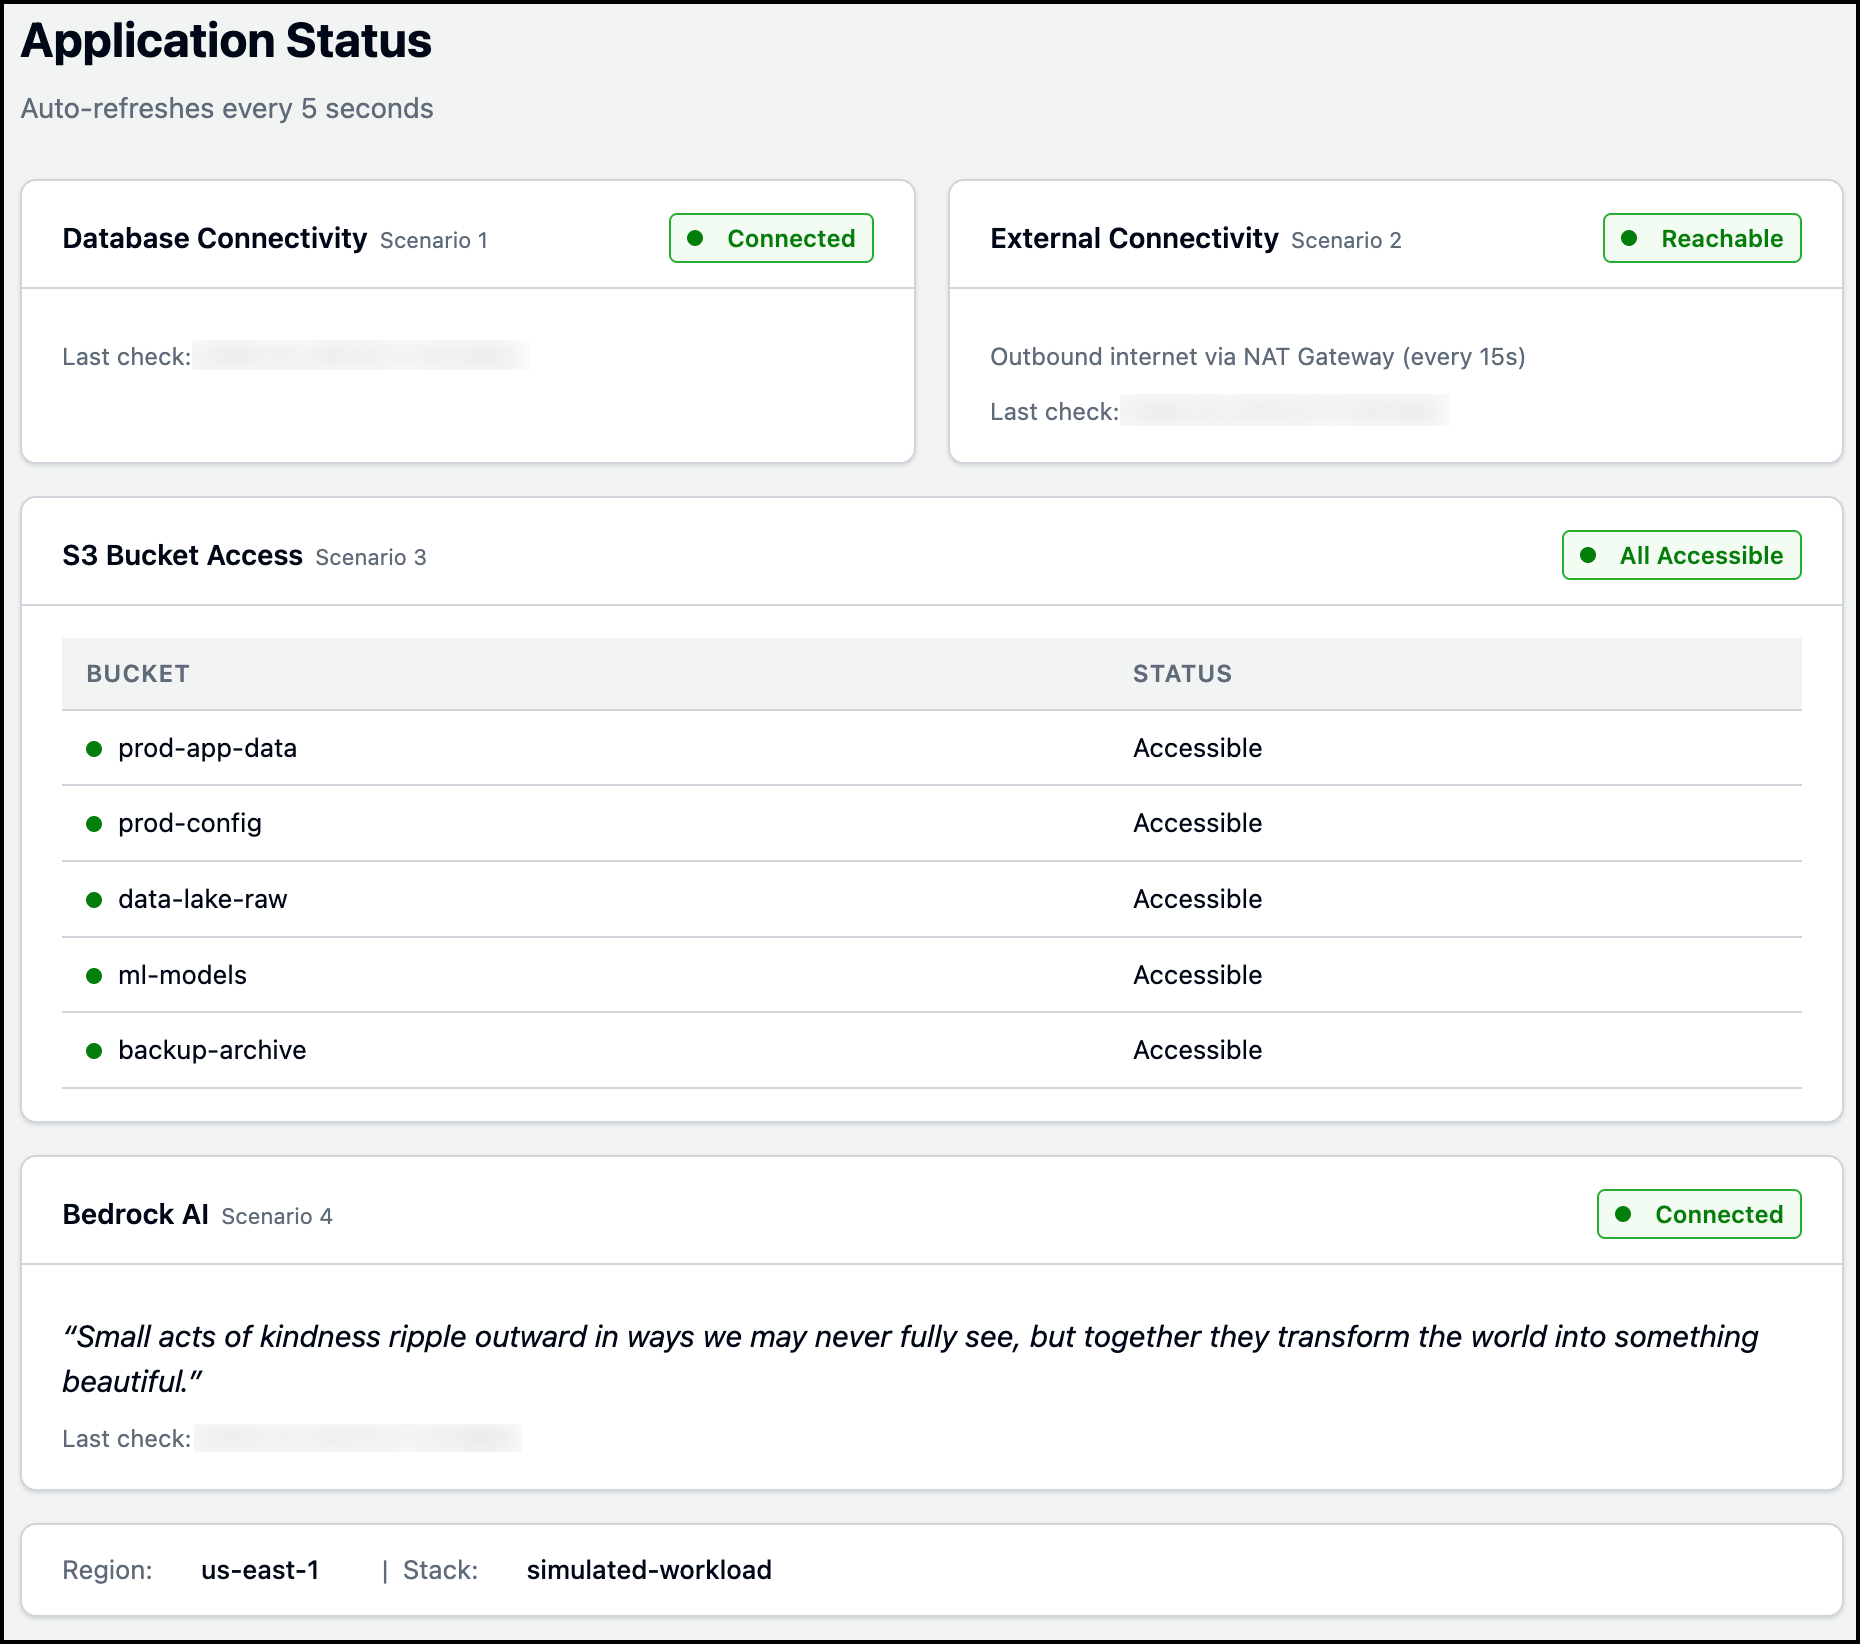 Figure 2: Simulated workload application status page
With the simulated workload application running, it’s time to set up AWS DevOps Agent. Create a DevOps Agent Space, configure the webhook integration, and verify the connection. Once setup is complete, we’ll walk through four networking scenarios where configuration changes break parts of the application, and DevOps Agent automatically diagnoses them.
Setting up AWS DevOps Agent
- Create a DevOps Agent Space.
- Configure the DevOps Agent Webhook.
- After creating the Webhook and downloading the CSV file, Navigate to AWS Secrets Manager in the AWS Console (us-east-1 region), find the secret
simulated-workload-webhook-credentials, and update the two values with your webhook URL and secret from the CSV file. - Before proceeding, verify the integration is working by testing the Webhook:
- In the AWS Console, open Lambda, find the function
simulated-workload-DevOpsAgent-Webhook, and select the Test tab. - Create a new test event named TestAlarm with the following JSON:
{ "Records": [ { "Sns": { "Message": "{\"AlarmName\":\"TEST-webhook-verification\",\"AlarmDescription\":\"[TEST] This is a webhook integration test - not a real incident. No investigation needed.\",\"NewStateValue\":\"ALARM\",\"NewStateReason\":\"[TEST] Manual test to verify webhook connectivity from Lambda to DevOps Agent. Safe to ignore.\",\"Region\":\"us-east-1\"}" } } ] } - Click Save, then Test. Confirm that the following is returned.
{ "statusCode": 200, "body": "{\"message\": \"DevOps Agent investigation triggered\", \"alarmName\": \"TEST-webhook-verification\", \"webhookStatus\": 200}" } - In the DevOps Agent Web App, confirm a test investigation named
CloudWatch Alarm: TEST-webhook-verificationappears under the Incident tab.
- In the AWS Console, open Lambda, find the function
The following Figure 3 shows how this specific test output looks like in the DevOps Agent Web App.
 Figure 3: Output from a manually triggered DevOps agent run, confirming the webhook integration works
How the alarm pipeline works, from failure to investigation
Every failure follows the same path to DevOps Agent. The application publishes a custom metric to Amazon CloudWatch. A CloudWatch alarm evaluates that metric and transitions to ALARM. The alarm notifies an Amazon SNS topic. Amazon SNS invokes an AWS Lambda function that reads webhook credentials from AWS Secrets Manager, builds an incident payload, signs it with HMAC SHA-256, and POSTs it to the DevOps Agent webhook. DevOps Agent validates the signature and starts an investigation. This pipeline is shown in Figure 4.
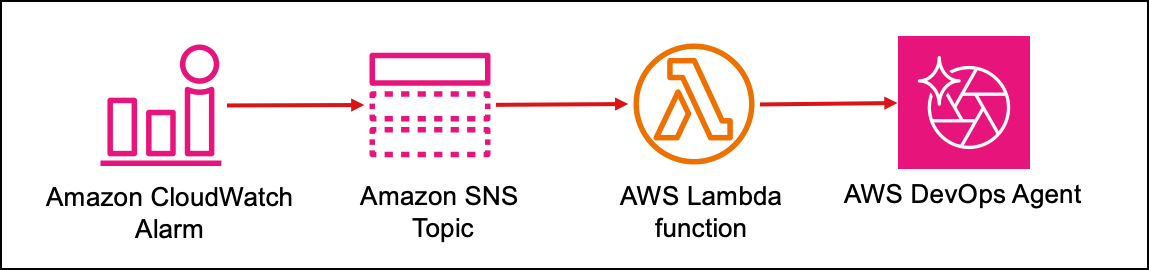 Figure 4: Alarm pipeline
Figure 5 shows the four CloudWatch alarms configured to monitor the simulated workload application.
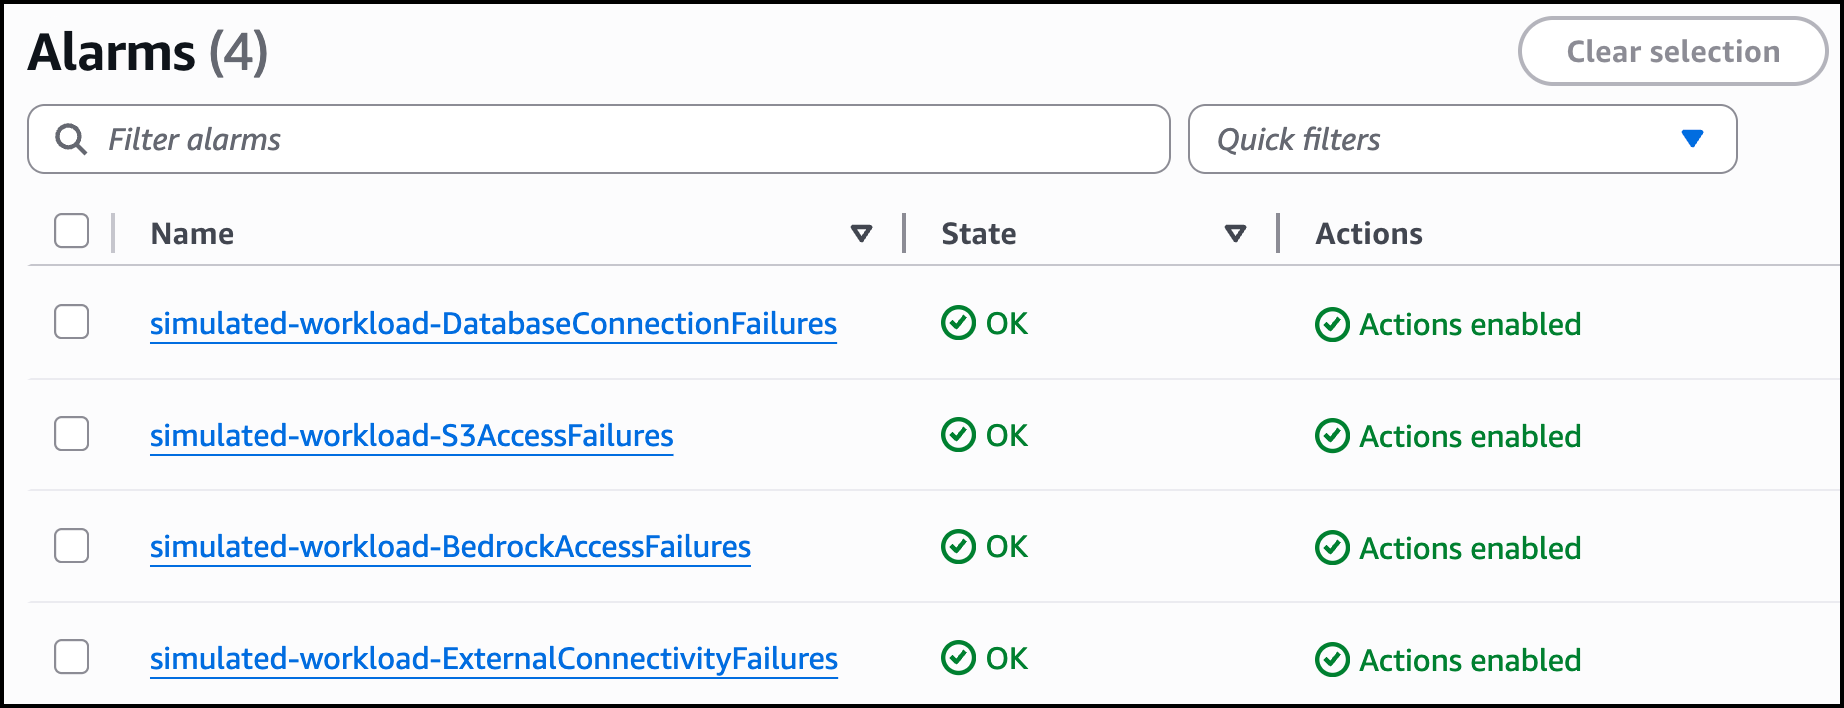 Figure 5: CloudWatch Alarms
Amazon SNS sits between Amazon CloudWatch and AWS Lambda for three reasons: it retries delivery if Lambda is throttled (with dead letter queue support), it fans out to additional subscribers (email, chat tools, incident management systems) without touching the alarm, and it supports cross account publishing so alarms from multiple accounts can feed a single operations pipeline.
Scenario 1: Security group rule deleted, database goes down
The database security group (simulated-workload-DB-SG) allows inbound MySQL traffic (port 3306) from the application security group (devops-agent-sample-app-App-SG). The following Figure 6 shows this the inbound rule being deleted.
 Figure 6: Security group inbound rule being deleted
When someone deletes the inbound rule, the app loses database connectivity within seconds. Security groups silently drop packets that do not match any rule, so the application’s connection attempt gets no response and times out (you will see ETIMEDOUT on the status dashboard). The other three checks (external connectivity, S3, and Bedrock) stay green because none of them touch port 3306.
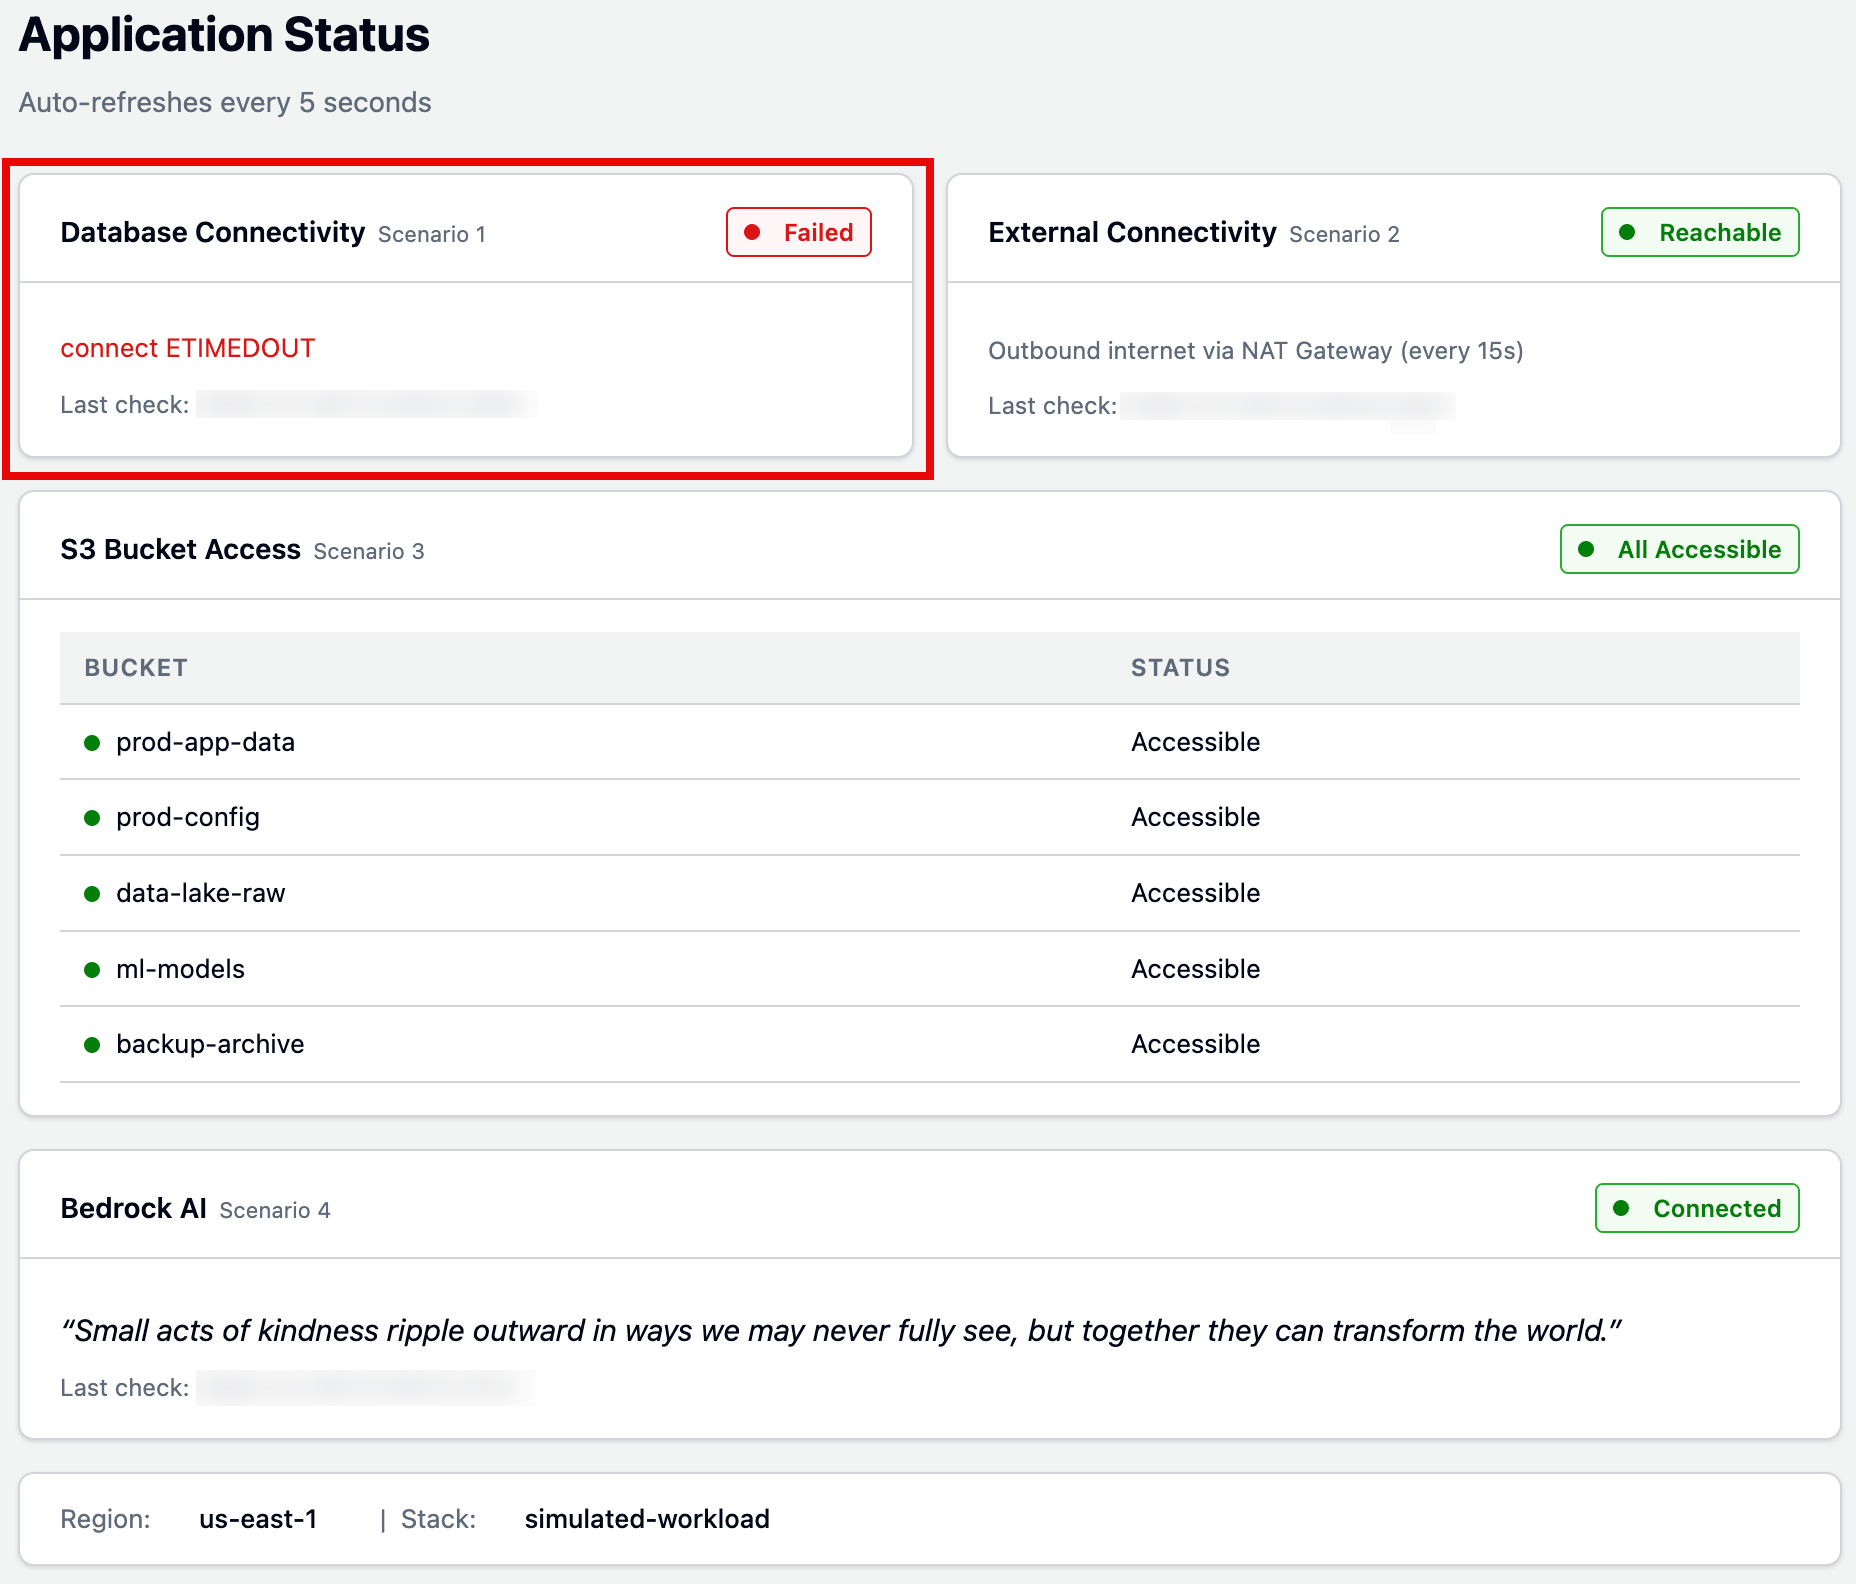 Figure 7: Simulated workload application status page
DevOps Agent receives the DatabaseConnectionFailures alarm and investigates:
- Checks RDS instance health – Confirms the database is available but reporting zero connections.
- Searches CloudTrail logs – Finds the
RevokeSecurityGroupIngressAPI call, including who ran it and when (just 15 seconds before the alarm triggered). - Maps resource relationships – Uses its topology to identify the EC2-to-RDS connection dependency.
- Identifies root cause – The inbound rule on the database security group that allowed traffic from the application security group on port 3306 was removed, immediately blocking all MySQL connections while the database itself remained healthy.
Figures 8 and 9 display the investigation timeline and root cause tabs. After reviewing the root cause, you can generate a mitigation plan to see how to resolve the issue. Figure 10 shows the mitigation plan detailing the steps (AWS CLI command) needed to fix the security group.
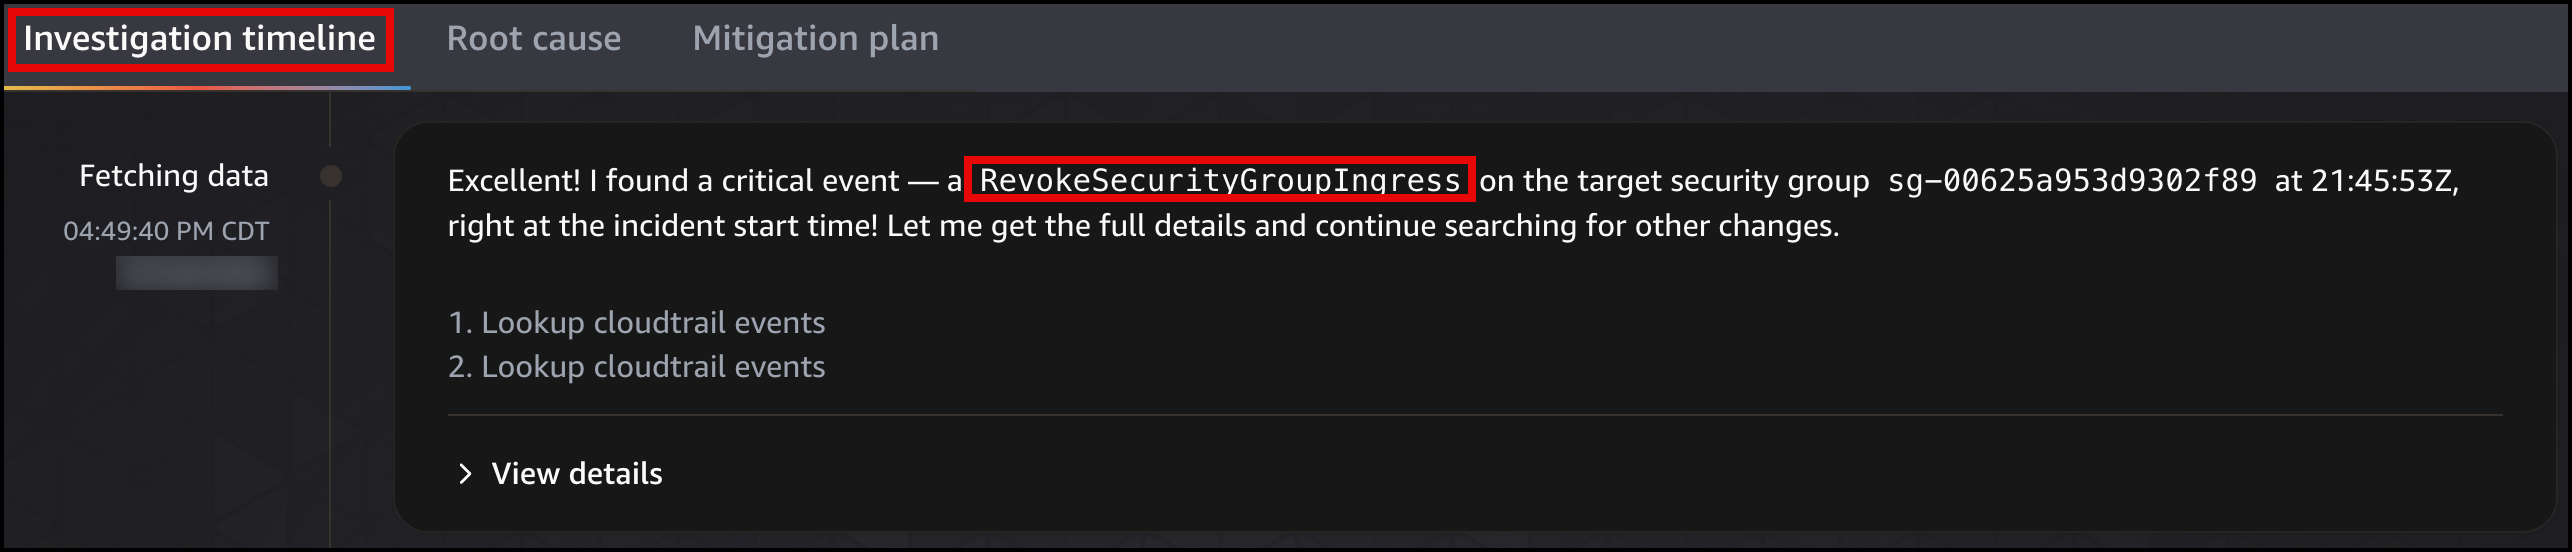 Figure 8: DevOps Agent investigation timeline
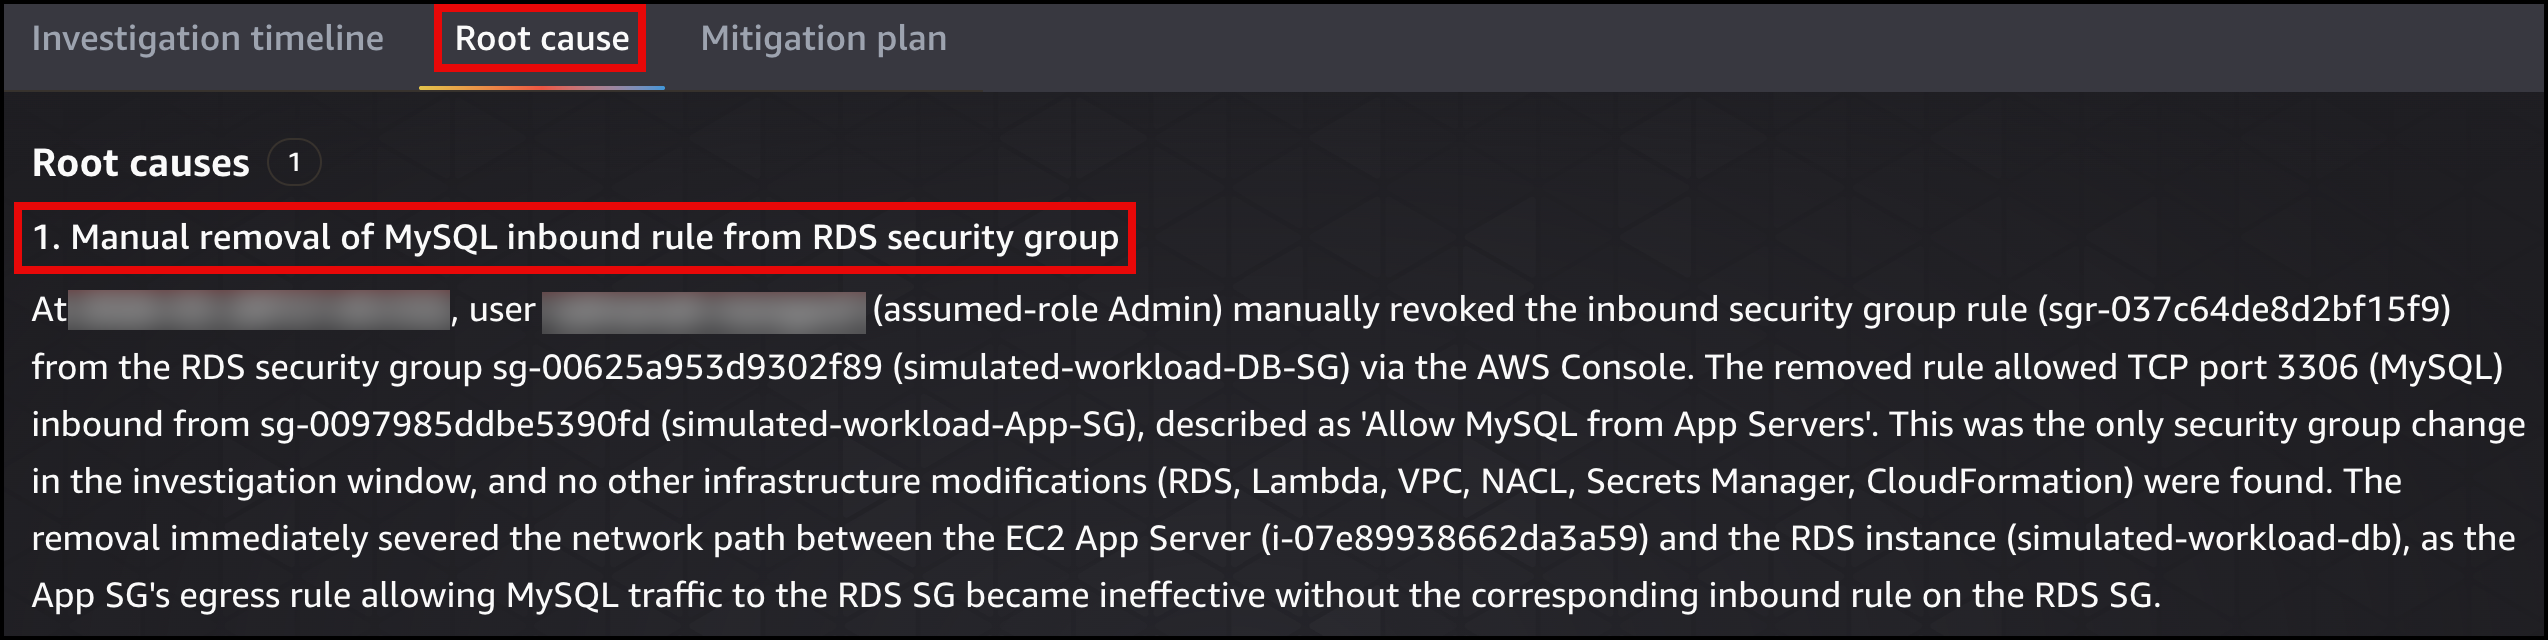 Figure 9: DevOps Agent root cause analysis
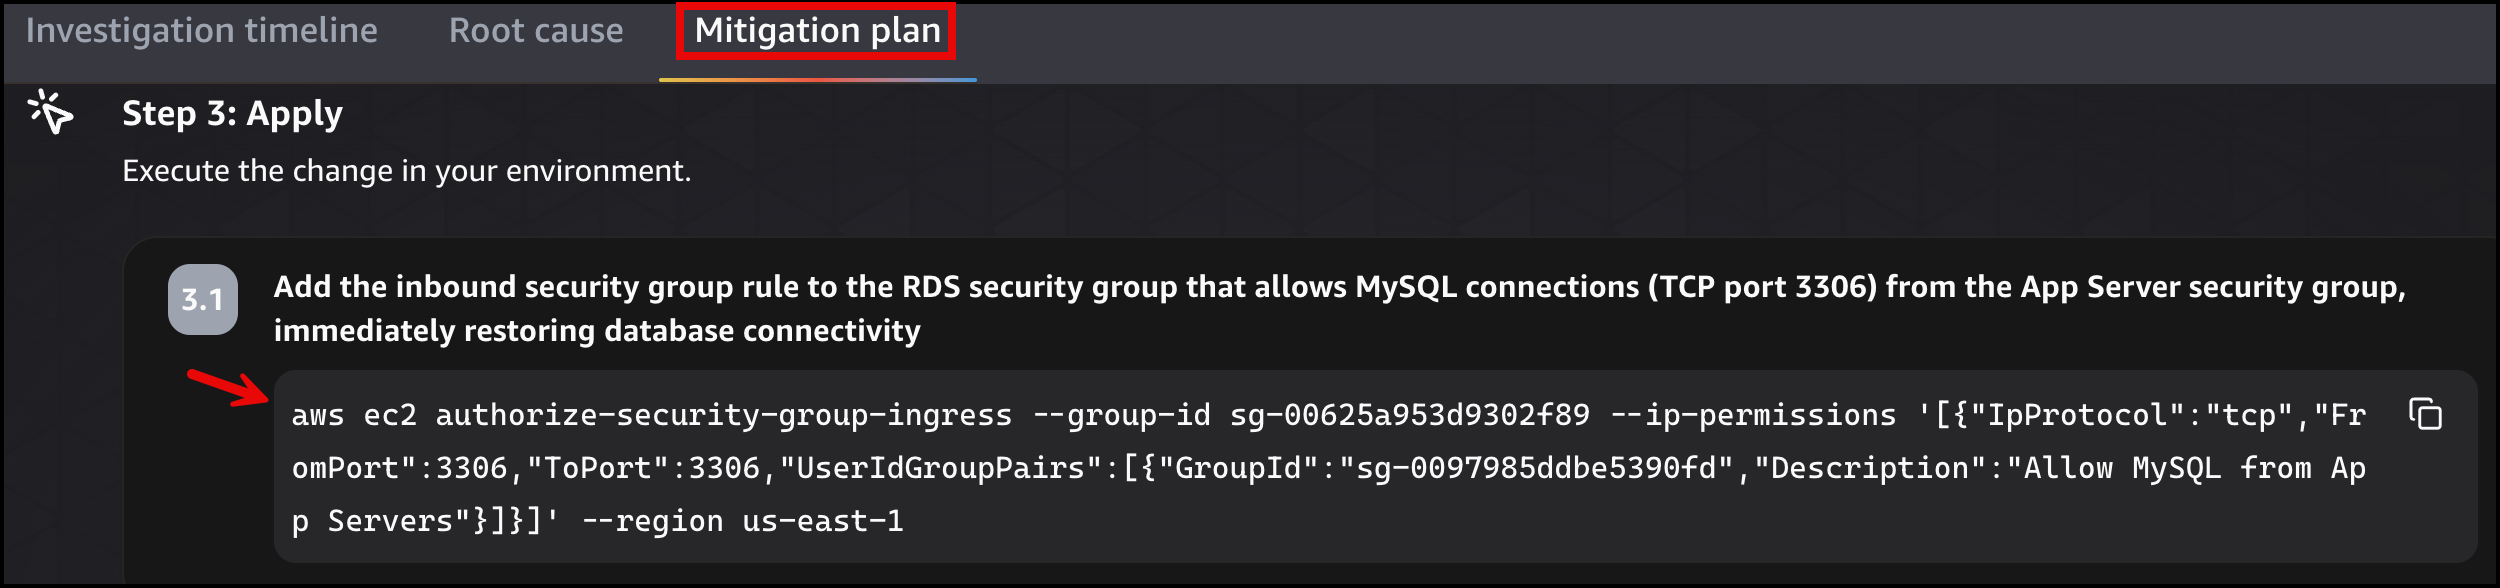 Figure 10: DevOps Agent migration plan
Once the fix is applied, the simulated workload application page will show the status as green Connected state for Database Connectivity.
Scenario 2: NAT Gateway route deleted, outbound internet lost
The private route table (simulated-workload-Private-RT) has a default route that sends all non-VPC traffic to the NAT Gateway. The following Figure 11 shows the route being deleted.
 Figure 11: Default route deleted from the private route table
When someone deletes this route, the app can no longer reach the public internet. But the database still works (VPC local route), Amazon S3 still works (Gateway Endpoint has its own route table entry), and Amazon Bedrock still works (Interface Endpoint places ENIs directly in the subnet). Only the external connectivity check turns red.
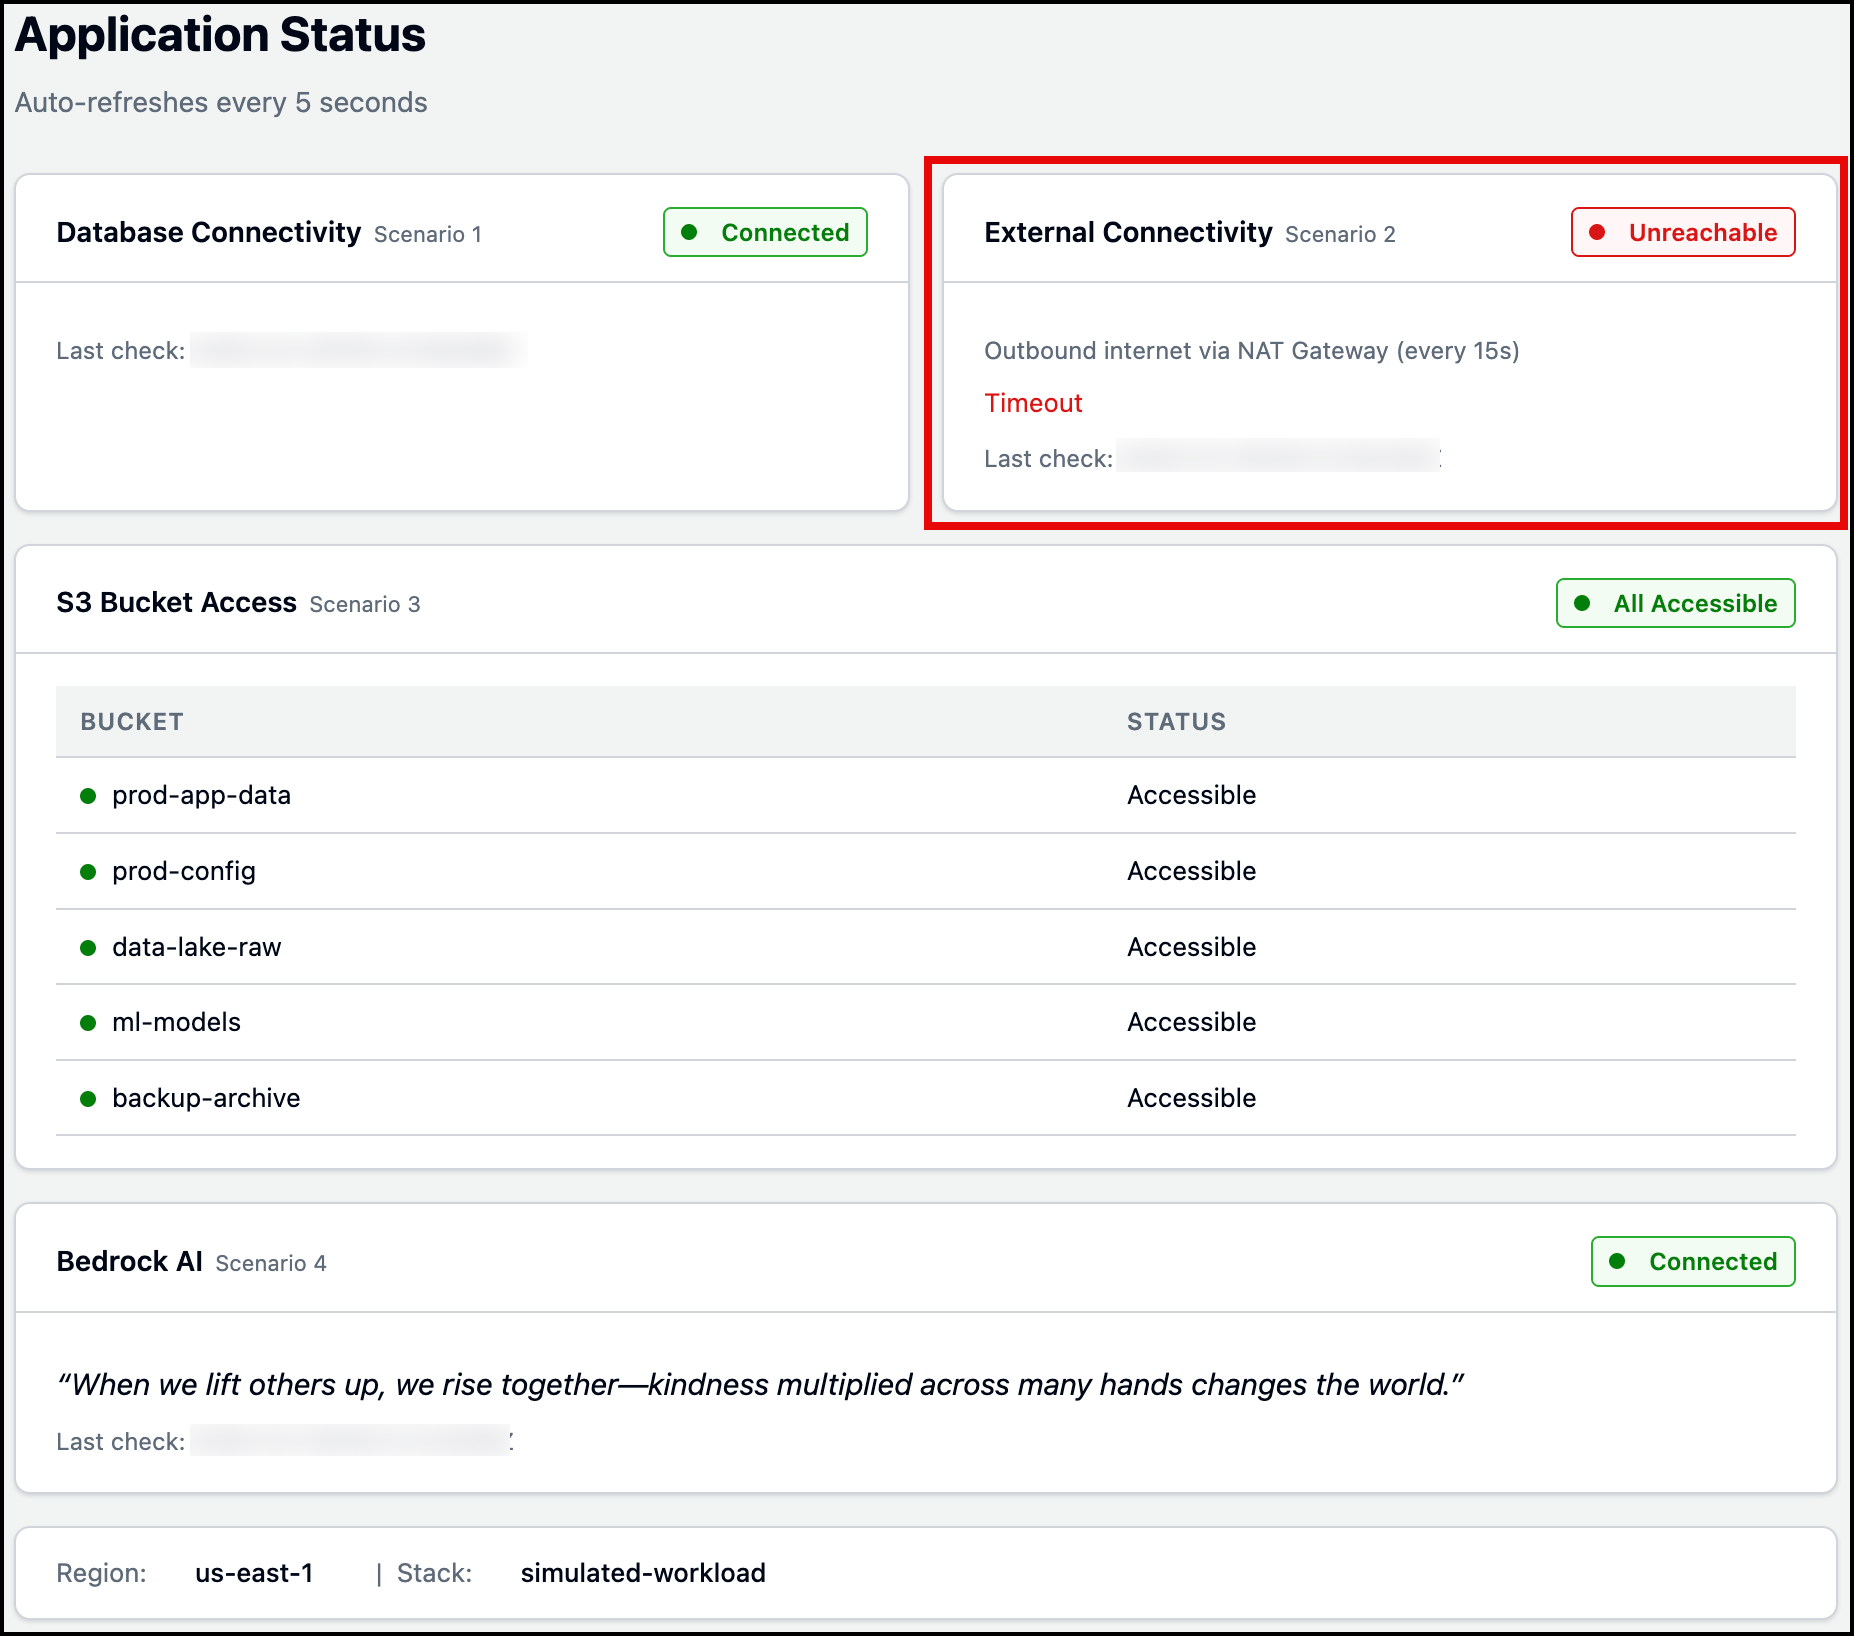 Figure 12: Simulated workload application status page
DevOps Agent receives the ExternalConnectivityFailures alarm and investigates:
- Examines the private route table – Identifies that the default route (0.0.0.0/0) pointing to the NAT Gateway is missing.
- Confirms NAT Gateway health – Verifies the NAT Gateway itself is healthy with no capacity issues or errors.
- Searches CloudTrail logs – Finds the
DeleteRouteAPI call, including who ran it and when. - Maps resource relationships – Uses its topology to identify the EC2-to-NAT Gateway dependency.
- Identifies root cause – The default route was removed from the private route table, leaving the EC2 instance with no routing path for internet-bound traffic.
Figures 13 and 14 display the investigation timeline and root cause tabs. After reviewing the root cause, you can generate a mitigation plan to see how to resolve the issue. Figure 15 shows the mitigation plan detailing the steps (AWS CLI command) needed to restore the NAT Gateway route.
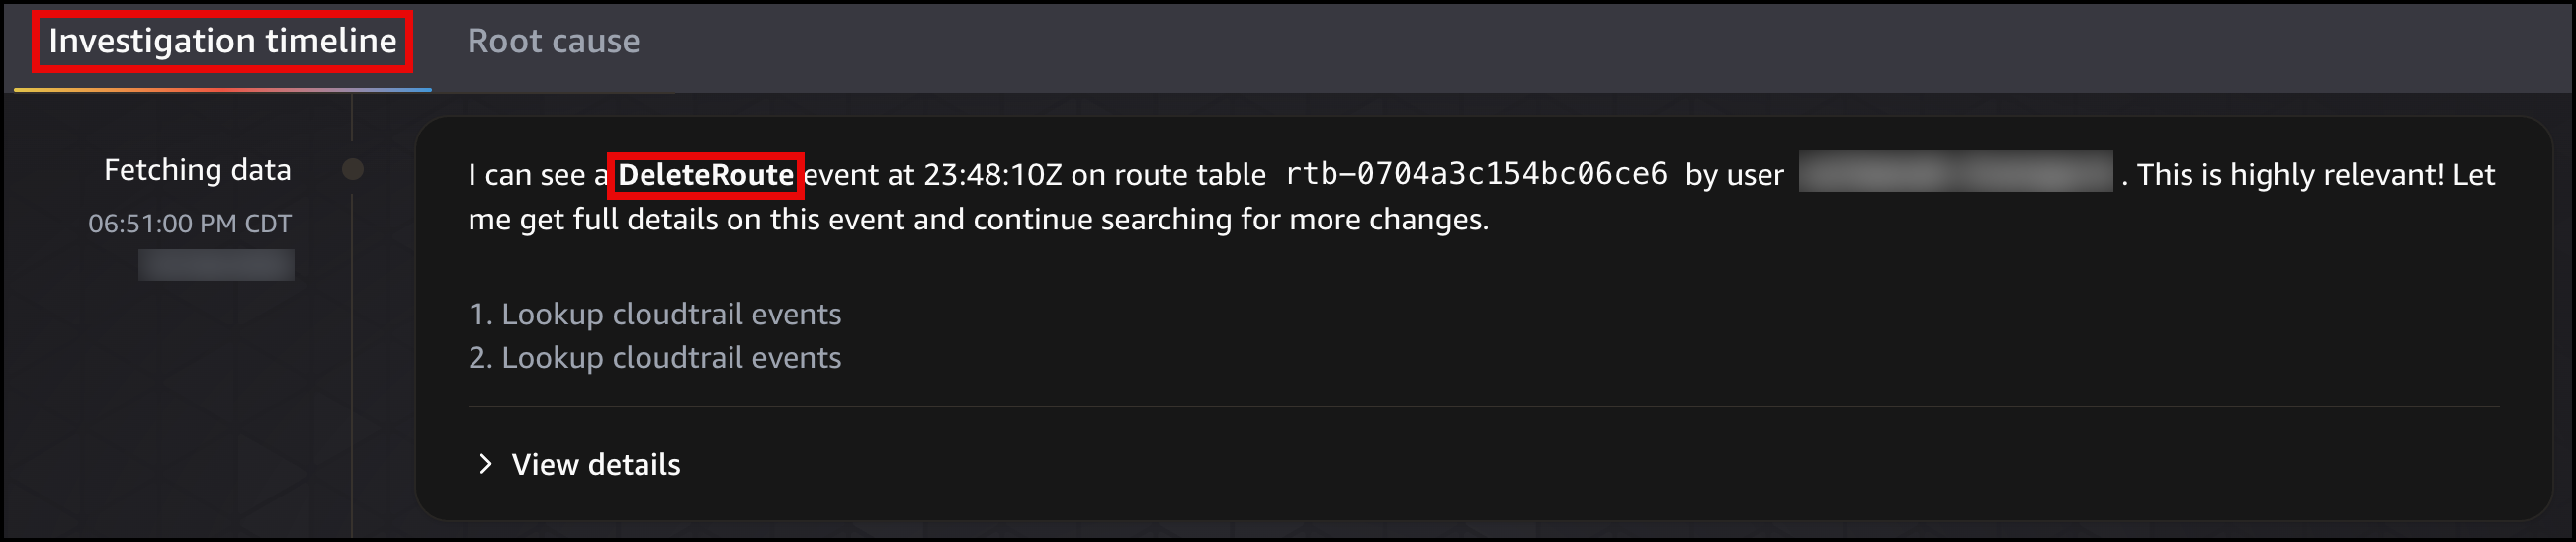 Figure 13: DevOps Agent investigation timeline
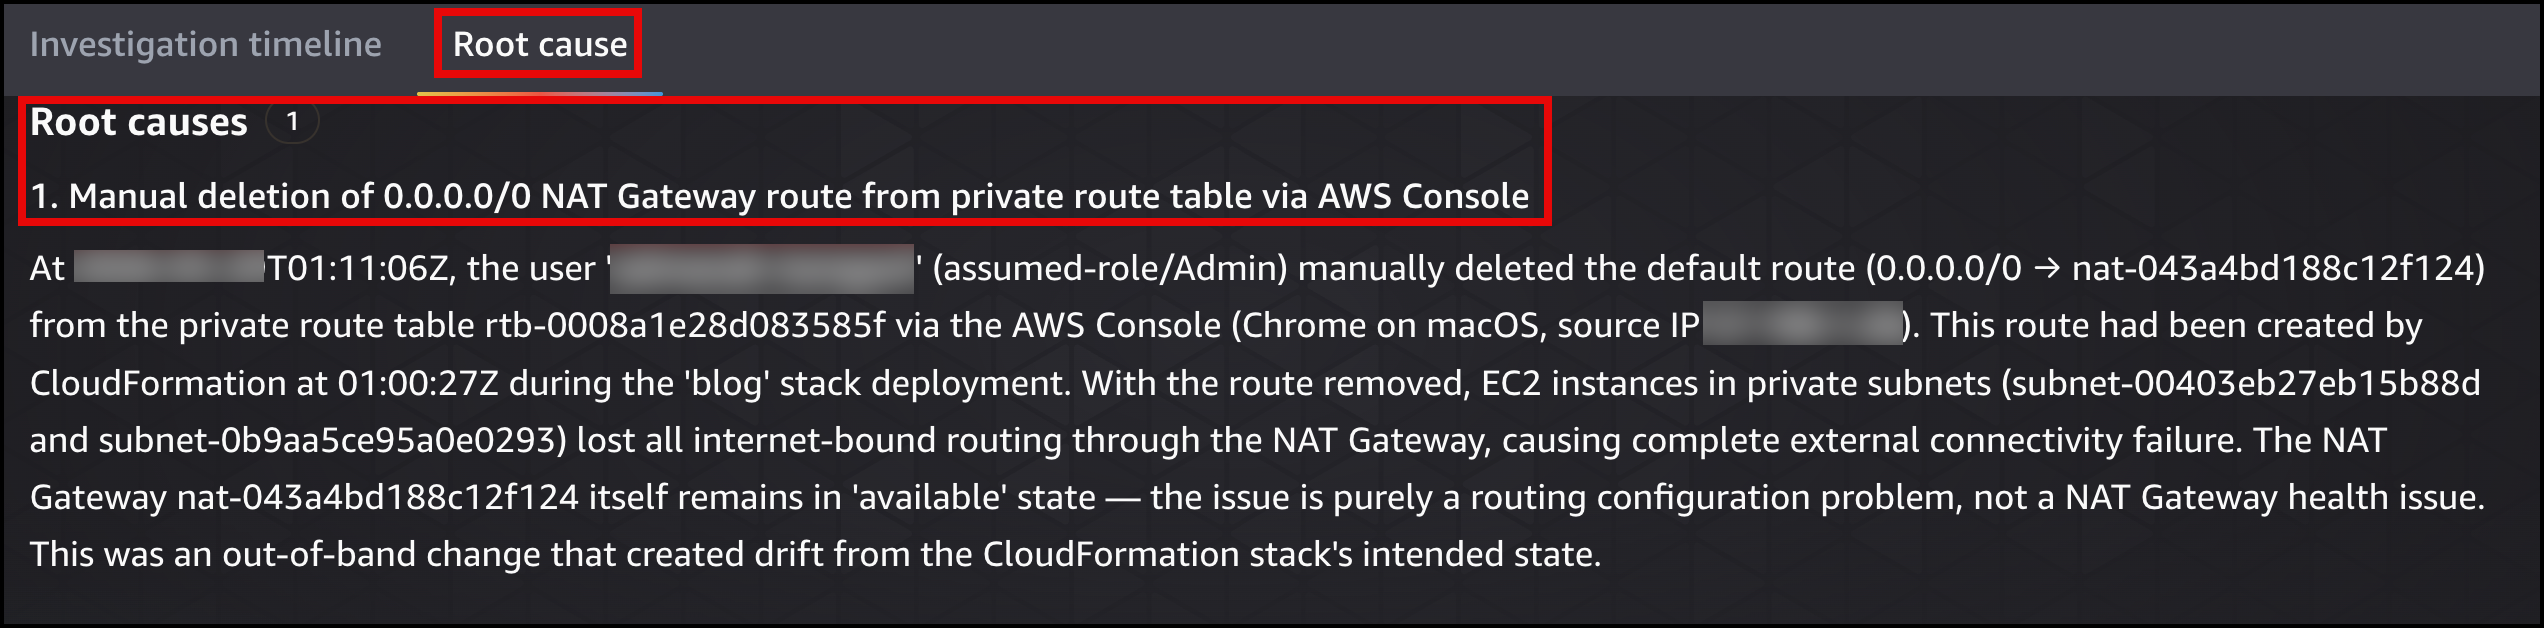 Figure 14: DevOps Agent root cause
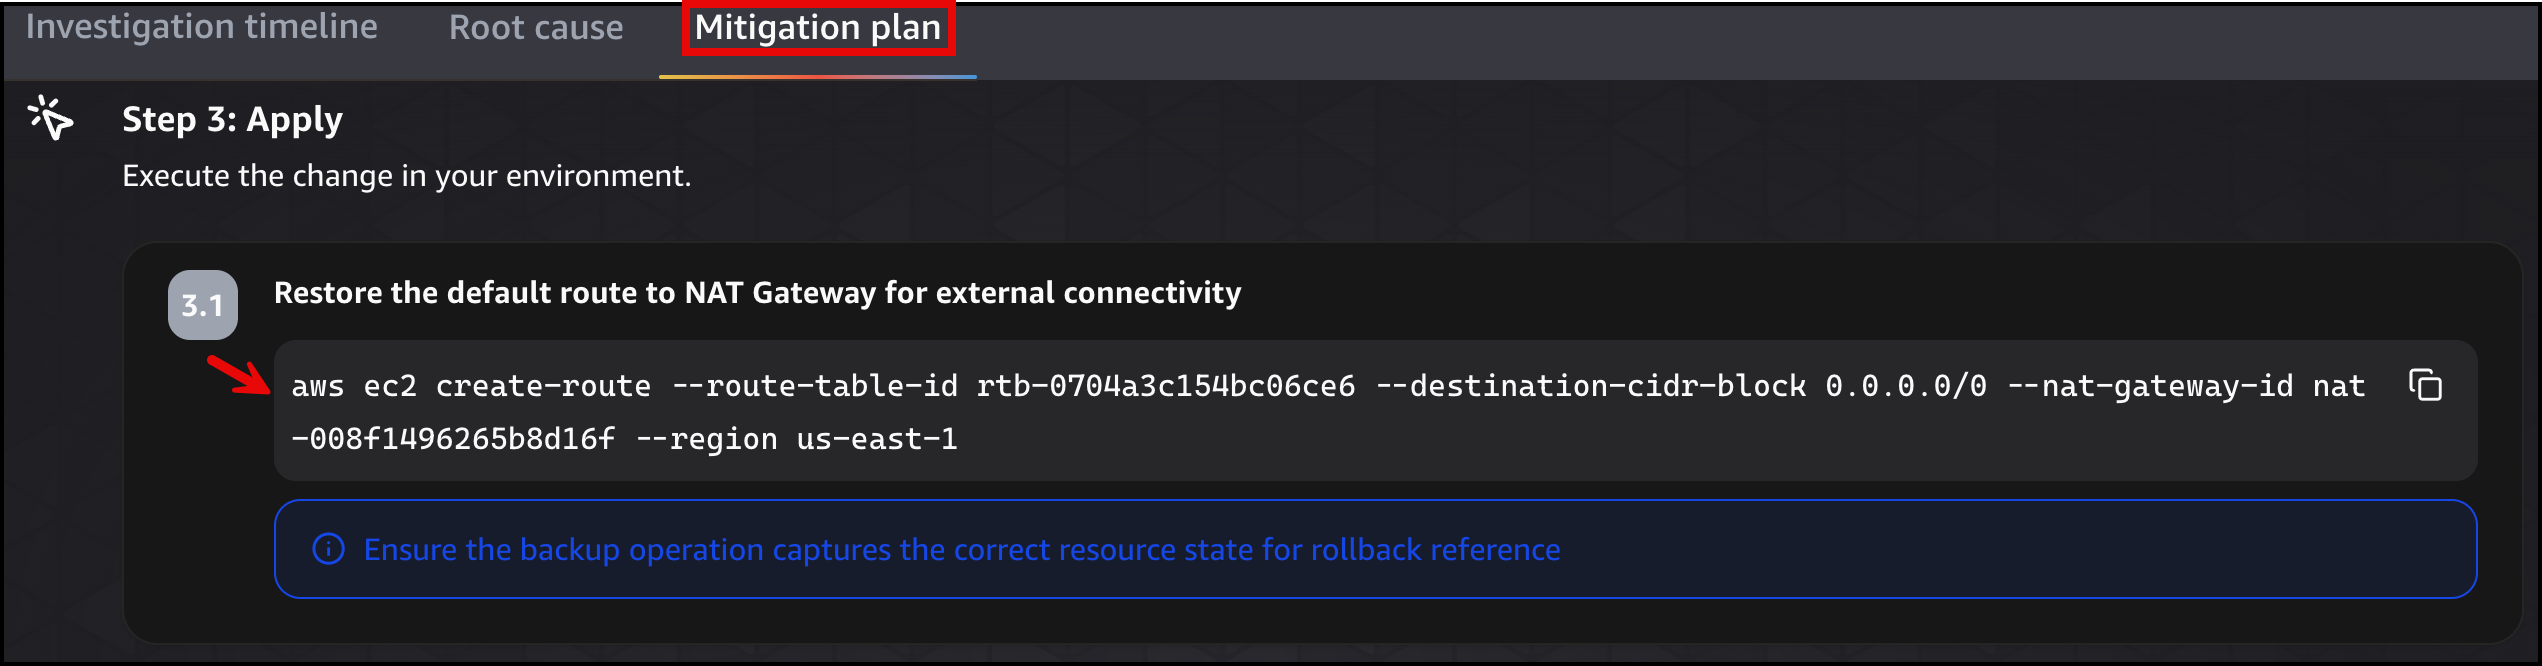 Figure 15: DevOps Agent migration plan
Once the fix is applied, the simulated workload application page will show the status as green Reachable state for External Connectivity.
Scenario 3: VPC endpoint policy restricts S3 bucket access
The S3 VPC Gateway Endpoint (simulated-workload-S3-Endpoint) has a policy that allows access to all five application buckets. The following Figure 16 shows the modification of the VPC endpoint policy.
 Figure 16: Modifying of the VPC endpoint policy
When someone edits this policy to allow only three of the five buckets, the other two start returning AccessDenied. This is the scenario that confuses people most, because the AWS Identity and Access Management (IAM) policy still grants access to all five. For Amazon S3 traffic through a Gateway Endpoint, three layers of policy have to agree: IAM, the bucket policy, and the endpoint policy. If any one of those layers denies the request, you get an Access Denied (HTTP 403 Forbidden) error.
But everything else still works:
- The database works (VPC local route).
- Amazon Bedrock works (Interface Endpoint places ENIs directly in the subnet).
- Outbound internet connectivity works (NAT Gateway route is intact).
Only the S3 bucket access checks turn red.
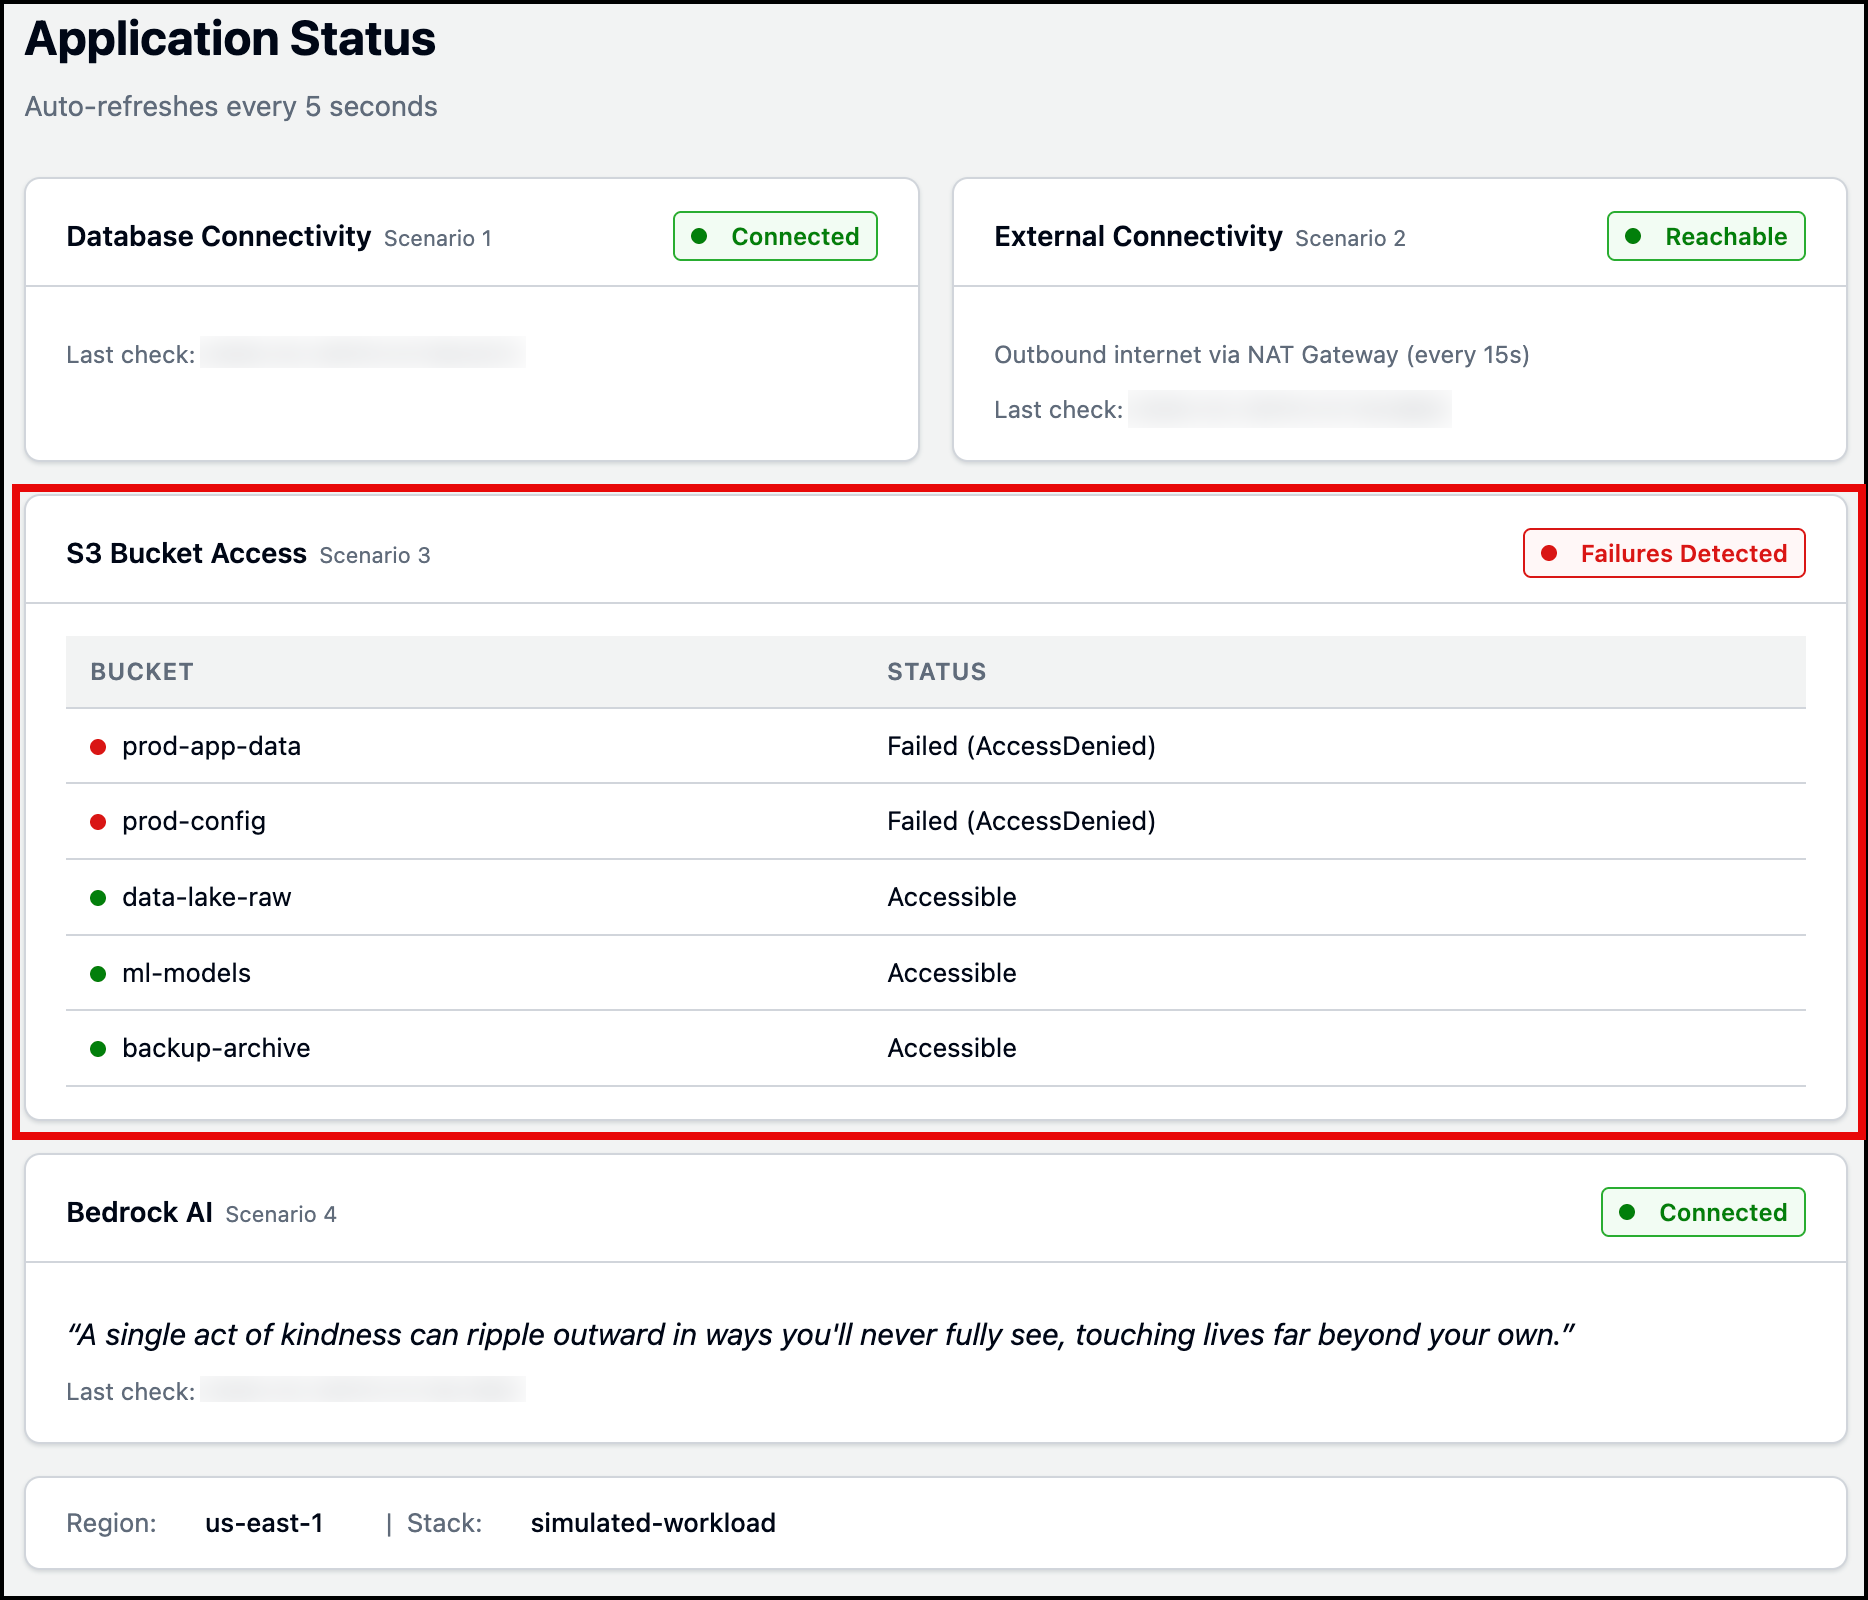 Figure 17: Simulated workload application status page
DevOps Agent receives the S3AccessFailures alarm and investigates:
- Compares policy layers – Examines the endpoint policy against the IAM permissions and the buckets the app tries to reach.
- Identifies the blocking layer – Determines the endpoint policy is restricting access.
- Searches CloudTrail logs – Finds the
ModifyVpcEndpointAPI call, including who modified the policy and when. - Maps resource relationships – Uses its topology to identify the EC2-to-S3 Gateway Endpoint dependency.
- Identifies root cause – The VPC endpoint policy was modified to allow access to only three of the five application buckets, blocking access to the remaining two buckets.
Figures 18 and 19 display the investigation timeline and root cause tabs. After reviewing the root cause, you can generate a mitigation plan to see how to resolve the issue. Figure 20 shows the mitigation plan detailing the steps (AWS CLI Command) needed to restore access to all five S3 buckets.
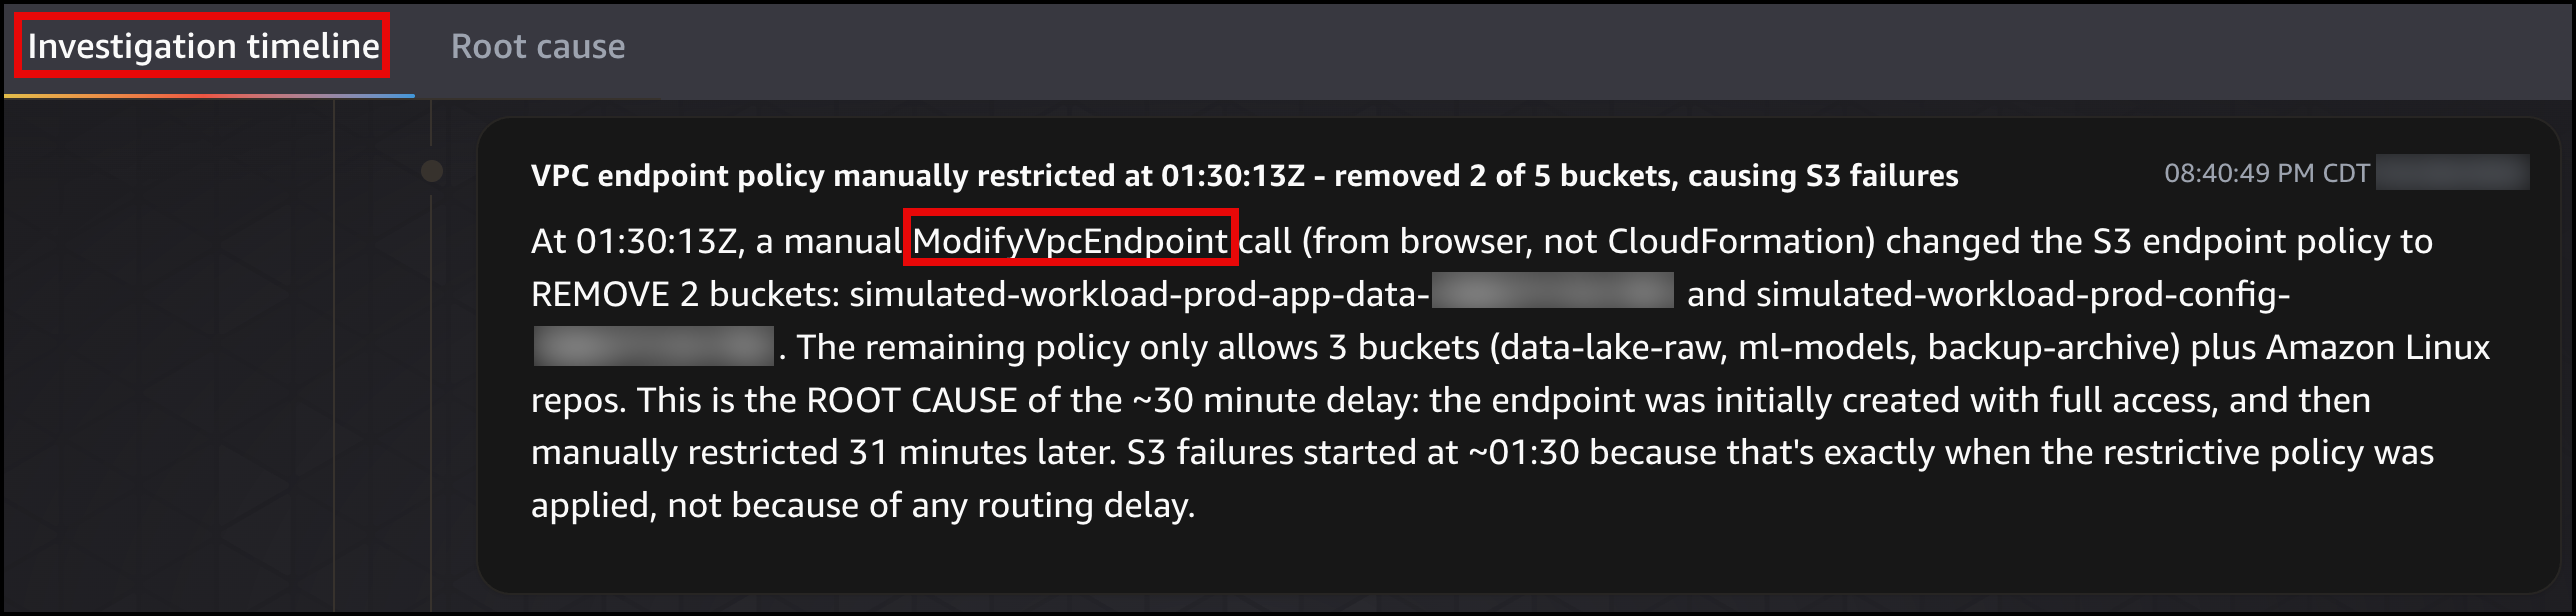 Figure 18: DevOps Agent investigation timeline
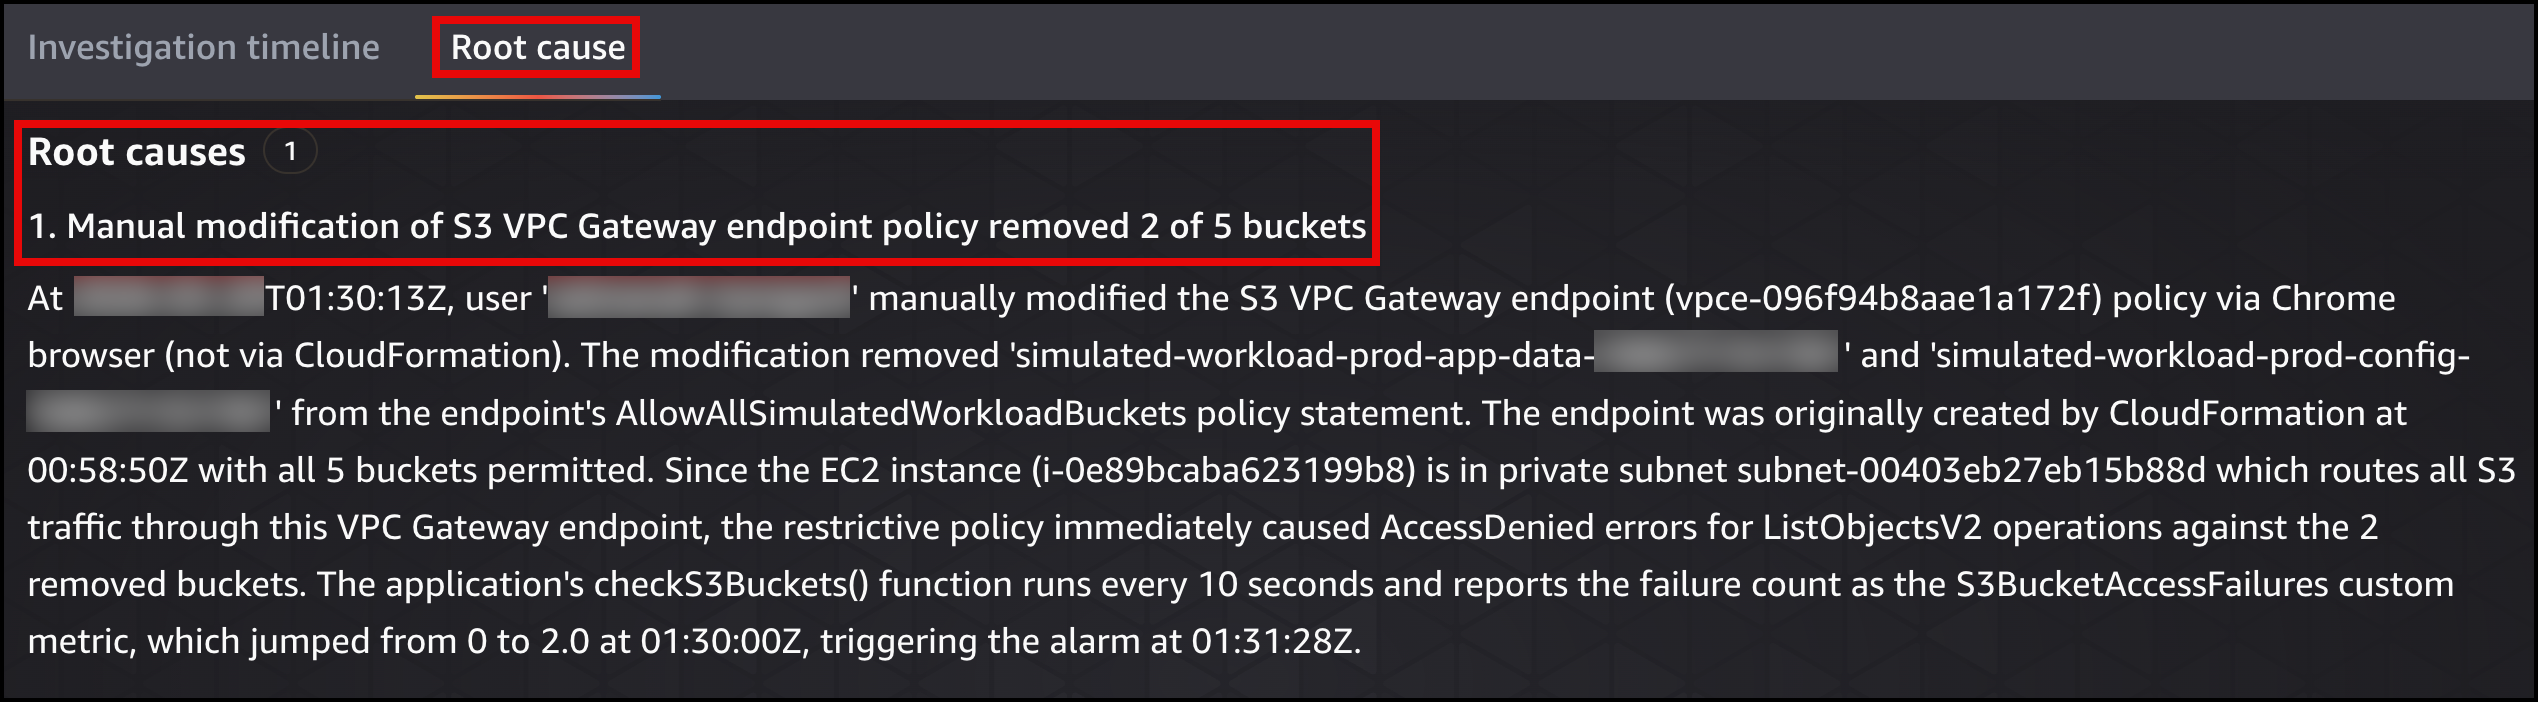 Figure 19: DevOps Agent root cause
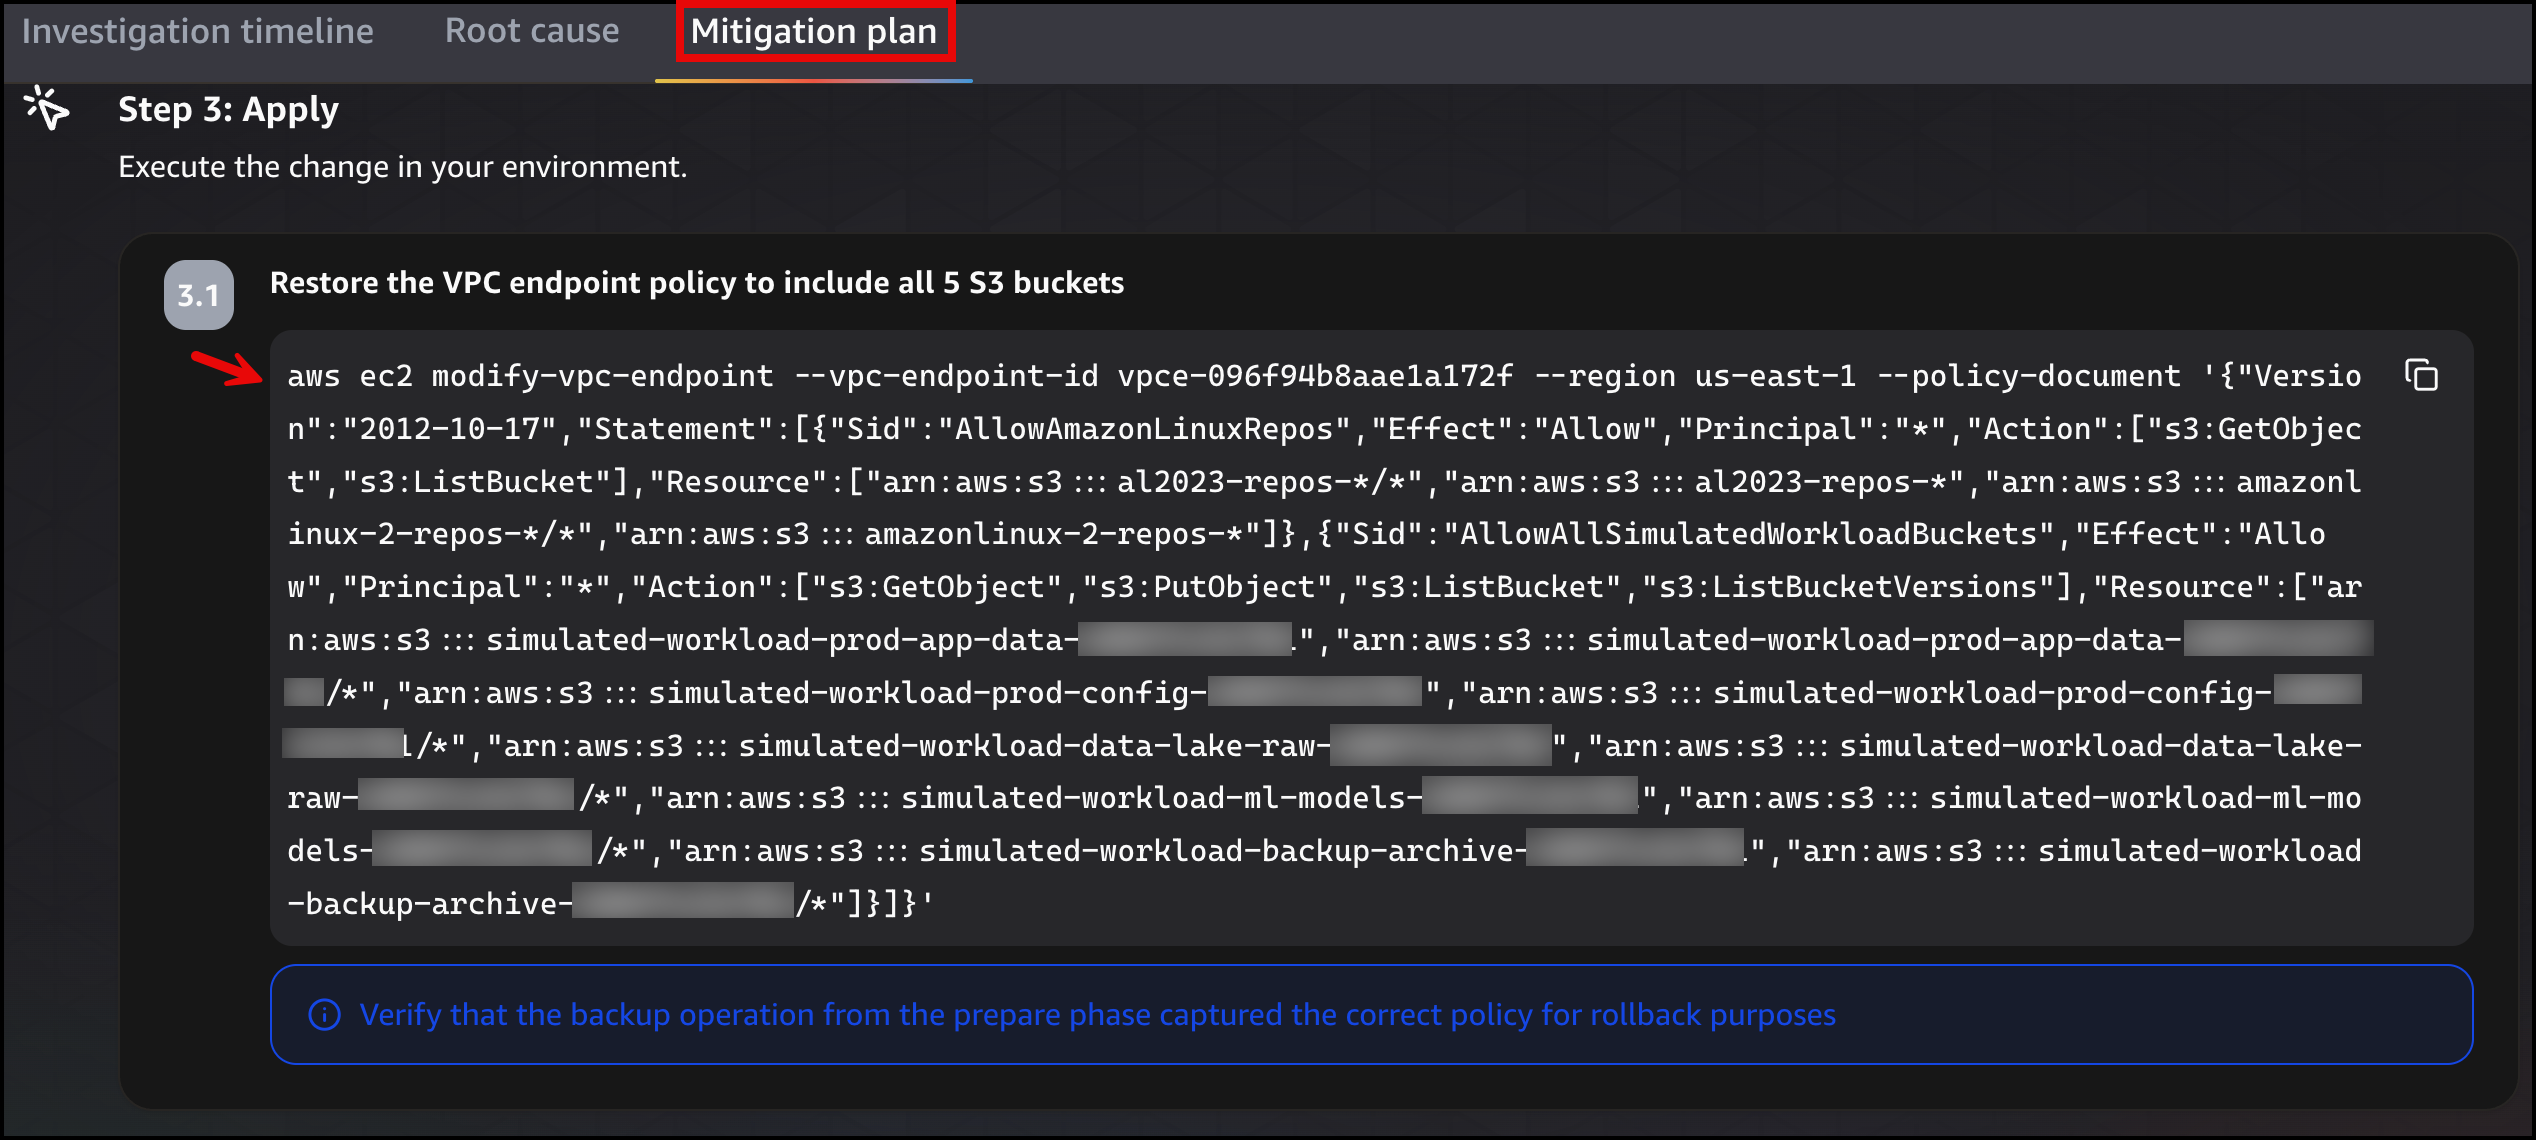 Figure 20: DevOps Agent migration plan
Once the fix is applied, the simulated workload application page will show the status as green All Accessible state for S3 Bucket Access.
Scenario 4: Bedrock Interface Endpoint subnets removed, AI feature breaks
The Bedrock Runtime Interface Endpoint (simulated-workload-Bedrock-Endpoint) creates ENIs in two private subnets. Private DNS resolves bedrock-runtime.us-east-1.amazonaws.com to those ENI IP addresses. The following Figure 21 shows the removal of subnet association.
 Figure 21: Modify subnets associated with interface VPC endpoint
When someone removes both subnet associations, the ENIs are deleted. The endpoint still exists and Private DNS still resolves the hostname to the endpoint, but there is nothing to handle the traffic. This is the scenario that is particularly hard to spot by hand, because the console still shows the endpoint as “Available” even though requests time out with no response. It is worth noting the difference between the two endpoint types: VPC Gateway Endpoints (Amazon S3, Amazon DynamoDB) work through route table entries and endpoint policies, so a misconfiguration there returns an Access Denied (HTTP 403 Forbidden) error. Interface VPC Endpoints (Amazon Bedrock and many other AWS services) work through ENIs in your subnets with their own security groups, so when those ENIs are gone, you get connection timeouts instead. But the database still works (VPC local route), Amazon S3 still works (VPC Gateway Endpoint has its own route table entry), and outbound internet connectivity still works (NAT Gateway route is intact). Only the Bedrock AI check turns red.
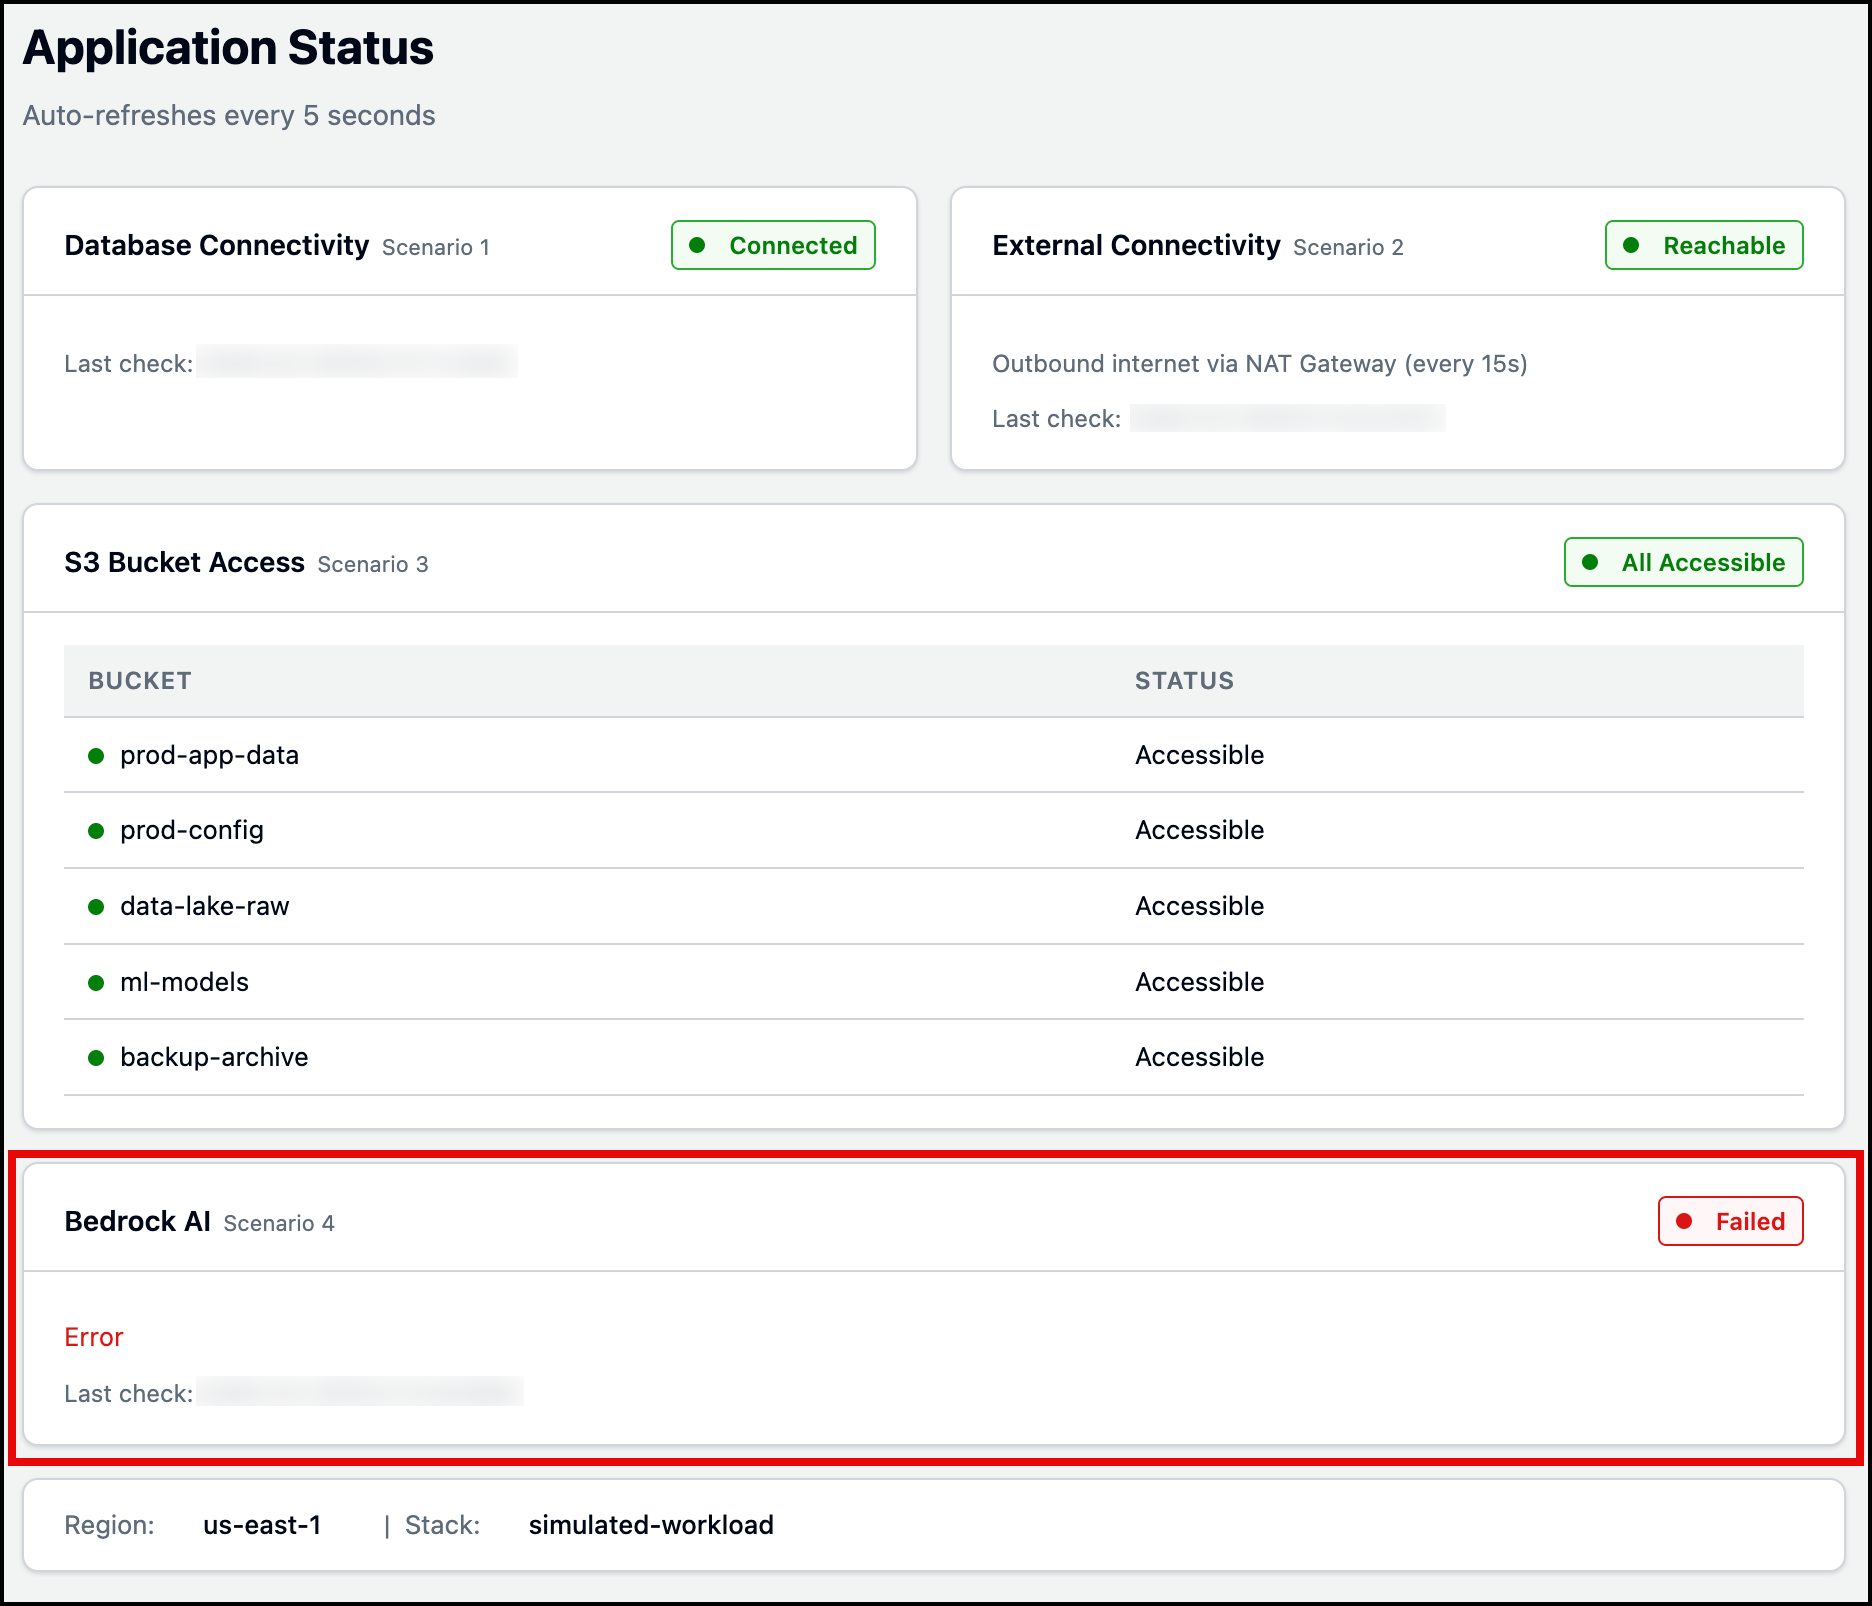 Figure 22: Simulated workload application status page
DevOps Agent receives the BedrockAccessFailures alarm and investigates:
- Checks endpoint configuration – Finds zero subnet associations on the Interface VPC Endpoint.
- Searches CloudTrail logs – Finds the
ModifyVpcEndpointAPI call, including who removed the subnet associations and when. - Maps resource relationships – Uses its topology to identify the EC2-to-Bedrock Interface VPC Endpoint dependency.
- Identifies root cause – Both subnet associations were removed from the Bedrock Runtime Interface VPC Endpoint, deleting the ENIs that handle traffic while the endpoint itself remained in an “Available” state.
Figures 23 and 24 display the investigation timeline and root cause tabs. After reviewing the root cause, you can generate a mitigation plan to see how to resolve the issue. Figure 25 shows the mitigation plan detailing the steps (AWS CLI Command) needed to restore the Bedrock Runtime Interface VPC Endpoint.
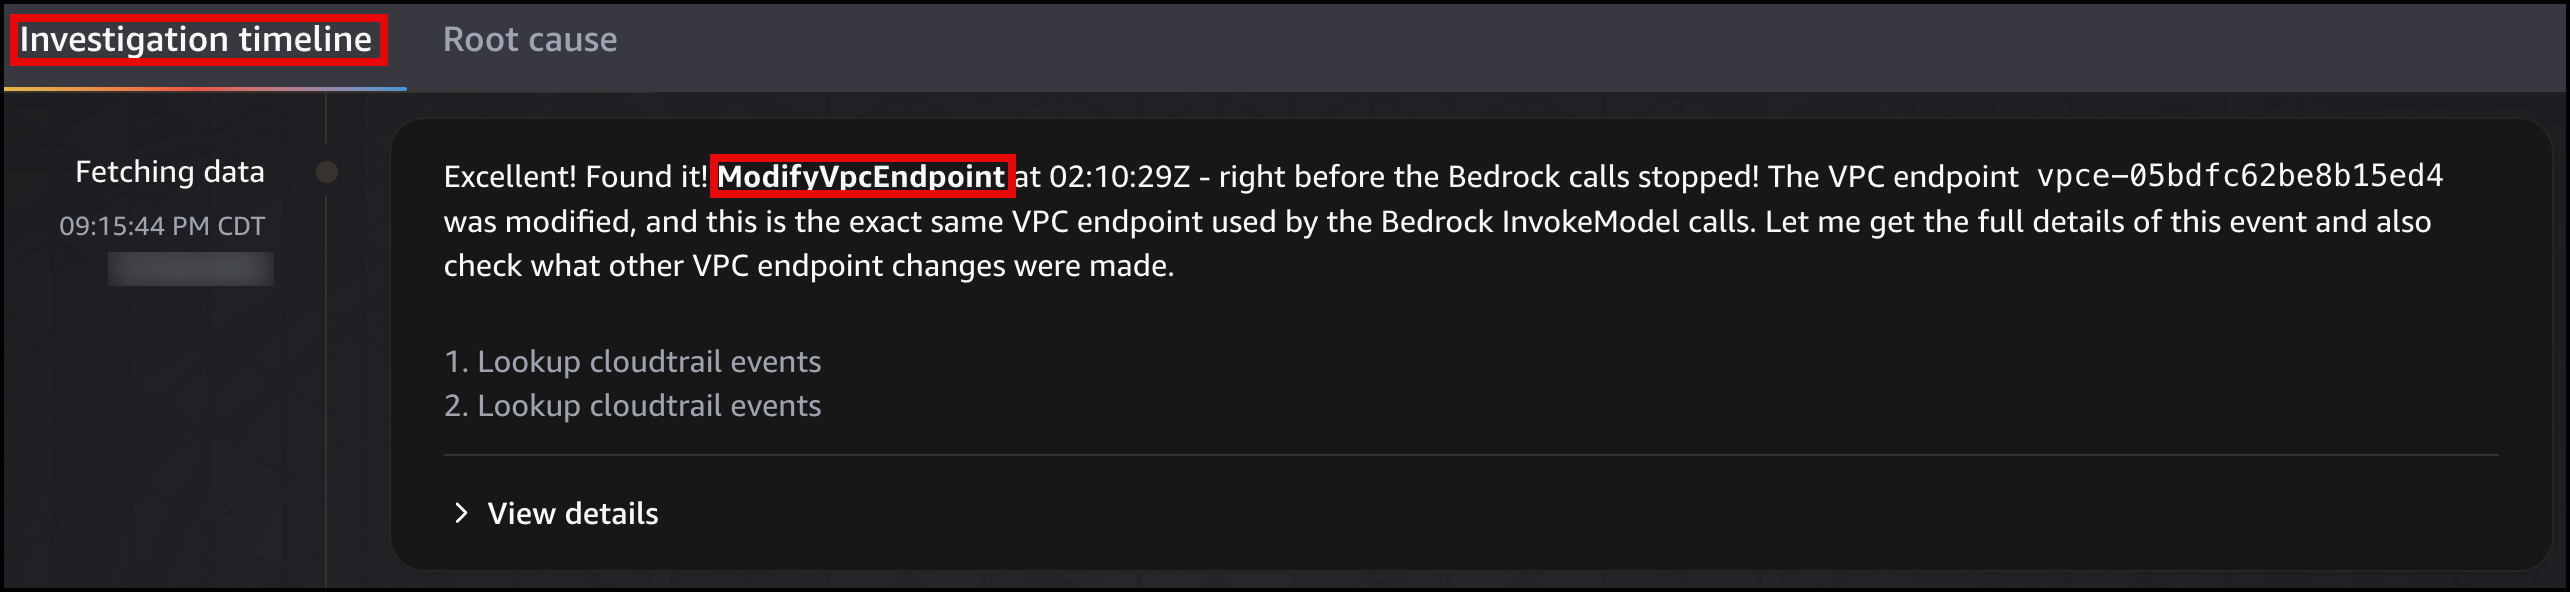 Figure 23: DevOps Agent investigation timeline
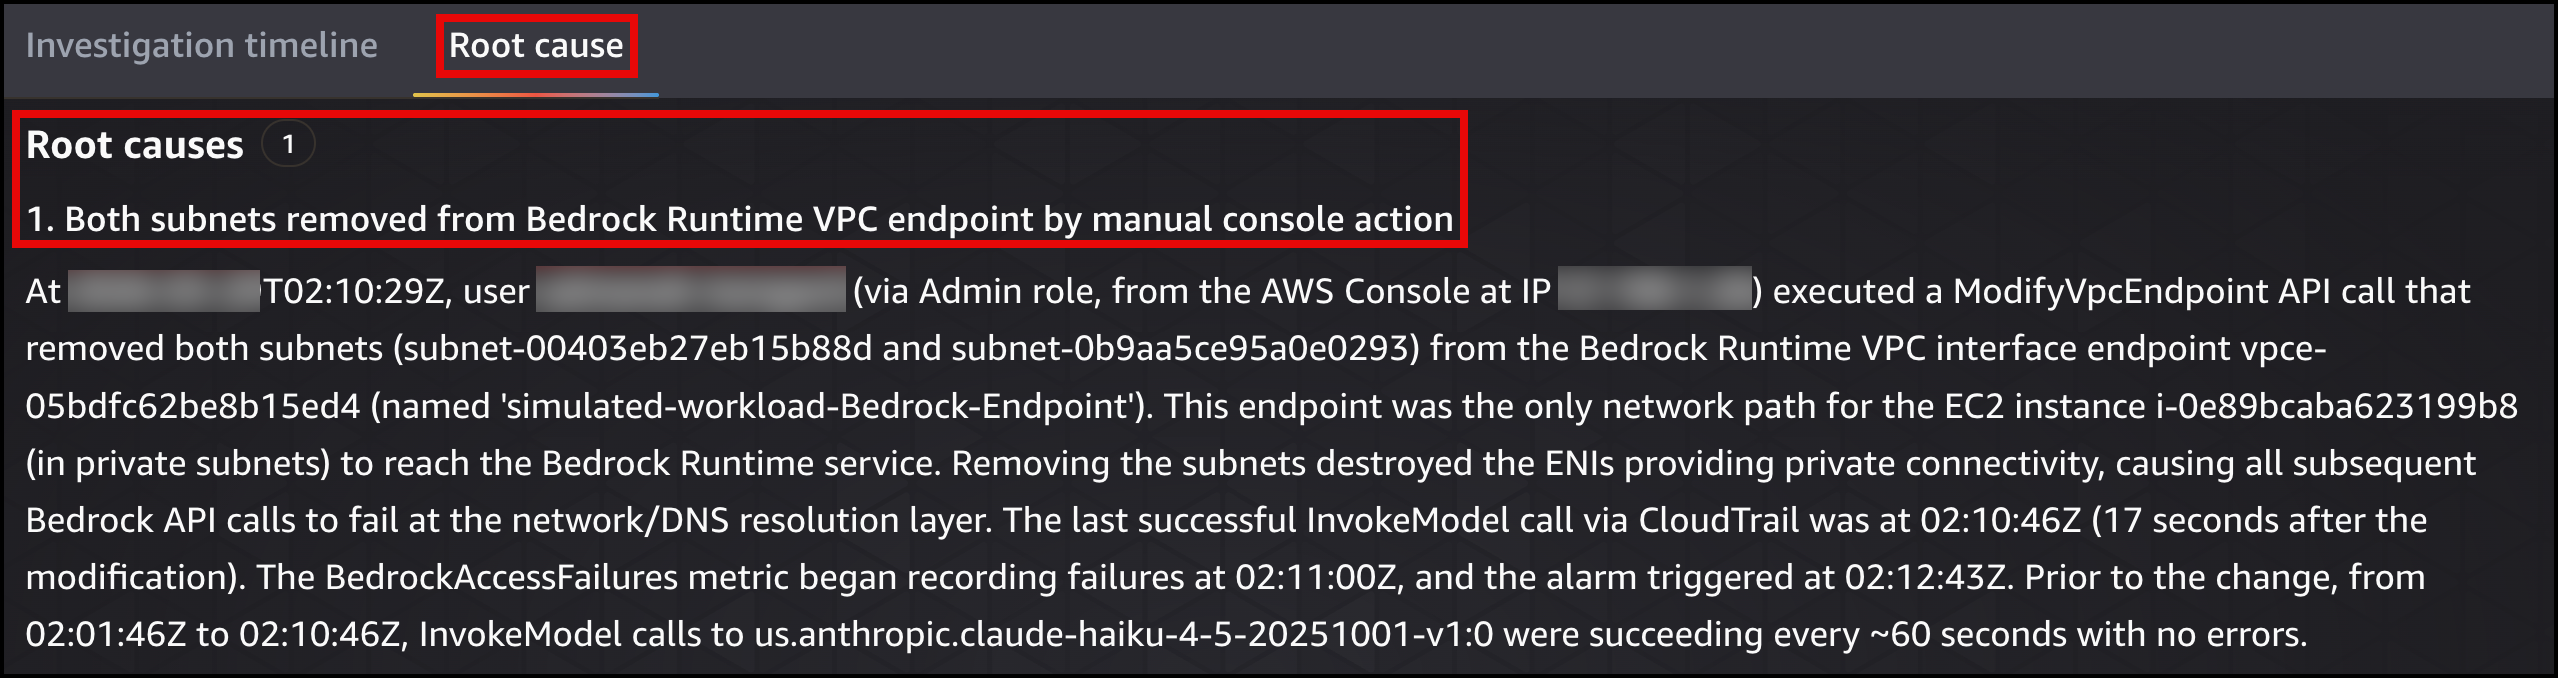 Figure 24: DevOps Agent root cause
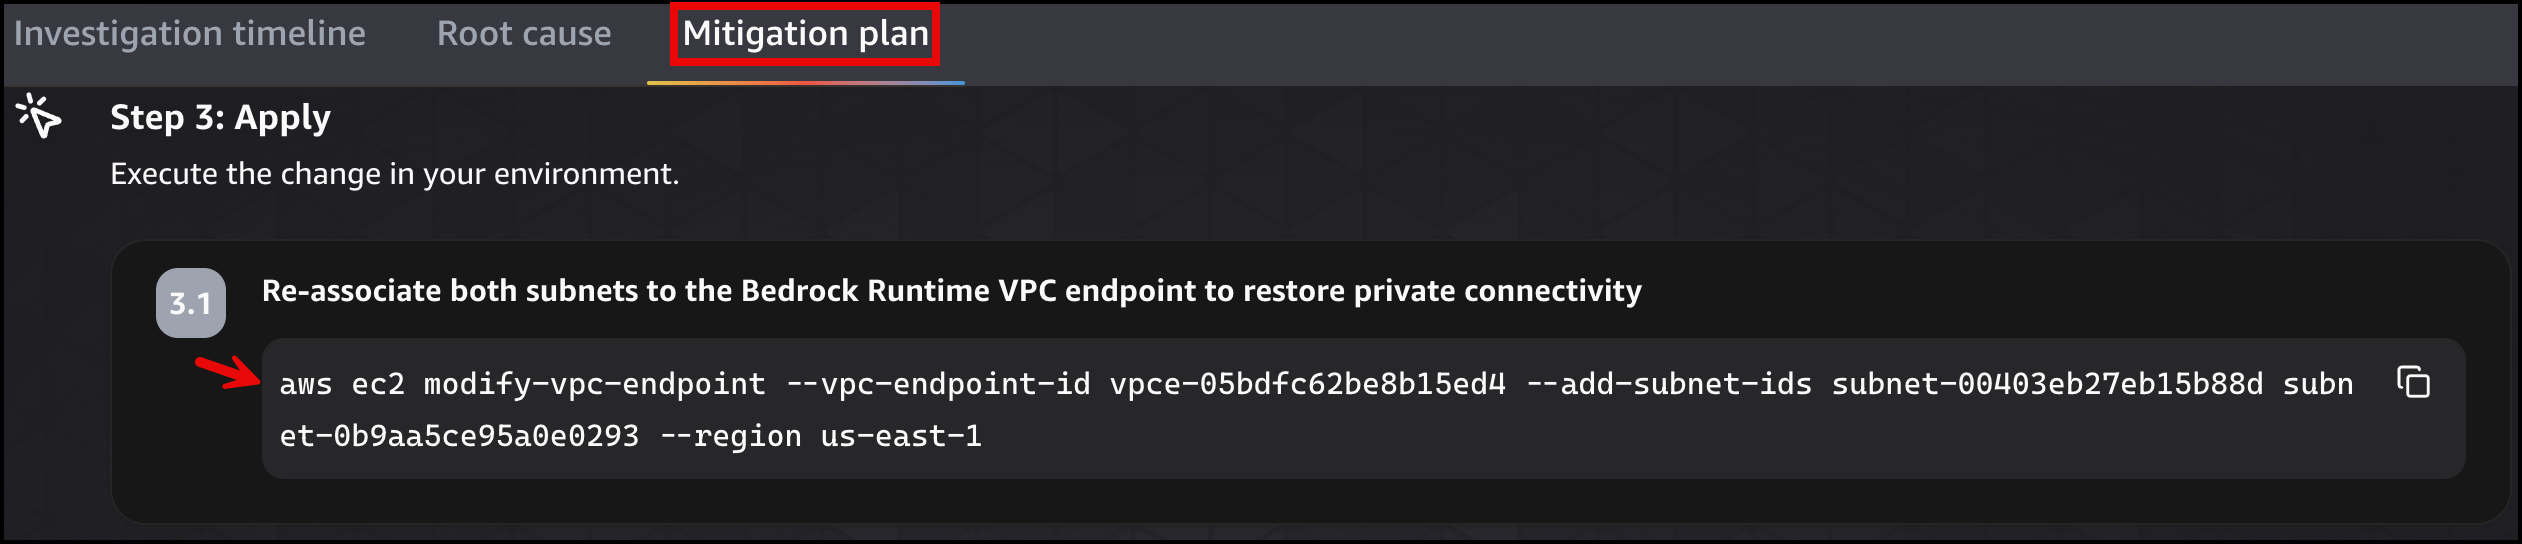 Figure 25: DevOps Agent migration plan
Once the fix is applied, the simulated workload application page will show the status as green Connected state for Bedrock AI.
Beyond the basics, complex networking scenarios
The four scenarios in this post cover foundational networking concepts, but real production environments are more complicated. Think back to the opening scenario: a payment service in Workload Account cannot reach a shared database in Shared Services Account after an AWS Transit Gateway route table association is swapped to the wrong table during a network migration, dropping all traffic between the two VPCs. The following diagram shows the configuration.
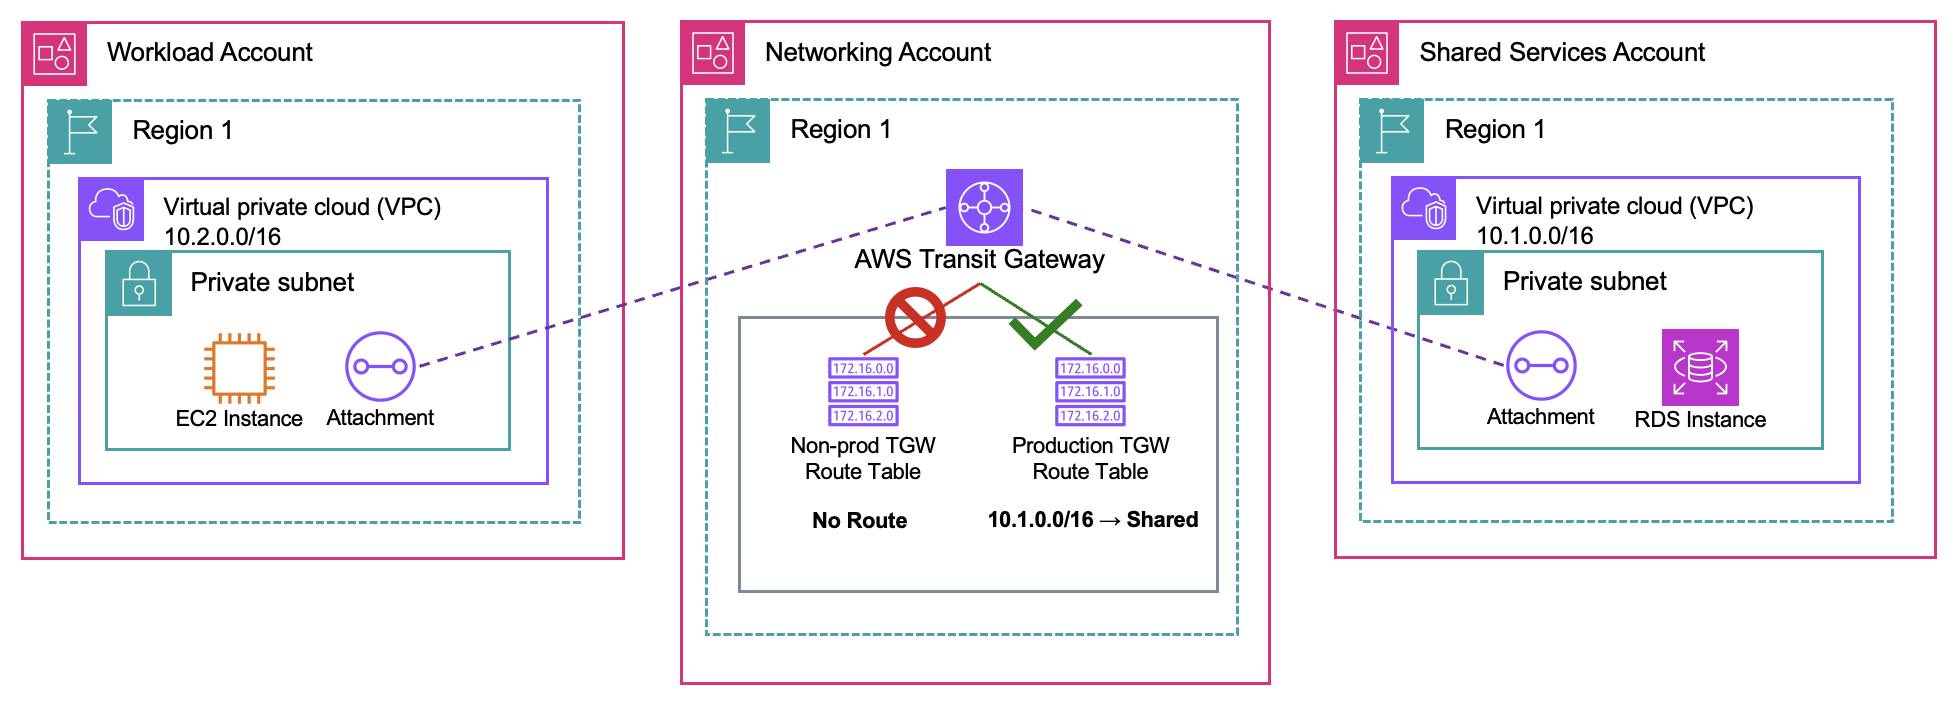 Figure 26: DevOps Agent multi-account scenario diagram
With multi-account access configured, DevOps Agent can retrieve operational data across multiple regions and accounts, investigating issues the same way it handles the four simpler cases. It maps the Transit Gateway topology across both accounts, checks the route table for associations and propagation state, and identifies which association is pointing at the wrong table. The mitigation plan tells you exactly which route table to re-associate and on which attachment.
Figures 27 display the root cause analysis identifying the incorrect Transit Gateway route table association across both accounts. Figure 28 shows the mitigation plan detailing the steps (AWS CLI command) needed to re-associate the correct route table to the attachment.
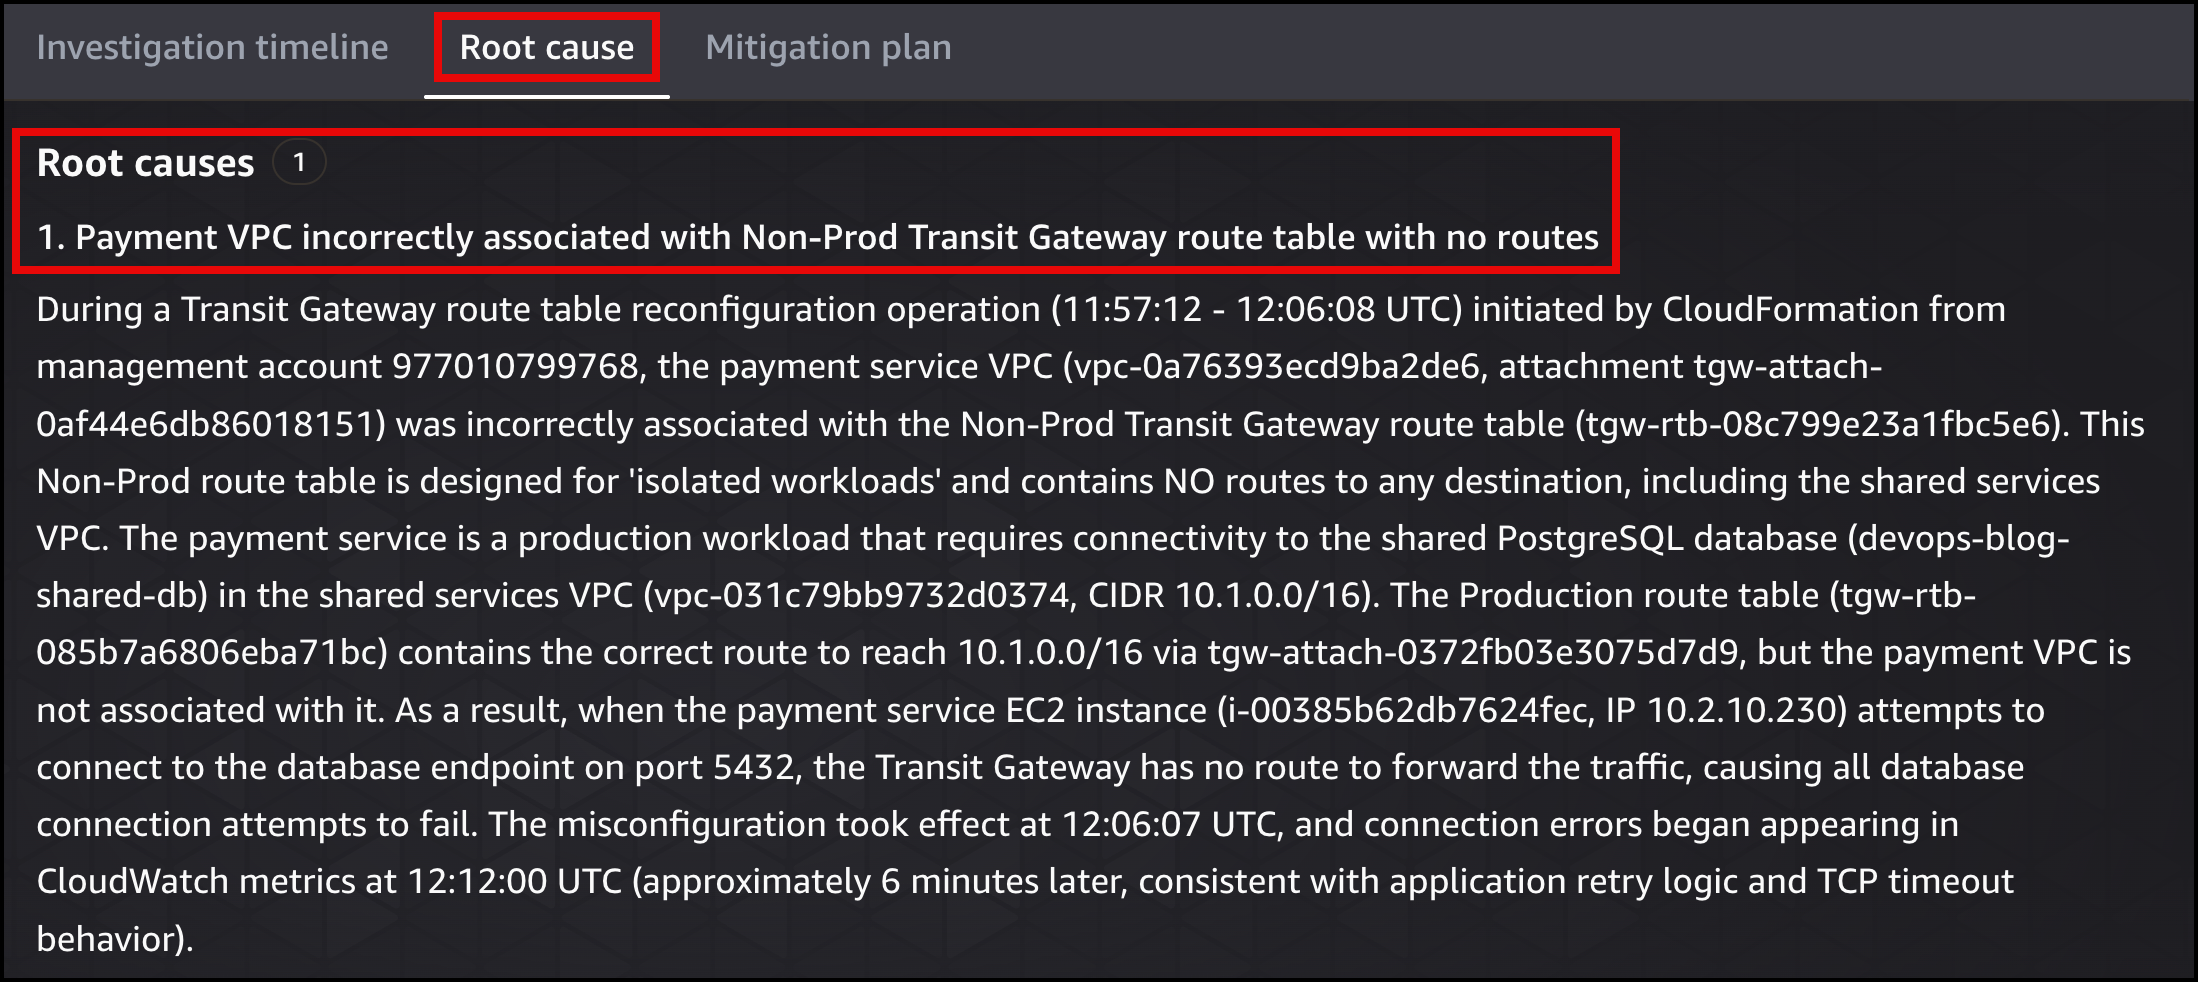 Figure 27: DevOps Agent root cause
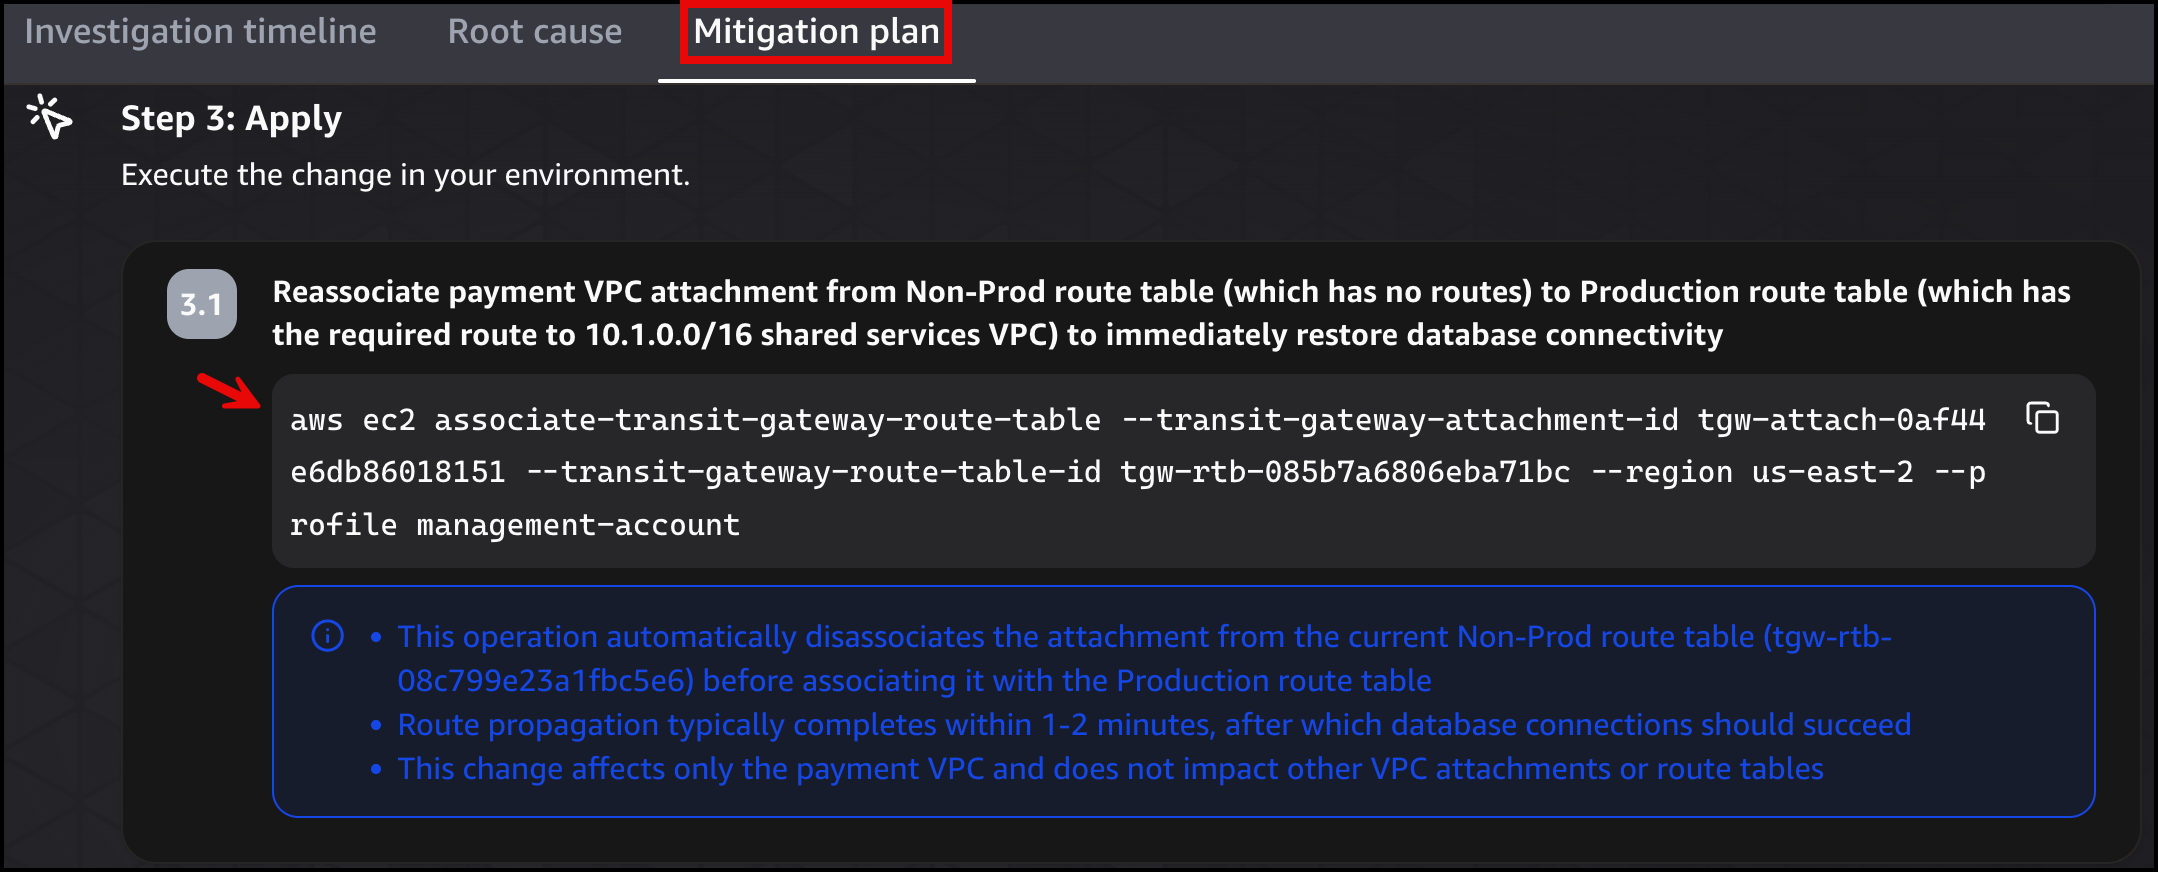 Figure 28: DevOps Agent migration plan
Further considerations
In production, a single infrastructure change can fire multiple alarms at once. For example, deleting a NAT Gateway route can trigger external connectivity, Amazon S3, and Amazon Bedrock alarms simultaneously if those services also depend on outbound access. Adding correlation logic in the AWS Lambda function (for example, buffering alarms in Amazon DynamoDB with a 60 second window and grouping by application) prevents duplicate investigations from piling up.
The Amazon SNS topic in this design has one subscriber (the webhook Lambda function), but you can add email, Amazon SQS, or HTTP subscribers without changing any alarm definition. If you already have CloudWatch alarms and an SNS topic powering your existing monitoring and alerting, you can add the webhook Lambda as an additional subscriber to that topic, giving DevOps Agent visibility without disrupting your current tooling. For multi-account environments, Amazon CloudWatch alarms in other accounts can publish directly to a central Amazon SNS topic, giving you a single pipeline into DevOps Agent.
It is worth reiterating that DevOps Agent produces a mitigation plan but does not make changes to your AWS environment on its own. Any remediation steps still require human action.
The third-party tools and data sources you connect during setup also apply during investigations:
- If you connect a telemetry source, DevOps Agent can pull metrics and traces as part of its root cause analysis.
- If you connect a CI/CD pipeline, it can correlate recent deployments with the failure timeline.
- If you configure MCP servers, you can expose internal APIs, runbook databases, or any custom data source over the Model Context Protocol. DevOps Agent calls those tools during an investigation when the data is relevant.
Cleanup
To remove all resources, follow deleting a stack. The stack deletion removes all resources including the VPC, subnets, route tables, security groups, endpoints, EC2 instance, RDS, ALB, SNS topic, Lambda function, and IAM roles.
Conclusion
This post walked you through four networking scenarios where AWS DevOps Agent automatically investigates failures and produces remediation plans, giving your team clear, actionable root cause analysis and ready-to-run fixes in minutes instead of hours of manual log correlation. Each scenario demonstrates a different troubleshooting pattern so you can apply the same approach to your own environment.
You saw how DevOps Agent correlates VPC Flow Logs with CloudTrail API changes to find deleted security group rules, maps route table configurations to identify missing NAT Gateway routes, compares multi-layer policies to isolate S3 Gateway Endpoint restrictions, and distinguishes between endpoint availability states to catch Interface Endpoint subnet removals. Beyond these foundational scenarios, DevOps Agent scales to complex environments with multi-account access, third-party observability integrations, and custom MCP servers.
Start automating your incident response today by following the Getting Started with AWS DevOps Agent guide.
About the authors

Salman Ahmed
Salman is a Senior Technical Account Manager at AWS. He specializes in guiding customers through the design, implementation, and support of AWS solutions. Combining his networking expertise with a drive to explore new technologies, he helps organizations successfully navigate their cloud journey. Outside of work, he enjoys photography, traveling, and watching his favorite sports teams.

Ankush Goyal
Ankush is a Senior Technical Account Manager at AWS Enterprise Support, specializing in helping customers in the travel and hospitality industries optimize their cloud infrastructure. With over 20 years of IT experience, he focuses on leveraging AWS networking services to drive operational efficiency and cloud adoption. Ankush is passionate about delivering impactful solutions and enabling clients to streamline their cloud operations.