Networking & Content Delivery
Reduce unexpected AWS costs: Tracing AWS billing charges with log correlation techniques
Imagine receiving an unexpected $1,200 Data Transfer Out (DTO) charge on your Amazon Web Services (AWS) bill. You know something generated significant outbound traffic, but you’re left wondering: which resource caused it? Where was the data sent? Was it legitimate application traffic or a security incident?
This common challenge faces FinOps professionals, DevOps engineers, and security analysts who need to trace billing line items to their root causes. Although AWS bills show what you’re charged for, connecting those charges to specific resource activities necessitates correlating information across different services such as VPC Flow Logs and Amazon Route 53 DNS Query Logging.
In this post, we demonstrate a systematic four-step methodology to investigate any AWS billing line item using AWS Data Exports (Cost and Usage Reports 2.0) along with VPC Flow Logs and Route 53 DNS Query Logging. Furthermore, we demonstrate how to trace charges from billing reports to specific resource activities through multi-service log correlation, enabling you to identify cost optimization opportunities, eliminate billing surprises, and confidently distinguish between legitimate application traffic and potential security incidents.
Prerequisites
Before starting your investigation, you need to have configured the following logging sources:
- AWS Data Exports (CUR 2.0):
- Used for detailed billing data analysis.
- Learn how to create Cost and Usage Reports and query them using Amazon Athena.
- VPC Flow Logs:
- Used for network traffic analysis.
- Learn how to publish VPC Flow Logs to Amazon CloudWatchand Amazon Simple Storage Service (Amazon S3). For detailed instructions, see Publishing flow logs to CloudWatch Logsand Publishing flow logs to Amazon S3.
- Route 53 Resolver Query Logging:
- Used for domain resolution correlation.
- Learn how to manage Resolver query logging configurations. Your VPC must use the Amazon-provided DNS server (Route 53 Resolver) for query logging to capture DNS requests. Reference DNS attributes for your VPC.
- Athena:
- Used for querying your data sources.
- Learn how to use Athena for querying data sources.
When these logging sources configured, you can implement the systematic investigation approach.
Overview of the billing investigation solution
The following figure shows the systematic investigation flow that transforms billing questions into actionable insights.
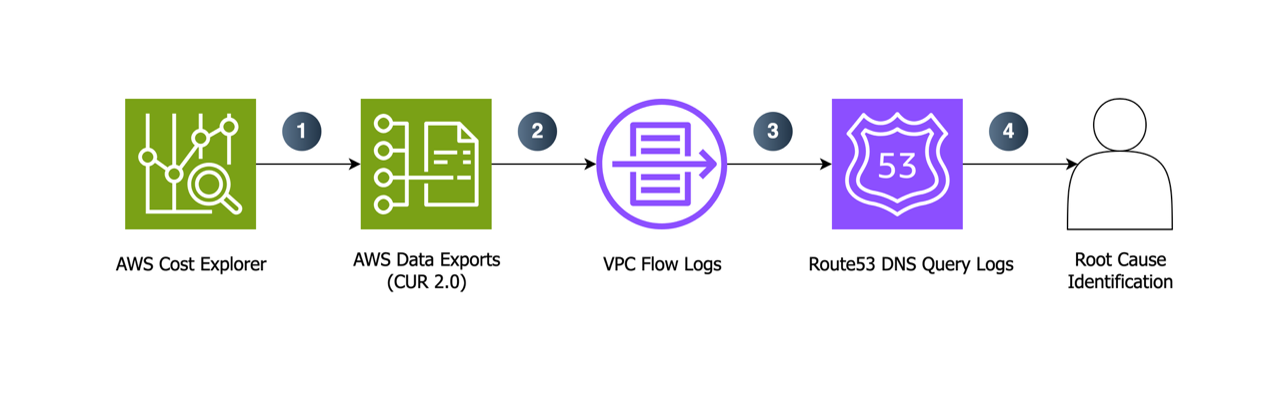
Figure 1: Systematic billing investigation using multi-source log correlation
Figure 1 shows the four-step investigation methodology:
Step 1: AWS Data Exports (CUR 2.0) analysis identifies the specific resources and usage types contributing to billing line items, providing detailed attribution beyond what appears in the AWS bill or AWS Cost Explorer.
Step 2: VPC Flow Logs correlation reveals network activity patterns, data transfer volumes, and communication flows for the identified resources.
Step 3: Route 53 DNS Query Logging uncovers external destinations, domain resolution patterns, and traffic routing that may explain resource behavior.
Step 4: Root cause identification synthesizes findings from all log sources to determine exactly what application behaviors or infrastructure configurations generated the charges.
This approach moves beyond cost reporting to provide operational context for billing line items. Rather than merely seeing charges for specific usage types, you gain visibility into which resources generated those charges, what network activity occurred, and what external services or destinations were involved. The methodology applies to any AWS service that generates network traffic or processes data, making it valuable for investigating charges across compute, storage, database, and networking services.
The following walkthrough demonstrates this methodology using a real Data Transfer Out investigation.
Implementing the investigation methodology
This section guides you through a complete 4-step process using a real-world Data Transfer Out investigation—the most common billing inquiry that AWS practitioners’ encounter. We demonstrate how to trace a specific DTO charge from your bill to the exact resource activity that generated it.
Step 1. Analyze AWS Data Exports for charge attribution
AWS Data Exports (CUR 2.0) provides the most detailed view of your AWS usage and charges, offering far more detail than what appears in the AWS bill or AWS Cost Explorer. This step identifies the specific resources, usage types, and time periods contributing to the billing line item under investigation.
Query AWS Data Exports for resource attribution:
Using Athena to query your CUR data stored in Amazon S3, identify which specific resources generated the Data Transfer Out charges:
SELECT
    line_item_resource_id,
    line_item_usage_type,
    line_item_usage_amount,
    line_item_unblended_cost,
    resource_tags
FROM cur_database.cur_clean
WHERE line_item_usage_type LIKE '%DataTransfer-Out%'
    AND CAST(line_item_unblended_cost AS DOUBLE) > 0
ORDER BY CAST(line_item_unblended_cost AS DOUBLE) DESC
LIMIT 10;
Example output:
| line_item_resource_id | line_item_usage_type | line_item_usage_amount (GB) | line_item_unblended_cost ($) | resource_tags |
|---|---|---|---|---|
| i-1234567890abcdef0 | APS1-DataTransfer-Out-Bytes | 6,240.00 | 580.15 | {“Name”:”web-server-prod”} |
| i-0987654321fedcba0 | APS1-DataTransfer-Out-Bytes | 2,116.50 | 154.39 | {“Name”:”api-server-staging”} |
| i-0abcdef1234567890 | APS1-DataTransfer-Out-Bytes | 1,883.50 | 139.68 | {“Name”:”batch-processor”} |
This analysis shows that Amazon Elastic Compute Cloud (Amazon EC2) instance i-1234567890abcdef0 (tagged as “web-server-prod”) generated the largest portion of your Data Transfer Out charges, transferring 6,240 GB. This represents the top contributor among multiple resources generating DTO charges. To proceed, you need to identify the private IP address of this instance to correlate with VPC Flow Logs data.
Step 2. Correlate network activity using VPC Flow Logs
VPC Flow Logs provide detailed network activity data that correlates with the resource IDs identified in Step 1. This step reveals the actual network flows, data volumes, and communication patterns that generated your billing charges.
Query VPC Flow Logs for the identified resource:
Using the resource ID from Step 1, query your VPC Flow Logs to identify network activity patterns. From the CUR analysis, you identified that EC2 instance i-1234567890abcdef0 generated the charges. First, obtain the private IP address of this instance (you can find this in the or through AWS Command Line Interface (AWS CLI). In this example, it’s 10.0.1.15.
In this example, we are searching for the external destinations that instance i-1234567890abcdef0 communicated with in July 2025, focusing only on high-volume transfers. We exclude internal VPC traffic (using NOT LIKE for VPC CIDR ranges) to identify only internet-bound traffic that generates Data Transfer Out charges. Depending on your VPC Flow Logs destination, you can use either CloudWatch Logs Insights or Athena. CloudWatch Logs Insights queries incur charges based on the amount of data that is queried, regardless of query language. For more information, visit the CloudWatch Pricing.
Option A: CloudWatch Logs Insights (for logs stored in CloudWatch Logs):
fields @timestamp, srcaddr, dstaddr, srcport, dstport, protocol, bytes, packets, action
| filter @timestamp >= "2025-07-01T00:00:00.000Z" and @timestamp < "2025-08-01T00:00:00.000Z"
| filter srcaddr = "10.0.1.15"
| filter not (dstaddr like /^10\.0\./)
| filter action = "ACCEPT"
| filter bytes > 1000000
| sort bytes desc
| limit 20
Option B: Athena (for logs stored in Amazon S3):
SELECT
    srcaddr,
    dstaddr,
    srcport,
    dstport,
    protocol,
    bytes,
    packets,
    action
FROM your_vpc_flow_logs_table
WHERE srcaddr = '10.0.1.15'
    AND NOT (dstaddr LIKE '10.0.%')
    AND year = '2025' AND month = '07'
    AND action = 'ACCEPT'
    AND bytes > 1000000
ORDER BY bytes DESC;
Example output:
| @timestamp | srcaddr | dstaddr | srcport | dstport | protocol | bytes | packets | action |
|---|---|---|---|---|---|---|---|---|
| 2025-07-15 14:23:15.000 | 10.0.1.15 | 203.0.113.10 | 45123 | 443 | 6 | 3145728000 | 2187500 | ACCEPT |
| 2025-07-15 14:25:30.000 | 10.0.1.15 | 203.0.113.20 | 45124 | 443 | 6 | 2684354560 | 1865800 | ACCEPT |
| 2025-07-15 14:28:45.000 | 10.0.1.15 | 203.0.113.30 | 45125 | 443 | 6 | 2576980377 | 1789514 | ACCEPT |
The Flow Logs show your instance transferred significant data to external IP addresses on port 443 (HTTPS). The destination IPs 203.0.113.10, 203.0.113.20, and 203.0.113.30 are outside your VPC, which explains the Data Transfer Out charges. But what services do these IPs represent? In the next step, we’ll use Route 53 DNS Query Logs to identify the exact domains and services behind these IP addresses.
Step 3. Identify traffic destinations with Route 53 DNS Query Logs
Route 53 DNS Query Logs reveal the domain names that resolve to the external IP addresses discovered in VPC Flow Logs. This step helps identify which external services or destinations are generating your network traffic by correlating the destination IPs from Step 2 with their corresponding domain names.
Query DNS logs to correlate external IPs with domain names:
Using the external destination IP addresses identified in Step 2 (203.0.113.10, 203.0.113.20, 203.0.113.30), query your DNS logs to discover which domain names resolve to these IPs. Route 53 DNS logs store data as JSON within the @message field, thus you must parse the JSON to extract the query_name (domain) and rdata (resolved IP) fields before filtering for specific IP addresses.
Depending on your Route 53 Resolver query logging destination, you can use either CloudWatch Logs Insights or Athena (be aware of the associated costs with both services):
Option A: CloudWatch Logs Insights (for logs stored in CloudWatch Logs):
fields @timestamp, @message
| parse @message /"query_name":"(?<query_name>[^"]+)"/
| parse @message /"rcode":"(?<rcode>[^"]+)"/
| parse @message /"Rdata":"(?<rdata>[^"]+)"/
| filter rcode = "NOERROR"
| filter rdata = "203.0.113.10" or rdata = "203.0.113.20" or rdata = "203.0.113.30"
| stats count() by query_name, rdata
| sort count desc
Option B: Athena (for logs stored in Amazon S3):
SELECT
    query_name,
    answer.rdata as rdata,
    COUNT(*) as resolution_count
FROM your_resolver_query_logs_table
CROSS JOIN UNNEST(answers) AS t(answer)
WHERE (answer.rdata = '203.0.113.10'
       OR answer.rdata = '203.0.113.20'
       OR answer.rdata = '203.0.113.30')
    AND rcode = 'NOERROR'
GROUP BY query_name, answer.rdata
ORDER BY resolution_count DESC;
Example output:
| query_name | rdata | resolution_count |
|---|---|---|
| amazon.in | 203.0.113.10 | 847 |
| primevideo.com | 203.0.113.20 | 623 |
| s3.ap-south-1.amazonaws.com | 203.0.113.30 | 445 |
This approach directly correlates the external destination IPs from your VPC Flow Logs with their corresponding domain names, showing you exactly which services or domains your traffic is reaching. The DNS query logs provide the crucial link between network activity and business context.
For more information about CloudWatch Logs Insights query syntax and more examples, see CloudWatch Logs Insights query syntax and Analyzing log data with CloudWatch Logs Insights in the AWS documentation.
Step 4. Root cause analysis and actionable insights
Combining data from all three sources, we can construct a comprehensive understanding of the billing charges:
Investigation results:
- Source: EC2 instance i-1234567890abcdef0 (web-server-prod)
- Root cause: Application making frequent HTTPS calls to external AWS services
- Traffic pattern: High-volume data transfers to amazon.in, primevideo.com, and Amazon S3 storage
- Business impact: Legitimate application traffic generating unexpected transfer costs
Actionable insights:
- Cost optimization:
- Deploy VPC Endpoints:
- S3 Gateway Endpoint: Eliminates Amazon S3 transfer charges with no added cost.
- Interface Endpoints: Reduce remaining transfer charges but incur hourly endpoint fees ($0.01 per hour per AWS Availability Zone (AZ) plus data processing charges).
- Decision Point: Calculate whether endpoint costs are less than current transfer charges using the AWS Pricing Calculator.
- Deploy VPC Endpoints:
- Monitoring:
- CloudWatch-based cost control:
- Baseline monitoring: Use CloudWatch Metrics to track normal transfer patterns through the NetworkOut metric for EC2 instances.
- CloudWatch Alarms: Configure alarms when daily NetworkOut exceeds baseline thresholds (for example 3 times the normal volume) with Amazon Simple Notification Service (Amazon SNS) Visit the Creating CloudWatch alarms documentation for setup steps.
- CloudWatch-based cost control:
- Cost control:
- Evaluate whether all external AWS service integrations are necessary.
- Identify opportunities for optimization.
This methodology transformed a generic “Data Transfer Out charges” into specific operational insights. The production web server’s communications with AWS services generated the charges through content delivery, streaming, and Amazon S3 storage interactions. This presents immediate cost optimization opportunities through VPC endpoints.
Remember to clean up any resources to manage ongoing costs.
Considerations
This investigation methodology uses existing AWS logging services and doesn’t need more resources. However, to manage ongoing costs, consider the following:
- AWS Data Exports:
- Monitor storage costs in Amazon S3 for your CUR data.
- Configure lifecycle policies to archive or delete older reports based on retention requirements.
- VPC Flow Logs:
- Monitor Amazon S3 storage costs for flow log data.
- Configure Amazon S3 lifecycle policies to transition older logs to more cost-effective storage classes or delete them after the necessary retention period.
- Route53 Resolver Query Logs: Costs vary by destination type.
- CloudWatch Logs:
- Charges apply for log storage and ingestion.
- Set appropriate log retention periods based on investigation needs.
- Amazon S3:
- More cost-effective for long-term storage.
- Configure lifecycle policies to optimize storage costs.
- Athena queries:
- Charges are based on the amount of data scanned by queries.
- Use partitioning and column selection to minimize costs.
For detailed pricing information, refer to the AWS Pricing Calculator.
Conclusion
Investigating AWS billing line items doesn’t have to be a mystery. You can systematically correlate AWS Data Exports (CUR 2.0) with VPC Flow Logs and Amazon Route53 DNS Query Logging to trace any charge from your bill to the specific resource activities that generated it.
The four-step methodology we’ve demonstrated transforms billing questions into operational insights. This systematic approach applies to investigating various scenarios, including NAT Gateway processing costs, AWS Lambda invocation spikes, Amazon S3 request patterns, Amazon Relational Database Service (Amazon RDS) data transfer charges, and any AWS service that generates network traffic or processes data.
This methodology provides more than cost attribution—it gives you operational visibility into how your AWS resources interact with external services, what traffic patterns drive your charges, and where optimization opportunities exist. You move from reactive billing investigation to proactive resource understanding, empowering you to prevent unexpected charges, optimize costs continuously, and maintain control over your AWS spending.
Begin applying this methodology to your own billing investigations. The next time you encounter a charge that needs investigation, you’ll have a systematic approach to find answers rather than rely on assumptions.
For further reading, you can refer to the following resources:
- Understand AWS data transfer details in-depth from Cost and Usage Report using Athena query and QuickSight
- Create your own granular cost dimension using AWS Cost Categories and Amazon Athena
- Visualize and gain insights into your VPC with Amazon Q in Amazon QuickSight
- Unlock AWS cost and usage insights with generative AI powered by Amazon Bedrock
- AWS costs estimation using Amazon Q CLI and AWS cost analysis MCP
About the author

Prabhu G is a Solutions Architect at AWS. He helps customers securely build, innovate, and scale their cloud environments. With more than 12 years of networking and security expertise, he collaborates to create robust AWS network architectures. He enjoys watching Formula 1, especially cheering for Lewis Hamilton, and in his free time builds prototypes using Kiro.