AWS Public Sector Blog
How HOT uses open source on AWS to power humanitarian AI
When disasters strike, the first thing responders need is an accurate map. But for much of the world, detailed maps don’t exist. Humanitarian OpenStreetMap Team (HOT) has been fulfilling that need since 2010. Today, HOT is a global network of over 500,000 contributors across 94 countries. By combining local ground-truth mapping, regional hubs, and open source tools, HOT coordinates massive, crowdsourced efforts to provide immediate data to responders without licensing costs or procurement barriers.
However, manually tracing satellite imagery is slow when time is critical. To accelerate mapping, HOT developed fAIr, an open source, AI-assisted tool that detects geographic features for human verification, giving volunteers a head start. This post explores the architecture behind fAIr, which HOT built on Amazon Web Services (AWS) with a tech stack composed almost entirely of open source tools, bridging open source innovation and cloud infrastructure to scale community impact.
How fAIr works
A mapper traditionally opens a satellite image tile and manually traces every visible building footprint. This is a time-consuming process that keeps mappers from building a complete, accurate map of the disaster area in time for responders.
With fAIr, the mapper opens the same tile and sees predrawn polygons already overlaid. Their job shifts away from having to trace everything manually. Instead, mappers review, correct, and approve the work created by the AI tool. Users can also fine-tune per region because the models are localized to that specific area.
The following image shows AI-generated building footprint predictions (the purple polygons) overlaid on drone imagery using the YOLO_V8_V2 model. Mappers can review the image, correct any mistakes, and approve each prediction rather than tracing from scratch. For a demo of the process, visit the fAIr Learn page.
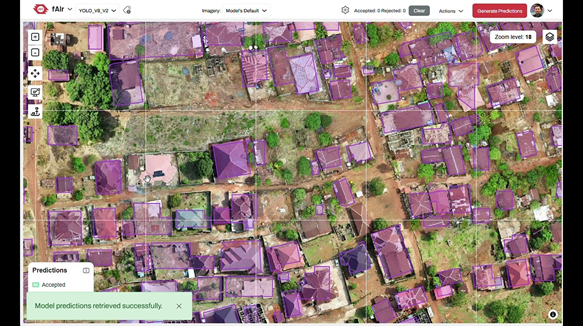 Figure 1: Drone image overlaid with building footprint predictions
Technical architecture
This section walks through fAIr’s architecture in three parts: where data is stored, how models get trained, and how predictions get served. Each layer pairs AWS infrastructure with open source tooling for the job.
Amazon Simple Storage Service (Amazon S3) serves as the central artifact and model repository for low-cost storage. PostgreSQL databases, managed by the CloudNativePG operator, handle runtime metadata and the SpatioTemporal Asset Catalog (STAC) database, which serves as the registry for GeoAI models.
The ZenML MLOps framework on Amazon Elastic Kubernetes Service (Amazon EKS) orchestrates training, provisioning ephemeral NVIDIA GPU instances using Karpenter only when jobs are requested. This scale-to-zero approach eliminates GPU costs when training is inactive. Upon completion, ZenML updates the artifact store and registers the new model into the STAC API and streams metrics to MLflow.
To secure low-latency performance, inference is decoupled from training using Knative for serverless workload management. The system uses CPU-based scaling on Amazon Elastic Compute Cloud (Amazon EC2) instances to run the models, eliminating the need for permanently running GPU infrastructure while responding to client requests quickly with predicted features.
The entire system architecture is provisioned with Helm Charts and deployed using ArgoCD. This infrastructure as code (IaC) approach keeps environments consistent, making staging-to-production transitions seamless and reproducible.
The following diagram shows the fAIr architecture. For more information, visit the fAIr mapping tool repo on GitHub.
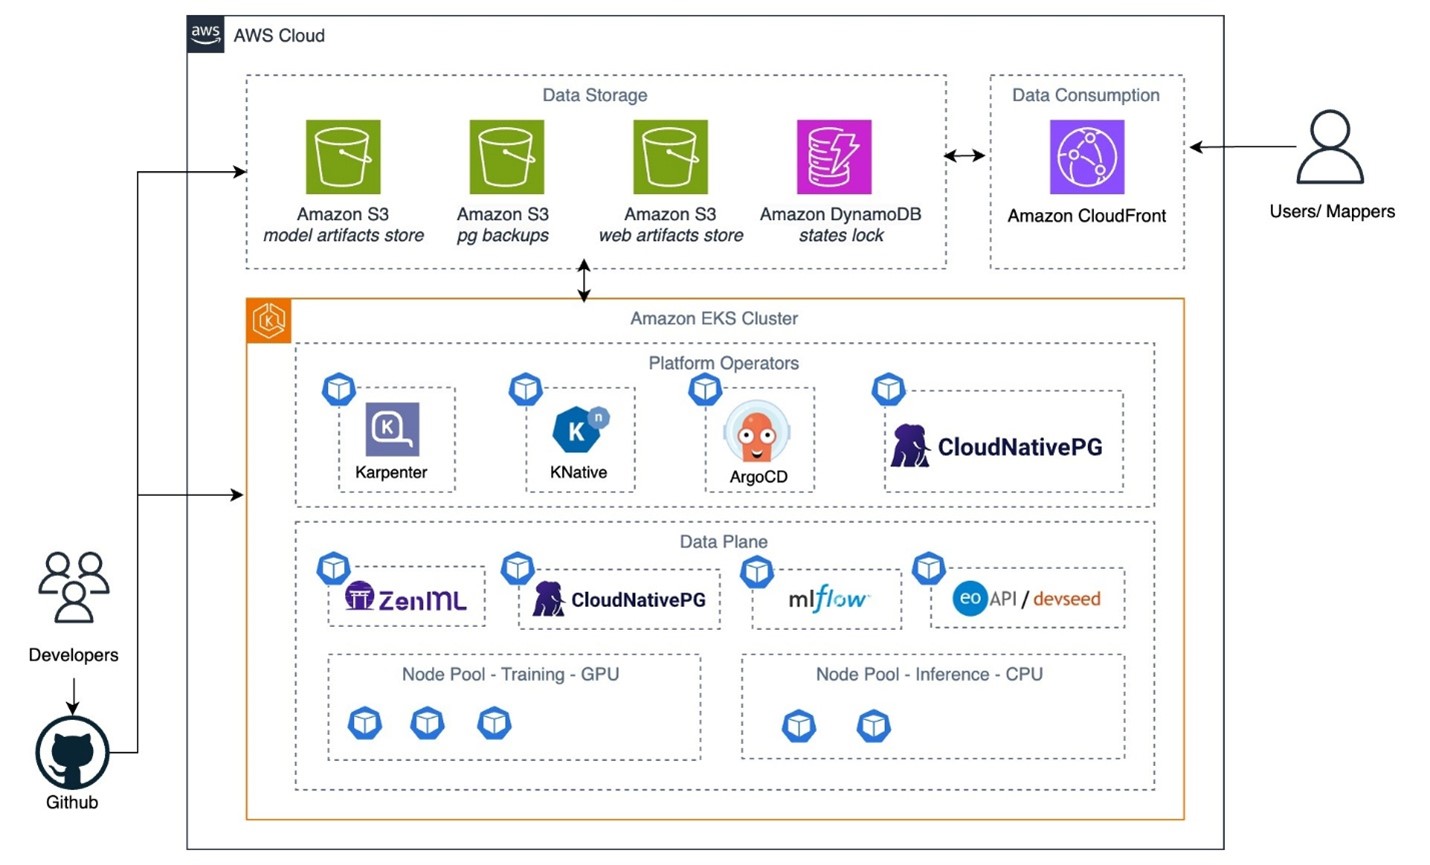
Figure 2: fAIr technical architecture
Community impact
In addition to producing data quickly, HOT’s open source mapping ecosystem changes how communities prepare for, respond to, and recover from crises. The following examples show how these tools translate into real-world outcomes.
How fAIr was used in the Venezuela response
Most recently, an area outside of Caracas, Venezuela, was impacted by earthquakes on June 24, 2026. As part of the response, HOT activated to bring high-quality, up-to-date data to communities working on the ground for recovery efforts, coordinating with the United Nations’ International Organization for Migration (IOM), MapAction, iMMAP, and GiveDirectly. Through Vantor’s Open Data Program, recent high-resolution satellite imagery was made open source, and the HOT team immediately began running the imagery through fAIr to generate an initial picture of the damage to affected communities. Within 24 hours of the event, fAIr outputs were delivered to key early responders, providing data on building density, AI-assisted building digitization, and building damage predictions.
HOT didn’t release raw AI predictions as final data. The team merged outputs from fAIr and the Microsoft AI For Good Lab, then used the open source tool MapSwipe to crowdsource human validation of every prediction. The first batch of human-validated damage assessment was completed for three cities, Caraballeda, La Guaira, and Caracas, representing the most complete validated dataset produced for this event. In parallel, 451 volunteer mappers digitized approximately 53,000 buildings through the HOT Tasking Manager in less than a week.
The following image shows the fAIr building density estimation for northern Venezuela. The darker hexagons indicate higher concentrations of buildings, helping responders prioritize search and rescue operations.
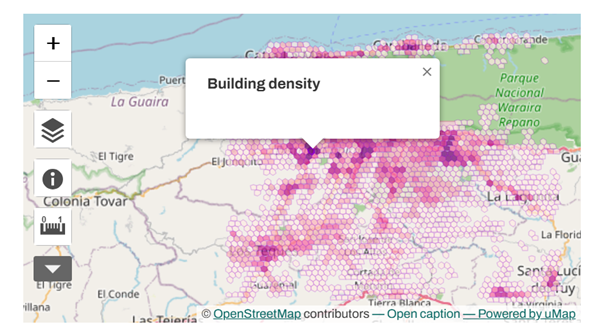 Figure 3: fAIr building density estimation for northern Venezuela
The following screenshot shows a fAIr damage assessment model predicting different levels of damage in Catia La Mar, Venezuela, based on pre- and post-event imagery.
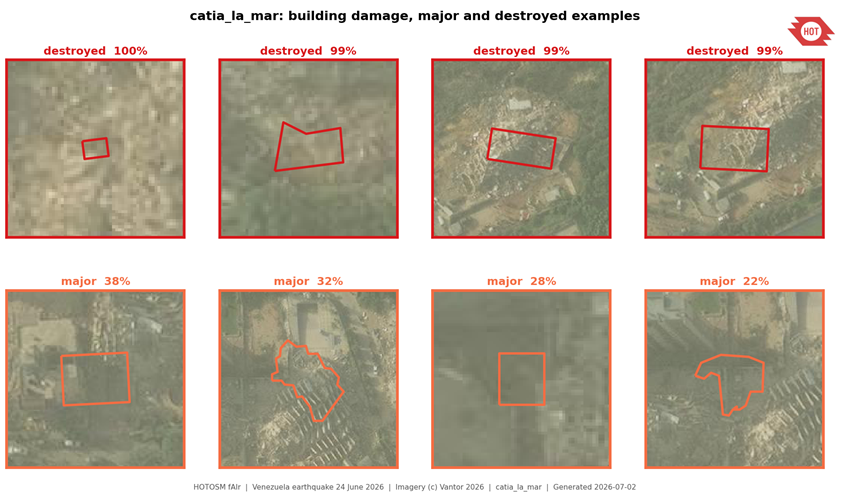 Figure 4: fAIr damage assessment model predicting different levels of damage based on pre- and post-event imagery. Source: Kshitij Sharma
Mapping for Climate Ready Cities: Sierra Leone
Across Bangladesh and 12 other countries, the Mapping for Climate Ready Cities program puts mapping tools in the hands of communities documenting transit networks, drainage infrastructure, and accessibility gaps. This data feeds into resilience planning such as evacuation plans for at least 80 households in Timor-Leste; drainage upgrades in Nakuru, Kenya, which have benefitted over 10,000 residents; clearer directions for investment in heat-resilient public spaces for the 60,000 residents of Maipú, Chile; and the potential to protect over 3.5 million people in Nigeria’s growing cities through air-quality monitoring.
In Freetown, Sierra Leone, the program focuses on heat resilience. Working with local organizations including Convention for a Democratic South Africa (CODESA), the Federation of Informal Settlements (FODU), and OSM Sierra Leone, the team trains university students and community members to capture drone imagery, digitize features using fAIr, and collect ground-truth data using Field Tasking Manager. From approximately 550 square kilometers of drone imagery, the team digitized all visible features and shared them with the Freetown City Council (FCC).
fAIr identifies trees and solar panels from aerial imagery, helping planners understand where shade and cooling exist. “We have more time to go to the field for data collection because we spent less time on digitalization,” says Lamine N’Diaye, project coordinator at HOT in Sierra Leone. The data has already influenced policy where the FCC used it to build a new taxation plan for marketplace areas, and the same dataset supports emergency access planning. Before HOT’s tools arrived, communities had the will to adapt but not the means. “People have many initiatives for mitigation, but we didn’t know the right technology to do that,” Lamine explains. fAIr is positioned to accelerate this work.
Countries participating in HOT’s Mapping for Climate Ready Cities program span Latin America, West Africa, East Africa, and South Asia.
Map4Mangrove: Indonesia
In Indonesia, the Map4Mangrove project works with coastal rehabilitation organizations to map mangrove coverage and improve monitoring using open spatial data. After a 2018 tsunami struck Pandeglang in Banten, the Indonesian Biodiversity Foundation (KEHATI) and local conservation group SALAKA launched the Blue Carbon Program, a rehabilitation initiative covering 14 hectares across five sites. But monitoring relied on paper-based records, making reporting labor-intensive and difficult for donors to verify.
Through Map4Mangrove, HOT’s Asia-Pacific Hub trained 20–30 university students on Field Tasking Manager, KoboToolbox, and Mapillary, then built a centralized UMap dashboard integrating drone imagery, geotagged field data, and carbon sequestration estimates. “The donor didn’t need to go to the field, they could just see the geotagged image on Mapillary and compare it with the collected data,” says Dinar Adiatma, data quality lead at HOT’s Asia-Pacific Hub.
The following image shows a mangrove rehabilitation site in Banten, Indonesia. The Map4Mangrove project monitors five sites like this one across 14 hectares, tracking growth and carbon sequestration through open mapping tools.
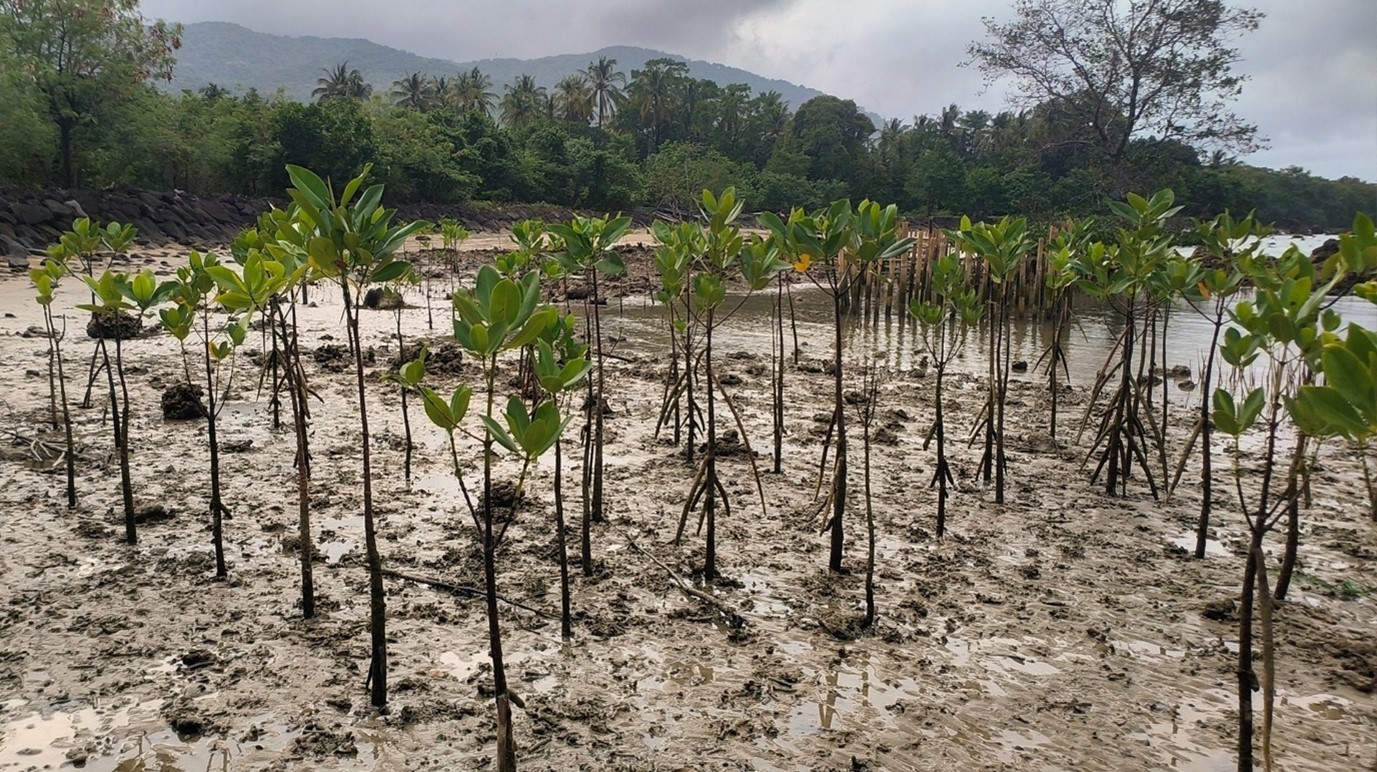
Figure 5: A mangrove rehabilitation site in Banten, Indonesia. Photo: Tony Liong, Open Mapping Hub – Asia-Pacific
Two students maintain the dashboard full time, and SALAKA has begun extending the approach to fish distribution data from local fishermen. In the following image, the Map4Mangrove field team reviews drone imagery at the Banten rehabilitation site.
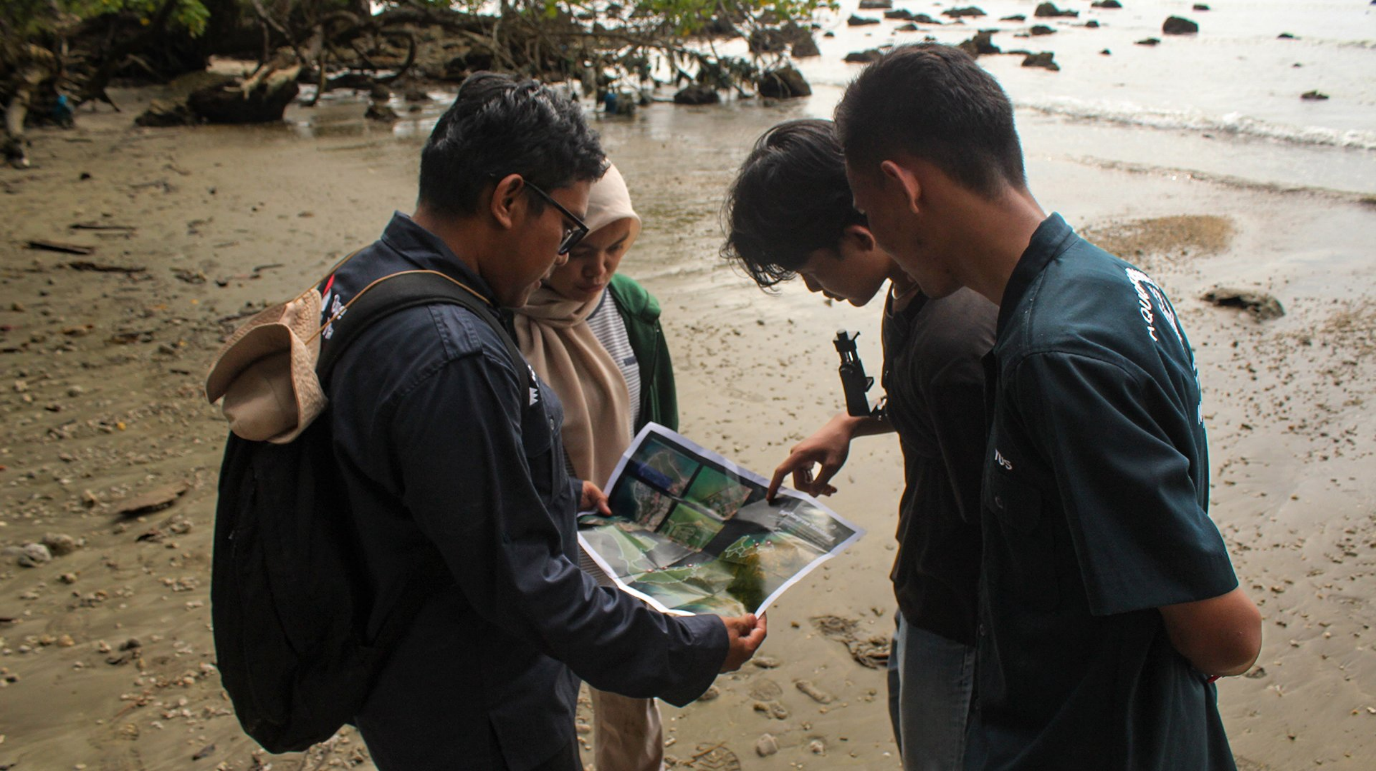 Figure 6: The Map4Mangrove field team reviews drone imagery. Photo: Tony Liong, Open Mapping Hub – Asia-Pacific
What connects these stories
Each example follows a common pattern: open source tools lower participation barriers, AWS scales compute when needed, AI accelerates tedious work, and human validation improves quality and accuracy. Whether assessing earthquake damage in Caracas, identifying heat islands in Freetown, or monitoring mangrove rehabilitation in Banten, the architecture stays the same. The community changes, the model changes, but the platform holds.
Get involved
Visit HOT to learn more about their work. To start mapping, join a task on the HOT Tasking Manager. To explore fAIr and its open source AI models, visit the fAIr project page. To learn more about how AWS supports customers and partners to innovate across health, education, and climate, check out AWS Impact and Open Data Sponsorship Program.