AWS Storage Blog
Amazon CloudWatch Percentiles on Amazon S3 brings more precision to tracking application response time metrics
If you care about application response time, you’ll be interested in hearing about new Amazon CloudWatch support for percentiles on Amazon S3. Those responsible for the development and operation of applications understand there is a correlation between data response time and your customers’ experience with application responsiveness. For this reason, many organizations have established response time goals, and their storage services are constantly measured and optimized toward consistently achieving these goals.
Amazon CloudWatch is a service for monitoring and managing distributed applications and resources. It gives developers, system operators, site reliability engineers (SREs) and IT managers the ability to analyze and respond to performance changes, the tools to optimize resource utilization, and provides a unified view of operational health.
One of the services Amazon CloudWatch monitors and manages is Amazon S3. Amazon S3 is an object storage service that offers industry-leading scalability, data availability, security, and performance. Amazon S3 can help your applications be responsive with data on-demand. There are two ways you can use Amazon S3 CloudWatch metrics. First, you can monitor bucket storage and get daily metrics at no cost. Second, with request metrics you can monitor Amazon S3 requests at 1-minute intervals, billed at the same rate as Amazon CloudWatch custom metrics. It is with request metrics that Amazon CloudWatch Percentiles on Amazon S3 become particularly valuable for monitoring and managing your data storage performance and tracking to your established response time goals. Response time of less than 50ms for 95% of requests hitting a website and an internal goal of achieving under 30ms latency for 90% of application requests are a couple examples that we’ve heard. What are yours?
Before Amazon CloudWatch percentiles were available on Amazon S3, request metrics could display maximum, minimum and averages. After the recent (July 25, 2019) introduction of Amazon CloudWatch percentiles on Amazon S3, you have access to granular percentile level metrics that will help monitor and measure your storage response times with more precision. In CloudWatch, we use ‘p90’ to refer to the 90th percentile data; that is, 90% of the observations fall below this value. Percentiles for p90, p95, p99, p99.9, p99.99 or any other percentile from 0.1 to 100 in increments of 0.1% (including p100) of an Amazon S3 request metric can now be visualized in near real time.
Alerts can notify you when Amazon S3 request metrics violate thresholds you set at the percentile level, so you can take appropriate action to bring your data stored in Amazon S3 in line with response time goals. This is particularly useful for data that shows large variances. Percentile granularity avoids false positives for response time threshold violations that may be caused by outlier data. For example, a maximum might trigger a threshold violation, yet after further investigation it might be discovered that the data largely reflects a single slow request out of millions issued within a twenty-four hour period, which would not deliver an accurate picture of the distribution of customers’ experiences for that day. With Amazon CloudWatch Percentiles on Amazon S3, you can now visualize granular percentiles across a selected time interval and an entire distribution of latencies, allowing anomalies to easily be eliminated as false positives.
Request metrics are available at Amazon S3 bucket-level by default. To determine if you’re meeting your particular goals for applications, workloads, and internal organizations you can configure metrics to view percentiles for specific objects. This is accomplished by creating a metrics configuration for the bucket where the objects reside, and using filters to select a subset of objects.
Amazon CloudWatch percentiles on Amazon S3 helps you ensure you’re meeting performance goals and delivering good customer experience. You may also find their precision and granularity to be more cost effective, requiring fewer request metrics to visualize and track latency patterns than before.
Getting started is simple. Turn on request metrics from the Amazon S3 console by navigating to the management tab of your Amazon S3 bucket. Percentiles are available on the following six existing CloudWatch Metrics for Amazon S3: BytesDownloaded, BytesUploaded, FirstByteLatency, TotalRequestLatency, SelectScannedBytes, SelectReturnedBytes.
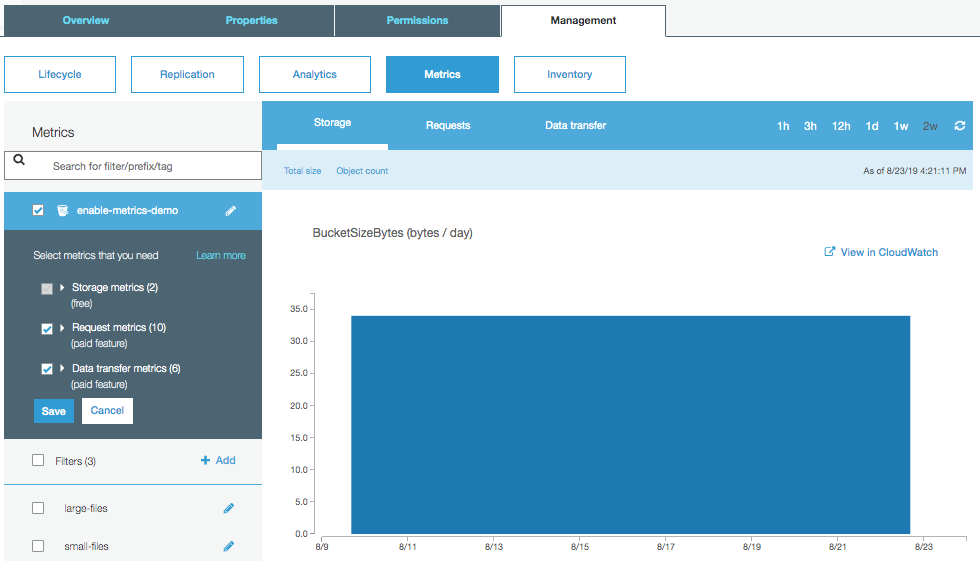
Set up request metrics by navigating to the Amazon S3 console, open bucket properties and enable request metrics and data transfer metrics. Notice that data transfer metrics now have percentiles:
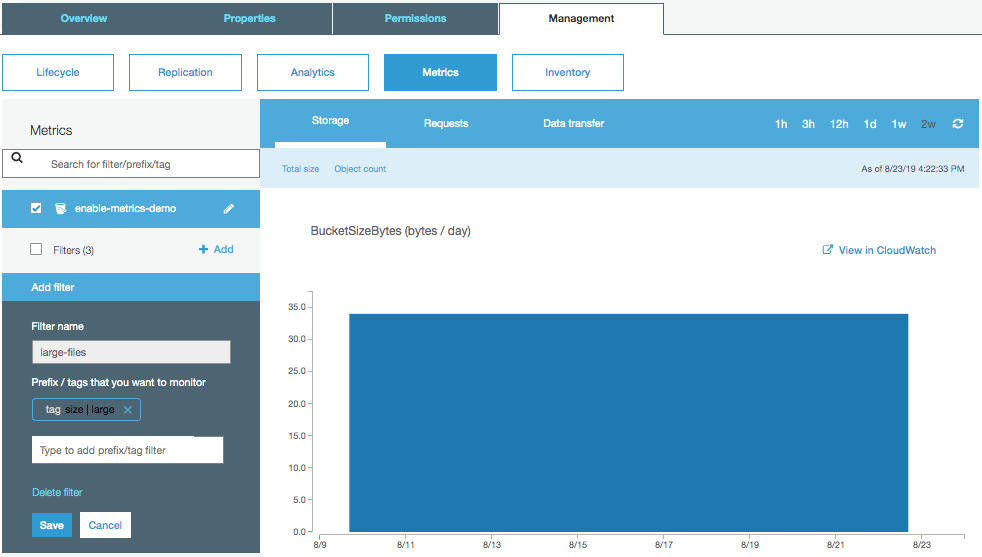
You can also set up filters to differentiate large files from small files to better understand the performance characteristics of each group of files:
Tags can be added to individual files via the console or via the Amazon S3 API:
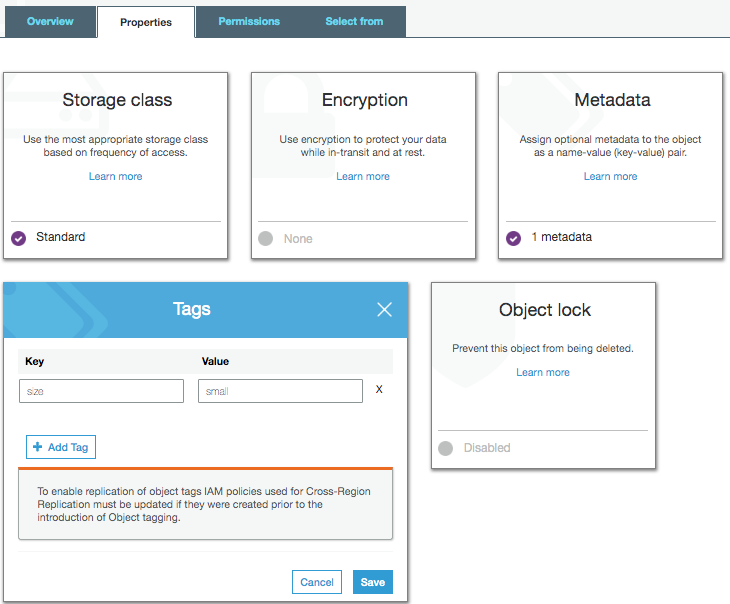
For example, some customers put tags on objects to group objects by file size (1 byte – 1 MB, 1 MB – 100MB, 100MB+) and obtain different request metrics for each.
Once metrics are set up, you can start diving into the data transfer metrics. The following screenshot shows how you can investigate the difference between p99 (99th percentile) and p100 (100th percentile). Latency metrics often have a long tail, and p100 metrics can give an unclear picture of what the majority of your customers are experiencing. Here in the p99 case, the total request latency is staying around 140ms, however the p100 shows spikes of 36 seconds. Before you might have seen a max latency like this without knowing that 99% (or 99.9%) of users saw significantly better results. Customers with bad network connections, downloading of very large files, or unexpected latency within Amazon S3 could be the cause of spikes in this graph:
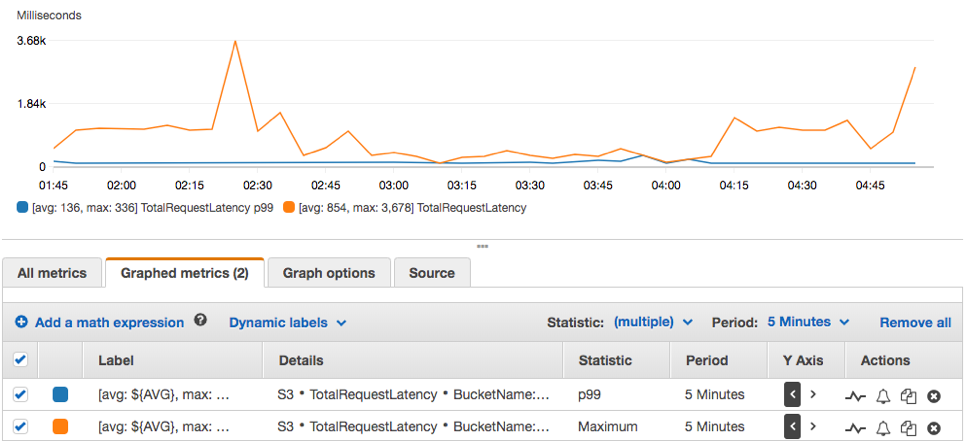
In this graph, higher total request latency seems to coincide with larger bytes downloaded:

It can also be useful to look at different percentiles to get an understanding of the typical experience of your customers. In this case, 50% of customers are receiving their download within about 25ms, 90% within about 75ms, and 99% within about 140ms.
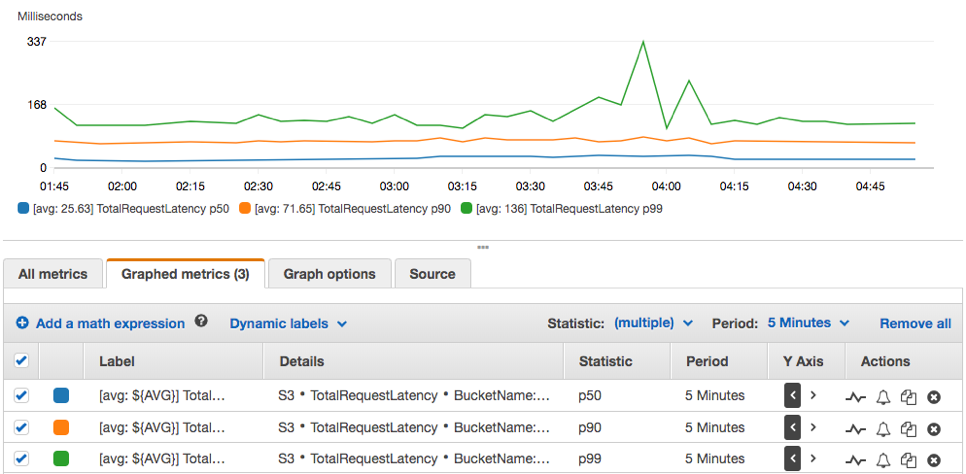
To set up an alarm against a given metric, you can do so by clicking the bell icon next to the metric, which takes you to a screen that shows the metric and allows you to set up trigger conditions:

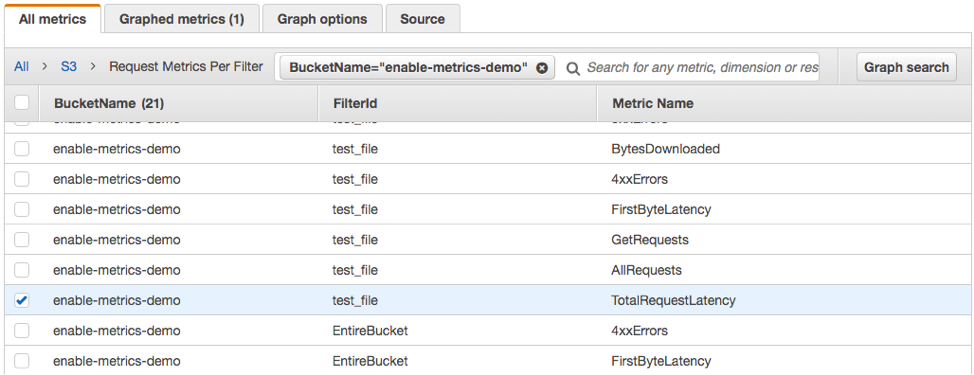
To view metrics based on filters, select the BucketName and FilterId. In the screenshot, TotalRequestLatency is selected for the test_file filter on the enable-metrics-demo bucket:

Percentile support for S3 request metrics is available in all AWS commercial regions and AWS GovCloud (US) Regions. To learn more about CloudWatch Metrics for Amazon S3, visit Monitoring Metrics with Amazon CloudWatch in the Amazon S3 Developer Guide.