AWS Storage Blog
Improve resilience of low latency applications with Amazon EBS and AWS FIS
Organizations running mission-critical applications and databases face challenges to ensure their systems can withstand unexpected storage performance degradation. Storage latency issues can emerge unpredictably in production environments and impact the business. Although unit, integration, and regression testing ensure that systems work under normal conditions, they don’t cover unexpected failures that result in expensive outages. This leaves an important gap in understanding how applications will respond when storage performance degrades, potentially leading to costly outages that affect customer trust, compliance standing, and revenue. For industries handling sensitive, high-impact transactions such as financial services, even minor disruptions can have cascading effects across their operations.
Amazon Web Services (AWS) addresses this challenge through chaos engineering capabilities that enable controlled testing of application resilience. AWS Fault Injection Service (AWS FIS) provides tools to simulate real-world failure scenarios, including storage performance issues, in a controlled manner. By introducing configurable I/O latency on Amazon Elastic Block Store (Amazon EBS) volumes, organizations can test how their complete technology stack responds to degraded storage conditions before actual incidents occur. This proactive approach helps validate database failover mechanisms, transaction handling, timeout configurations, and monitoring systems under realistic stress conditions. In this post, we demonstrate how to use AWS FIS to test application resilience against storage performance disruptions, specifically I/O latency, enabling you to validate your application’s real-world storage disruption handling and optimize your architecture for improved fault tolerance.
AWS FIS now allows you to inject I/O latency on Amazon EBS volumes at configurable percentages, providing precise simulation of storage performance degradation. Unlike the pause I/O action that completely stops all operations, the new latency injection action lets you test nuanced scenarios such as application response to slower I/O, query performance under delayed conditions, and SLA validation under increased latency. One financial services customer used this capability to validate their mission-critical transaction processing platform built on Oracle, PostgreSQL, and Microsoft SQL databases. Their architecture provides real-time portfolio views where storage latency directly impacts financial transactions and account refresh rates. Using AWS FIS latency injection, they validated database failover mechanisms, transaction rollback procedures, and timeout handling under realistic degraded conditions, enabling optimization of monitoring, alerting mechanisms, and architectural fault tolerance before actual incidents occur.
Solution overview
In this post, we walk through the steps to conduct the following latency experiment on EBS volumes.
Experiment: Run latency injection on multiple EBS volumes using a sample application architecture scenario. In this experiment, CloudWatch alarms are used with FIS controls and guardrails to automatically stop an experiment if metrics reach a defined threshold. You can also use any Application Performance Monitoring (APM) of your choice, such as Datadog, Amazon Managed Service for Prometheus, and Amazon Managed Grafana, to monitor the latency injected on the EBS volume during the experiment.
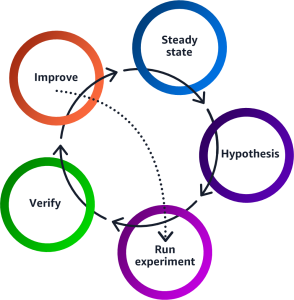
Chaos engineering experiments progress through a systematic lifecycle starting with identifying the steady state, formulating a hypothesis, executing controlled fault injection experiments, verifying the experiment results, and implementing system improvements based on experiment results.
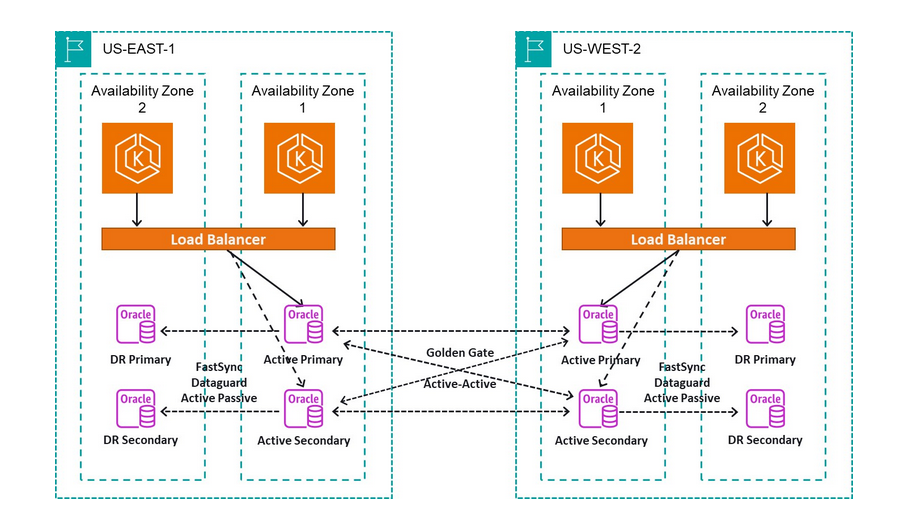
For the purposes of this post, we use the following example architecture.
Steady state: We can define steady state as some measurable output of an application that indicates normal behavior. For example, we have an application hosted on Amazon Elastic Kubernetes Service (Amazon EKS) across multiple Availability Zones in two AWS Regions. The application connects to the Oracle database that is fronted by a Network Load Balancer (NLB) with defined health checks to make sure the instances are healthy before the request is routed, as shown in the following figure.
Hypothesis: Injecting I/O latency on EBS volumes running in a single Availability Zone doesn’t disrupt our application. In the case of our Financial Services Industry customer that has critical low latency workloads, any read or write latency greater than 3 ms for small I/O (8-32 KiB) and 10 ms for large I/O (32-256 KiB) can have an adverse effect on their application.
Run experiment: Trigger volume I/O latency action for EBS volumes in an Availability Zone.
Verify: Confirm or discard the hypothesis by looking at the KPIs of the application (for example through CloudWatch metrics, alarms, application logs, business metrics etc.)
Improvement: Implement necessary fixes based on experiment results. Customers can validate and optimize application configurations (tune timeouts, retry mechanisms, and connection pooling) to ensure that applications are handling temporary storage issues gracefully. Furthermore, they can improve failovers, check timeliness of application recovery during an increase in I/O latency, and enhance their monitoring and observability to take automated corrective actions. For the scope of this post, we don’t cover improvement steps for the example in this experiment.
In the walkthrough, we assume that you already have a test application or environment to run the experiment on. If you don’t, then you may choose to deploy a sample test application using the architecture diagram presented in the Solution overview section.
Walkthrough
In this section we demonstrate how to run an I/O latency experiment on multiple EBS volumes hosting our sample application. As defined in the Solution overview section, our application is hosted on EKS instances across a multi-Availability Zone (multi-AZ) multi-Region implementation. We’re making a hypothesis that inducing I/O latency on EBS volumes running in a single AZ doesn’t disrupt our application. We run an experiment by simulating I/O latency using AWS FIS. Depending on the experiment results, we can either accept or reject the hypothesis. Customers may observe an impact in processing their transactions when read or write I/O latency is greater than 3 ms for small I/O (8-32 KiB) and 10 ms for large I/O (32-256 KiB), which may result in end user impact. For this post, we test the first case by injecting I/O latency of 3 ms for both read and write operations on 16 KiB on io2 BX volumes. You can run a similar experiment for I/O size greater than 32 KiB and I/O latency of 10 ms to test the second case (we used fio, and you can also use the Linux dd command).
This solution uses the following steps to deploy the experiment:
- Create the AWS FIS experiment template by adding Description, Name, Action, and Target.
- Choose the AWS Identity and Access Management (IAM) role for the experiment template.
- Specify stop conditions and configure logs (optional).
- Save the experiment template.
- Run the AWS FIS experiment using this template.
- Observe various states of the experiment.
- Review application logs to assess how your application responded.
Step 1: Create the AWS FIS template by adding Description, Name, Action and Target
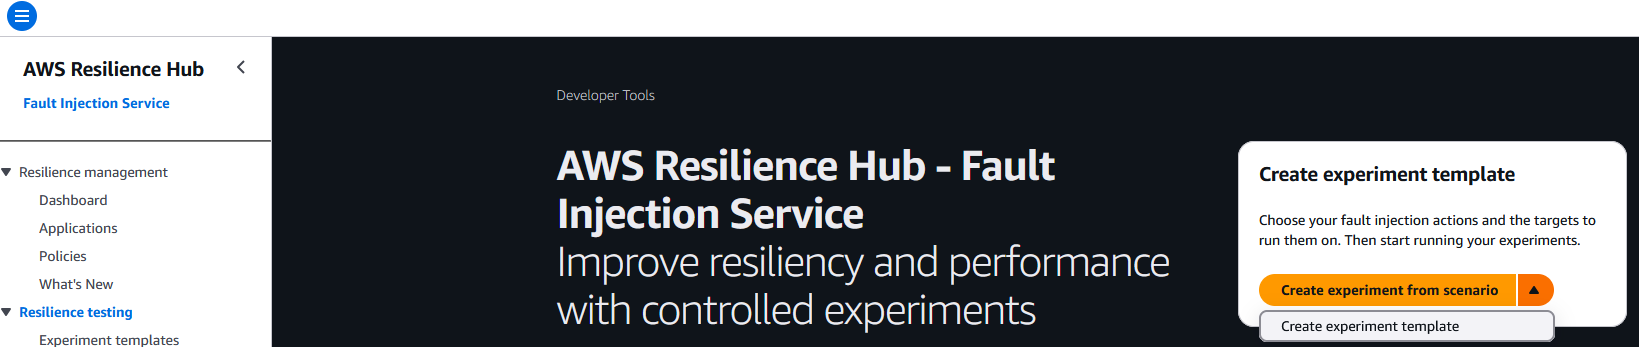
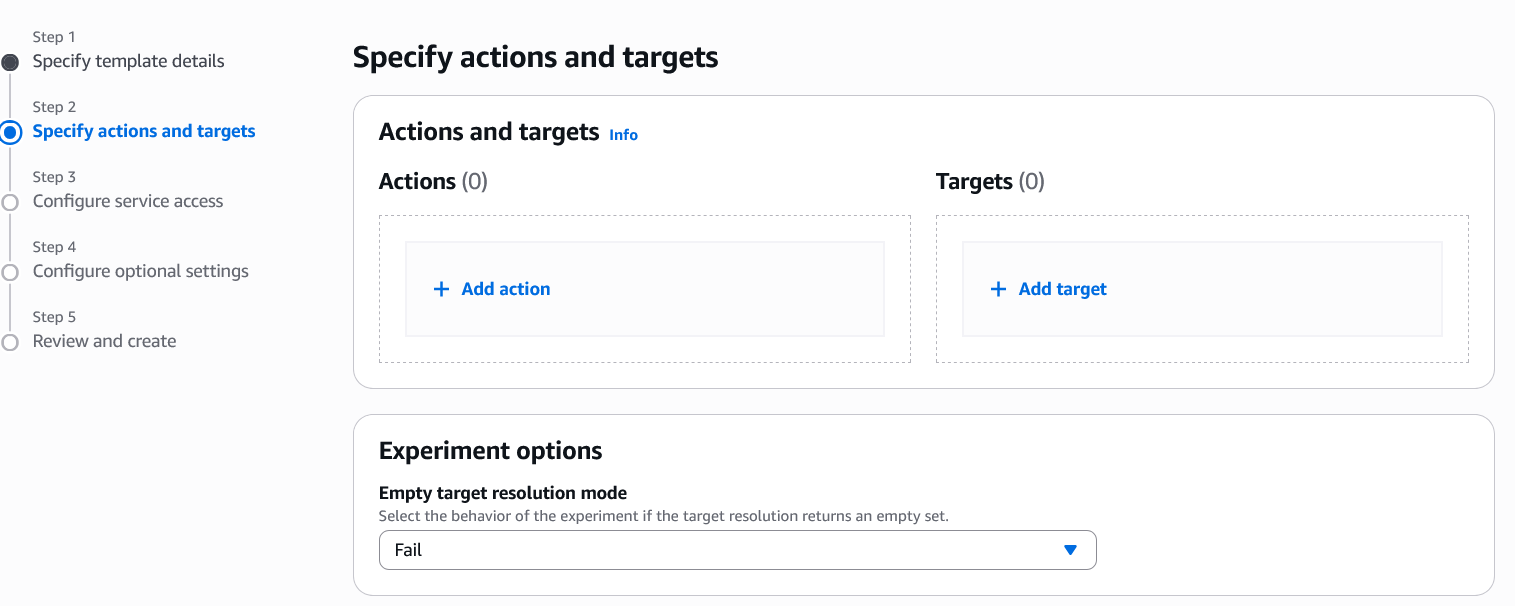
- Navigate to the AWS FIS console to create an experiment template. Choose Create experiment template.
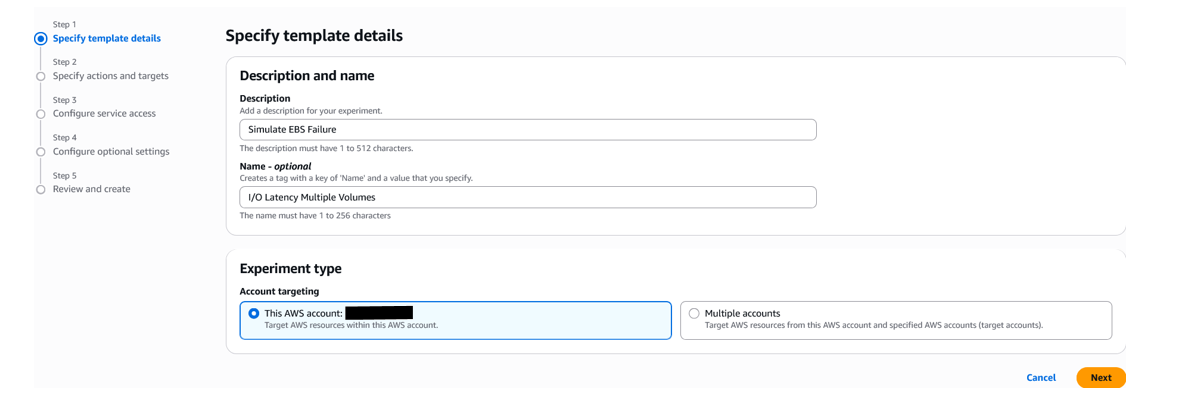
- Enter a Description and Name (optional) for the experiment.
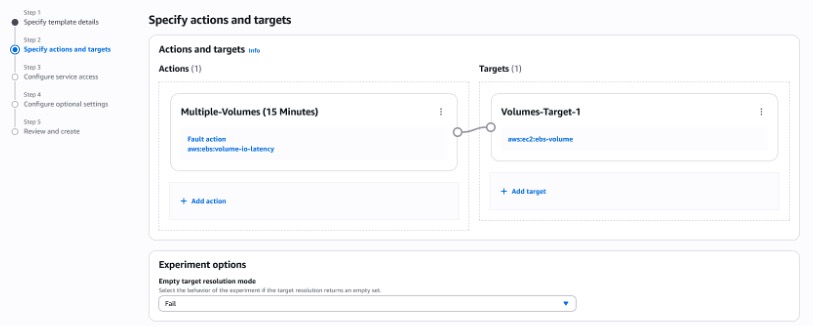
- Add Actions and Add Targets. An action is a fault injection activity that is performed on a target. Targets are AWS resources on which AWS FIS performs actions during an experiment.
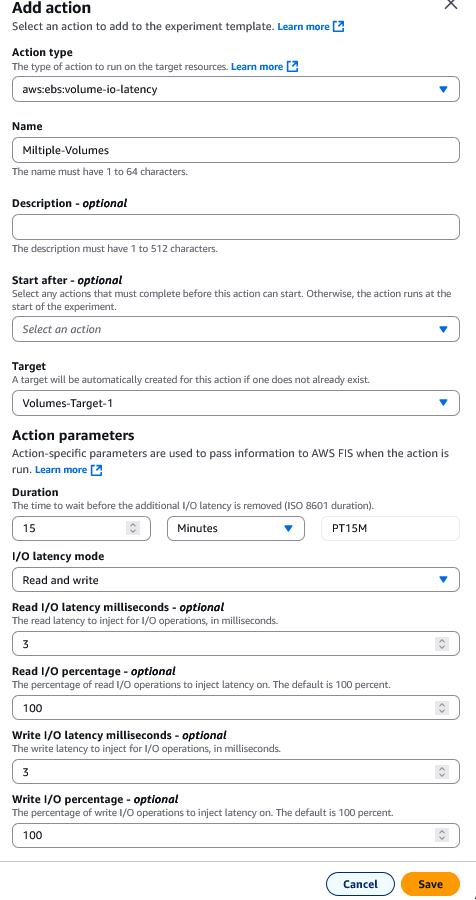
- Under Action Type, choose EBS, aws:ebs:volume-io-latency, and add details such as Name, Description (optional) and Action parameters. For this experiment we used 15 mins as Duration, and 3ms as Read I/O latency, Write I/O Latency. We also injected latency for 100% of transactions for both Read I/O Percentage, and Write I/O Percentage. Once all selections have been made, choose Save.
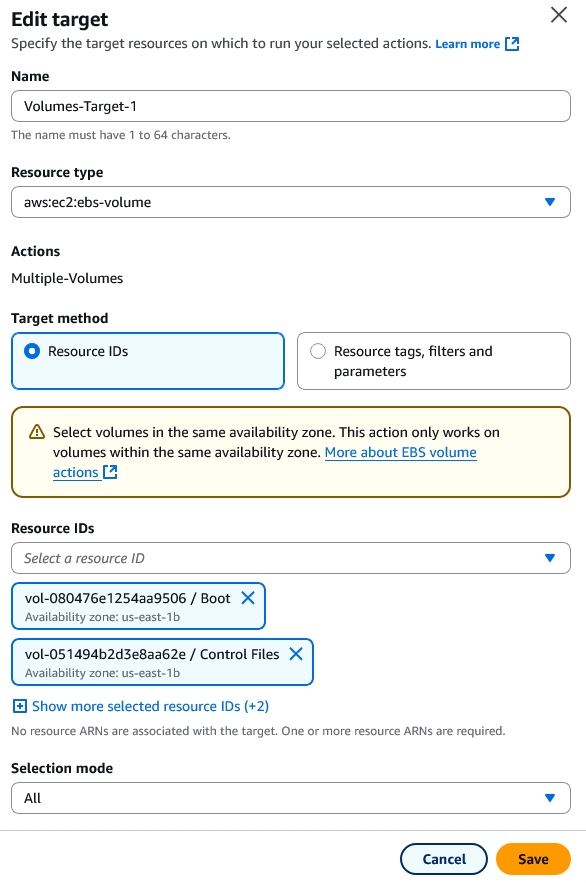
- Choose aws:ec2:ebs-volume.
- Choose Volumes-Target-1. Under Resource IDs, select which EBS volumes you want to target (we selected all). Click save to confirm your volumes targeted for this experiment.
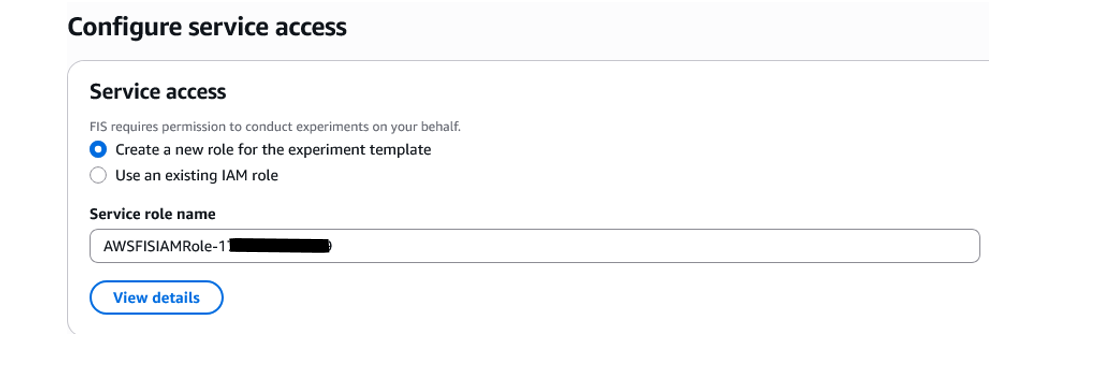
Step 2: Choose the IAM role for this experiment
For this experiment you can either create a new role or use an existing IAM role with the necessary permissions to run the experiment.
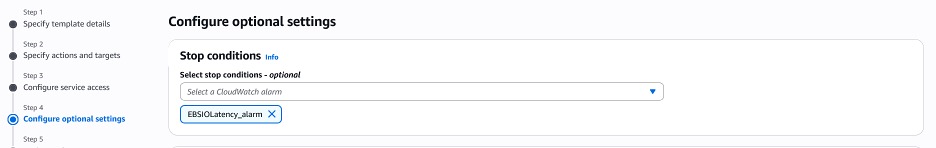
Step 3: Specify stop conditions and configure logs (optional)
AWS FIS provides the controls and guardrails for you to run experiments safely on your AWS workloads. A stop condition is a mechanism to stop an experiment if it reaches a threshold that you define as a CloudWatch alarm. If a stop condition is triggered while the experiment is running, then AWS FIS stops the experiment. In our customer’s case, they were testing for 3 ms latency, thus we added a condition to stop the experiment if the latency on any EBS volumes exceeded 3 ms.
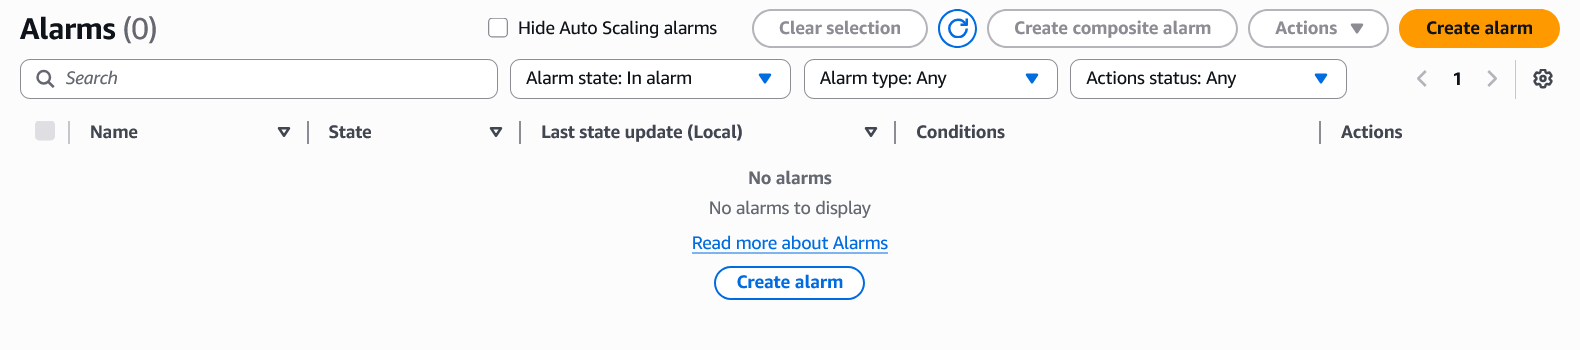
To configure the alarms in CloudWatch:
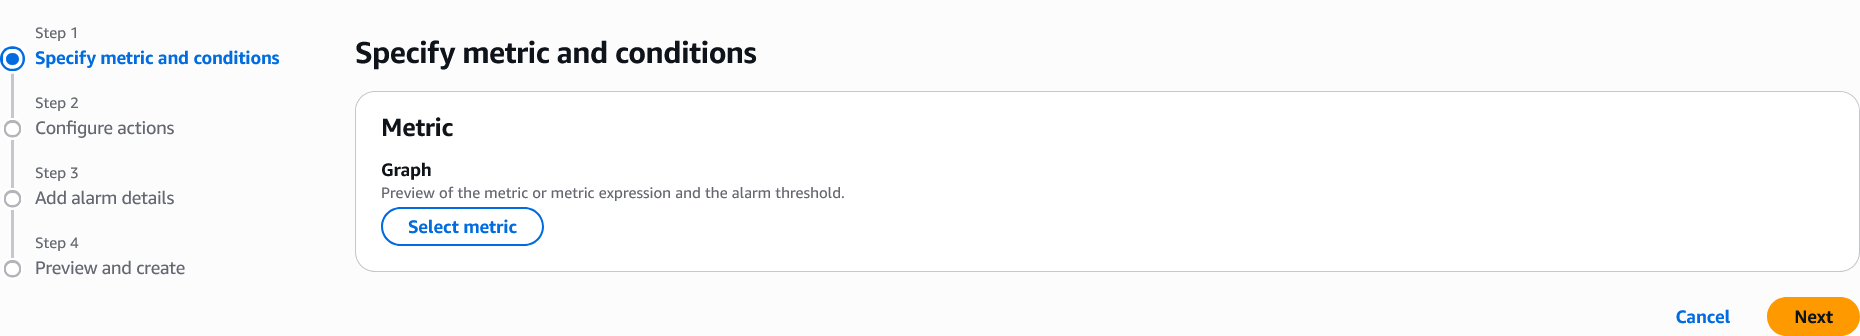
- Choose Create alarm.
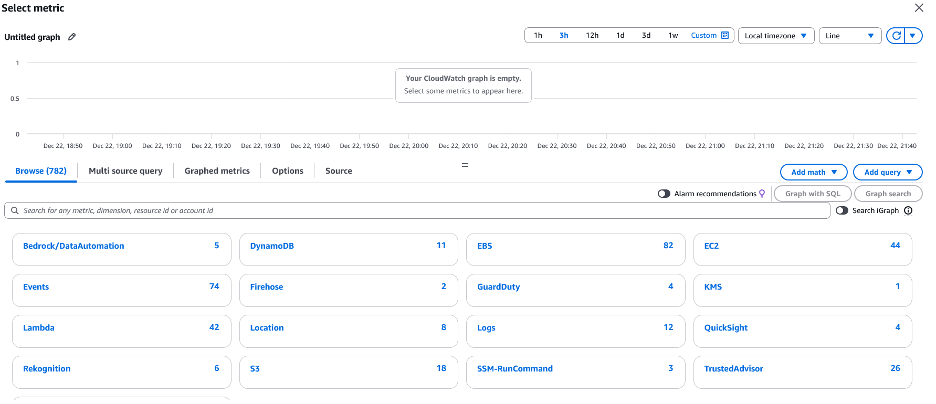
- Under Metric, click Select Metric.
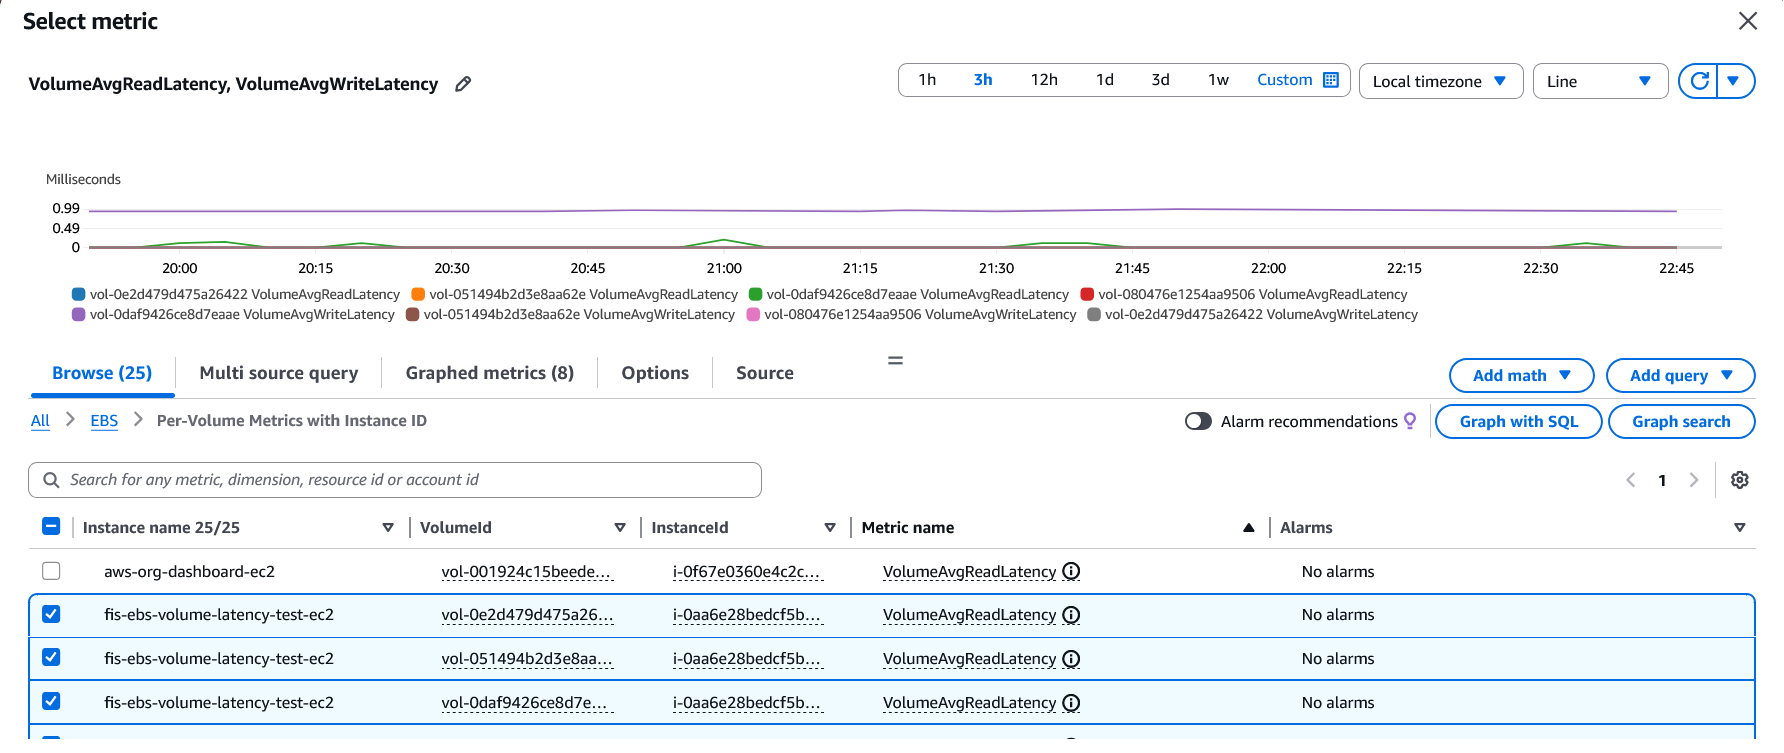
- Click EBS, and select Per-Volume Metrics with Instance ID.
- Choose the respective instance names that have the attached target volumes for the metrics VolumeAvgReadLatency and VolumeAvgWriteLatency.
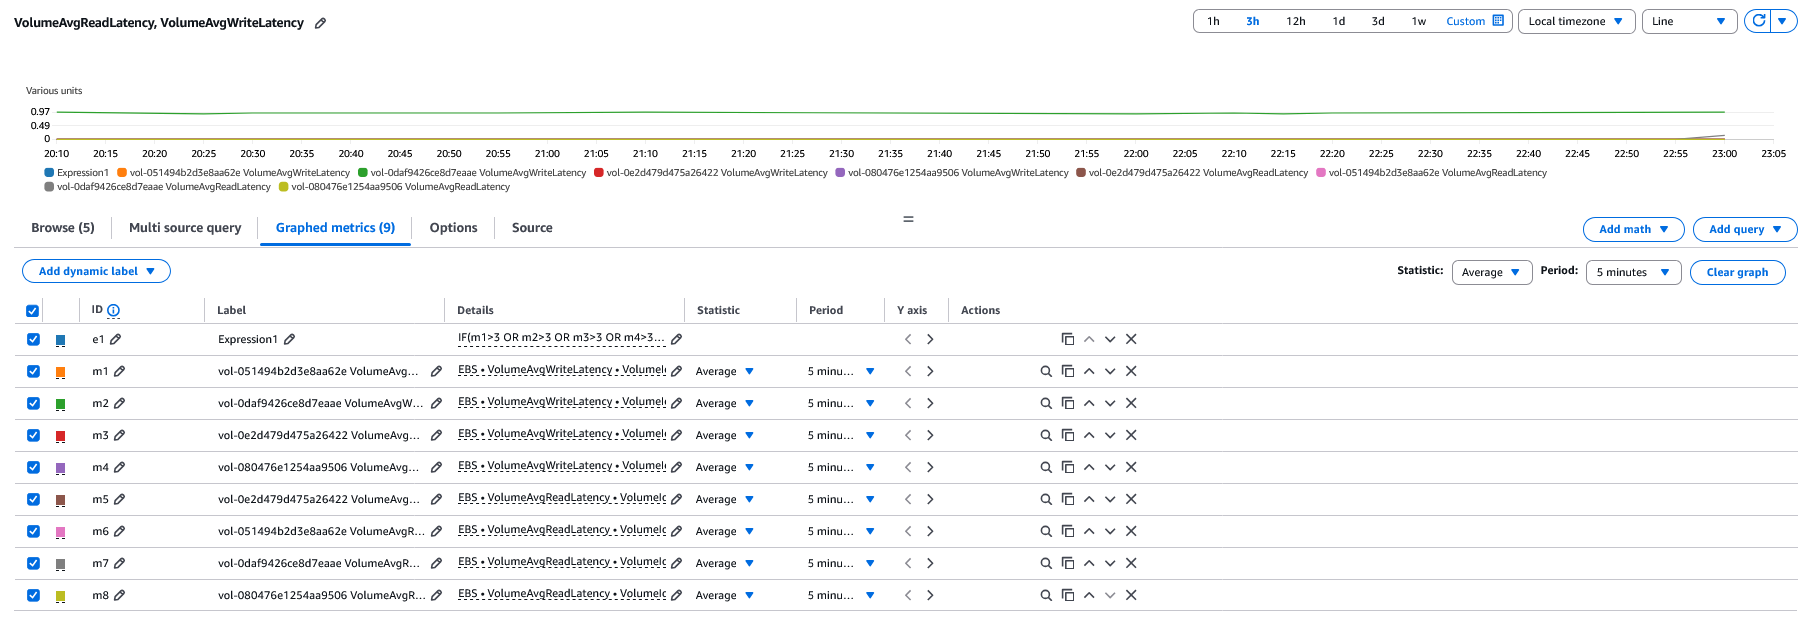
- In the Graphed Metrics tab, choose click Add math and select Start with empty expression to start configuration of your metric.
- Type “IF(m1>3 OR m2>3 OR m3>3 OR m4>3 OR m5>3 OR m6>3 OR m7>3 OR m8>3, 1, 0)” and select Apply. Here m1, m2, m3, and m4 are VolumeAvgReadLatency and m5, m6, m7, and m8 are VolumeAvgWriteLatency. This expression checks if any of these volumes exceed 3 ms of read or write latency, then the alarm triggers, and the experiment is stopped. We have chosen 3 ms because our customer has indicated that they have an I/O latency threshold of 3 ms for both reads and writes on their critical database transaction platform database workloads. Refer to CloudWatch metric math to learn more about supported functions.
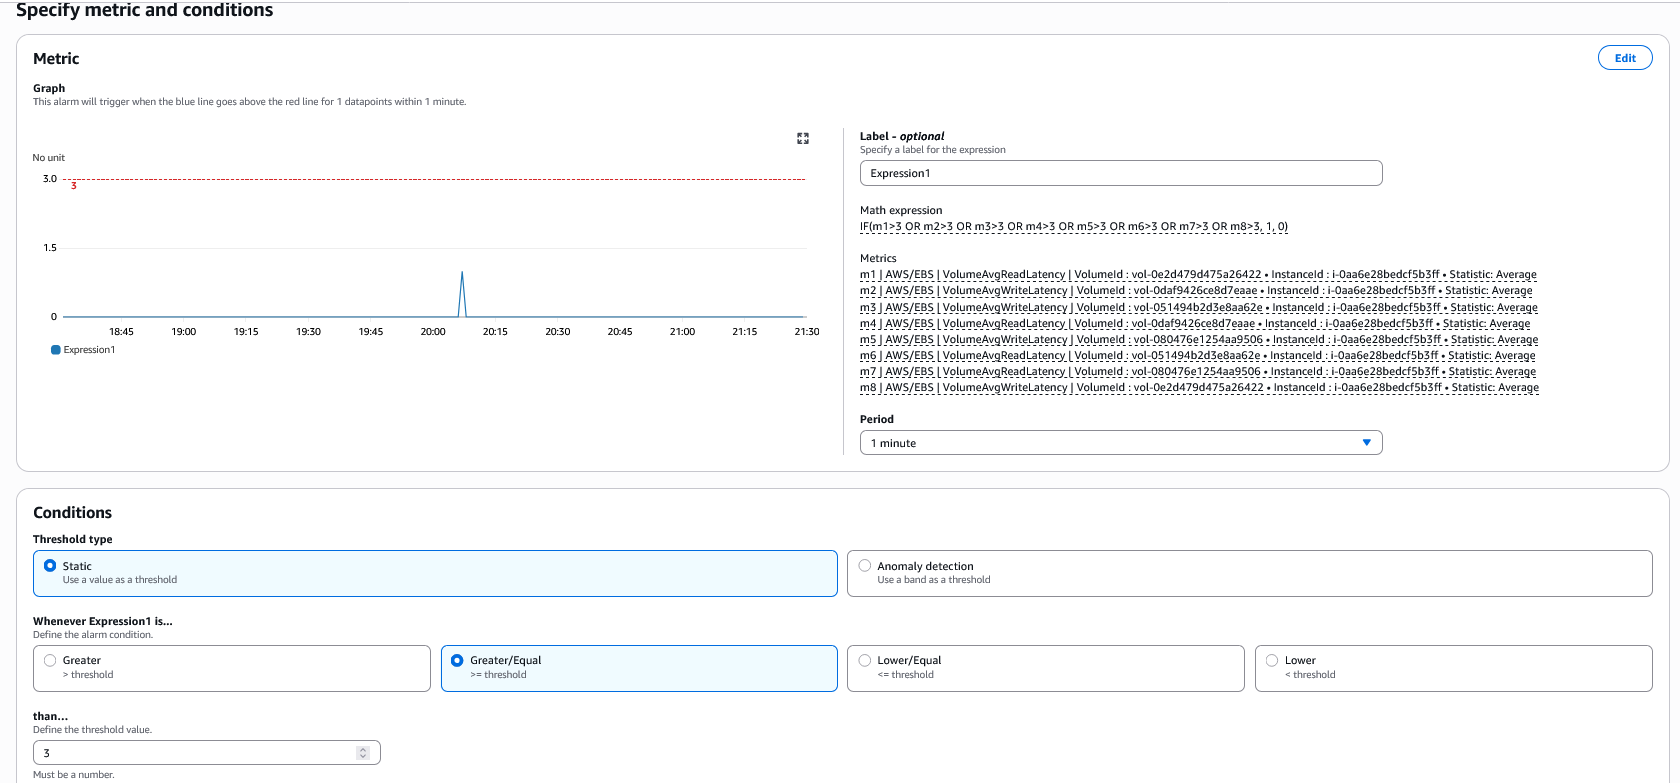
- Unselect all the individual volumes and select the ID e1. Click Select metric.
- Choose Metric, update the period to 1 minute, and update Whenever EBS-IO-Latency is… “Greater/Equal” than (Define the threshold value) to “3”.
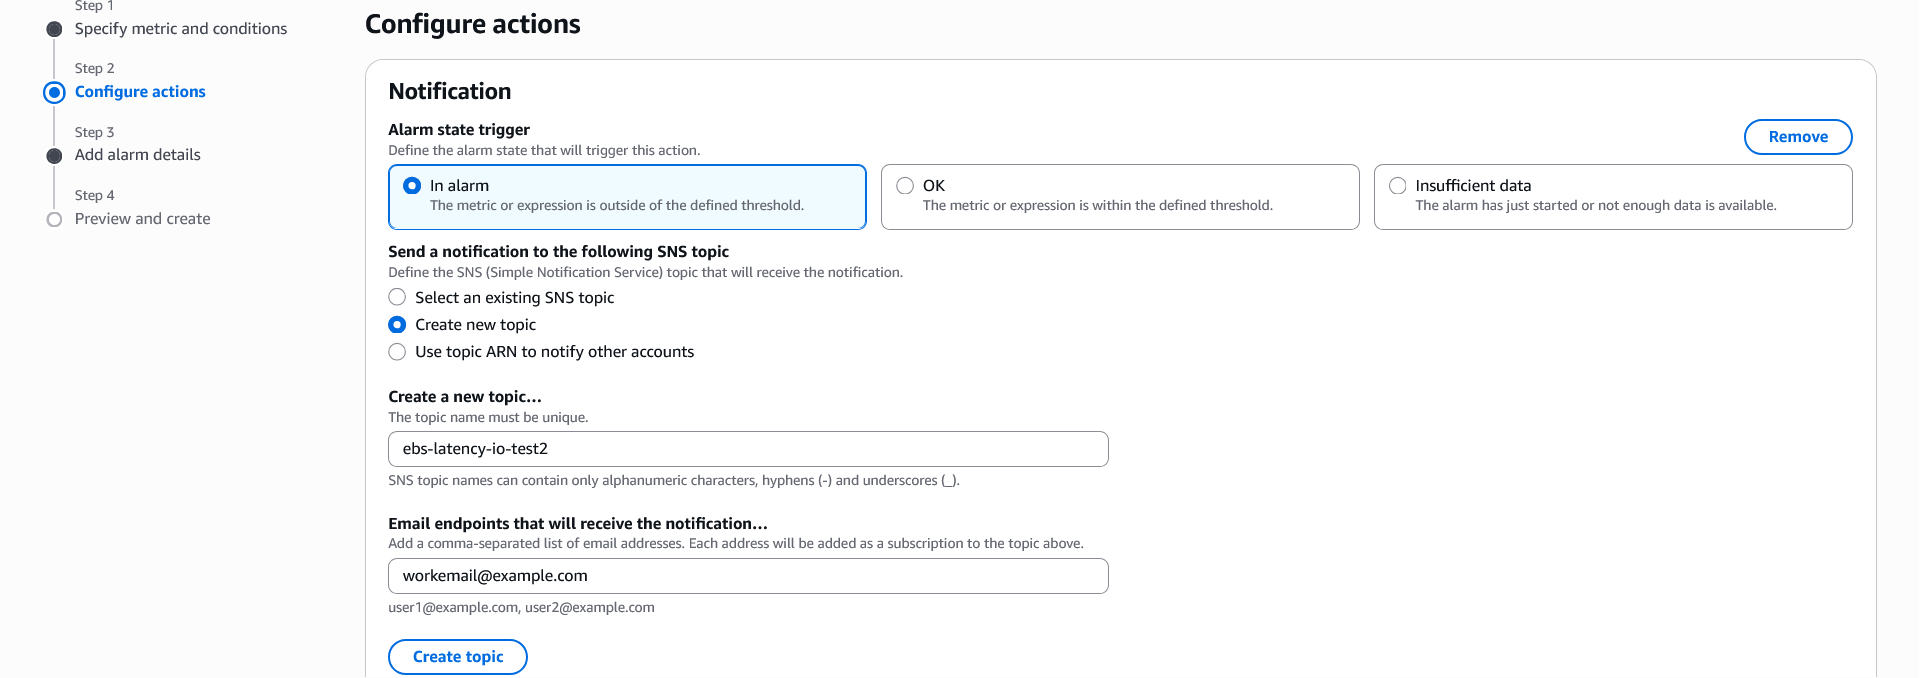
- Choose Next and Configure Actions, and choose In Alarm. For this experiment we chose Create new topic, updated Create a new topic name. Specify email, and chose Create Topic. You can also select other options and then click Next.
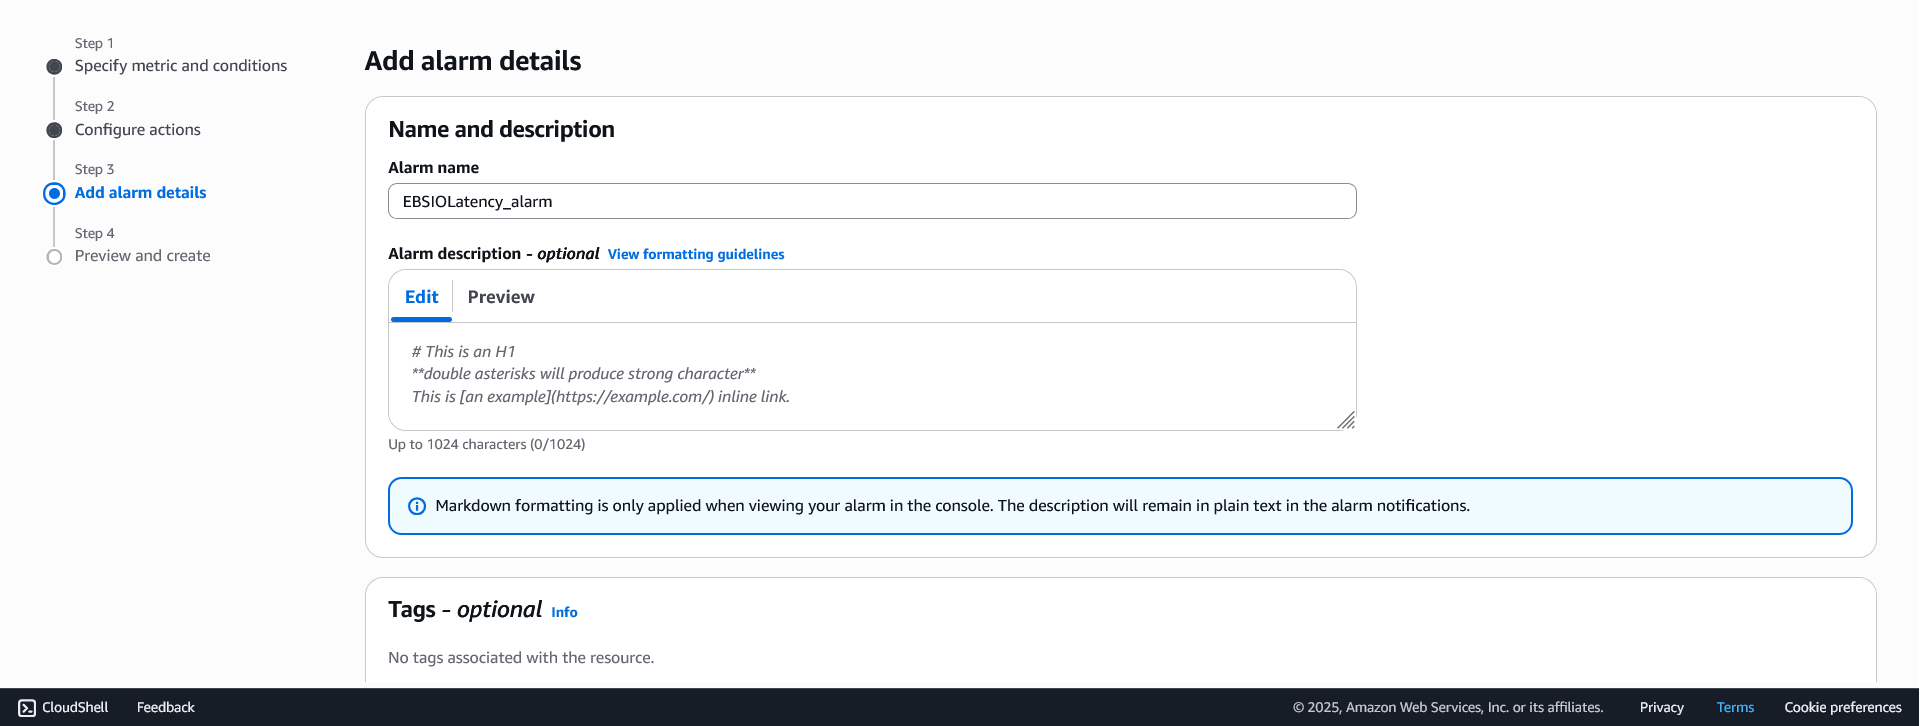
- Add Alarm name.
- Type “IF(m1>3 OR m2>3 OR m3>3 OR m4>3 OR m5>3 OR m6>3 OR m7>3 OR m8>3, 1, 0)” and select Apply. Here m1, m2, m3, and m4 are VolumeAvgReadLatency and m5, m6, m7, and m8 are VolumeAvgWriteLatency. This expression checks if any of these volumes exceed 3 ms of read or write latency, then the alarm triggers, and the experiment is stopped. We have chosen 3 ms because our customer has indicated that they have an I/O latency threshold of 3 ms for both reads and writes on their critical database transaction platform database workloads. Refer to CloudWatch metric math to learn more about supported functions.
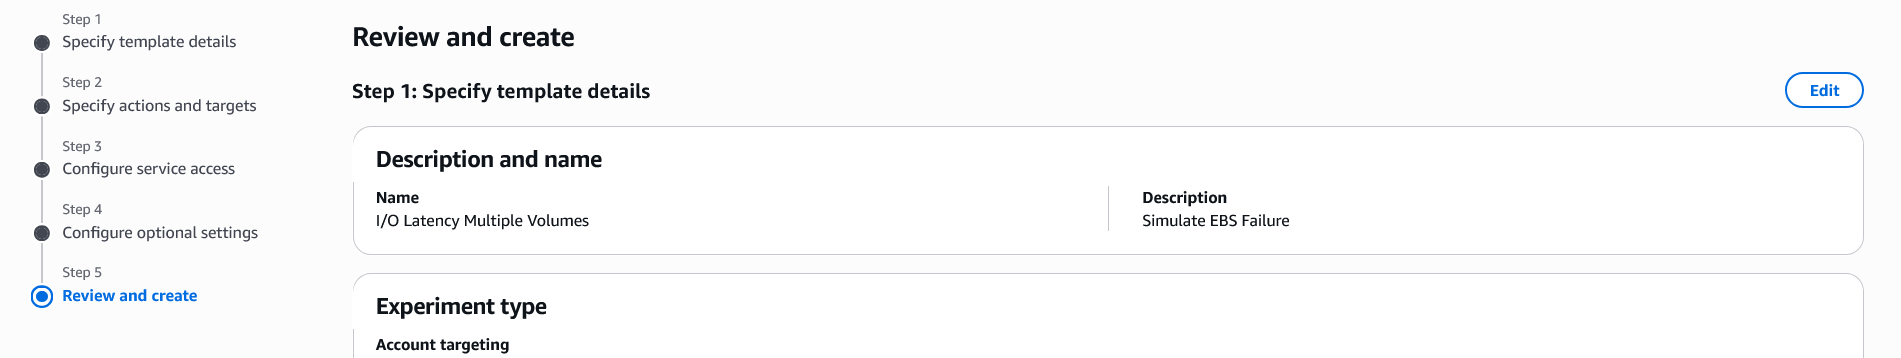
Step 4: Review and create experiment template
Review and click Create experiment template to create experiment to test the EBS volumes for I/O latency injection. You will be presented with a popup box to confirm creation of the experiment. Type create and select Create experiment template. A creating experiment template ribbon show up and you will land on the experiment page.
Step 5: Run the AWS FIS experiment
- If you would like to run the experiment, choose Start Experiment to initiate the experiment.
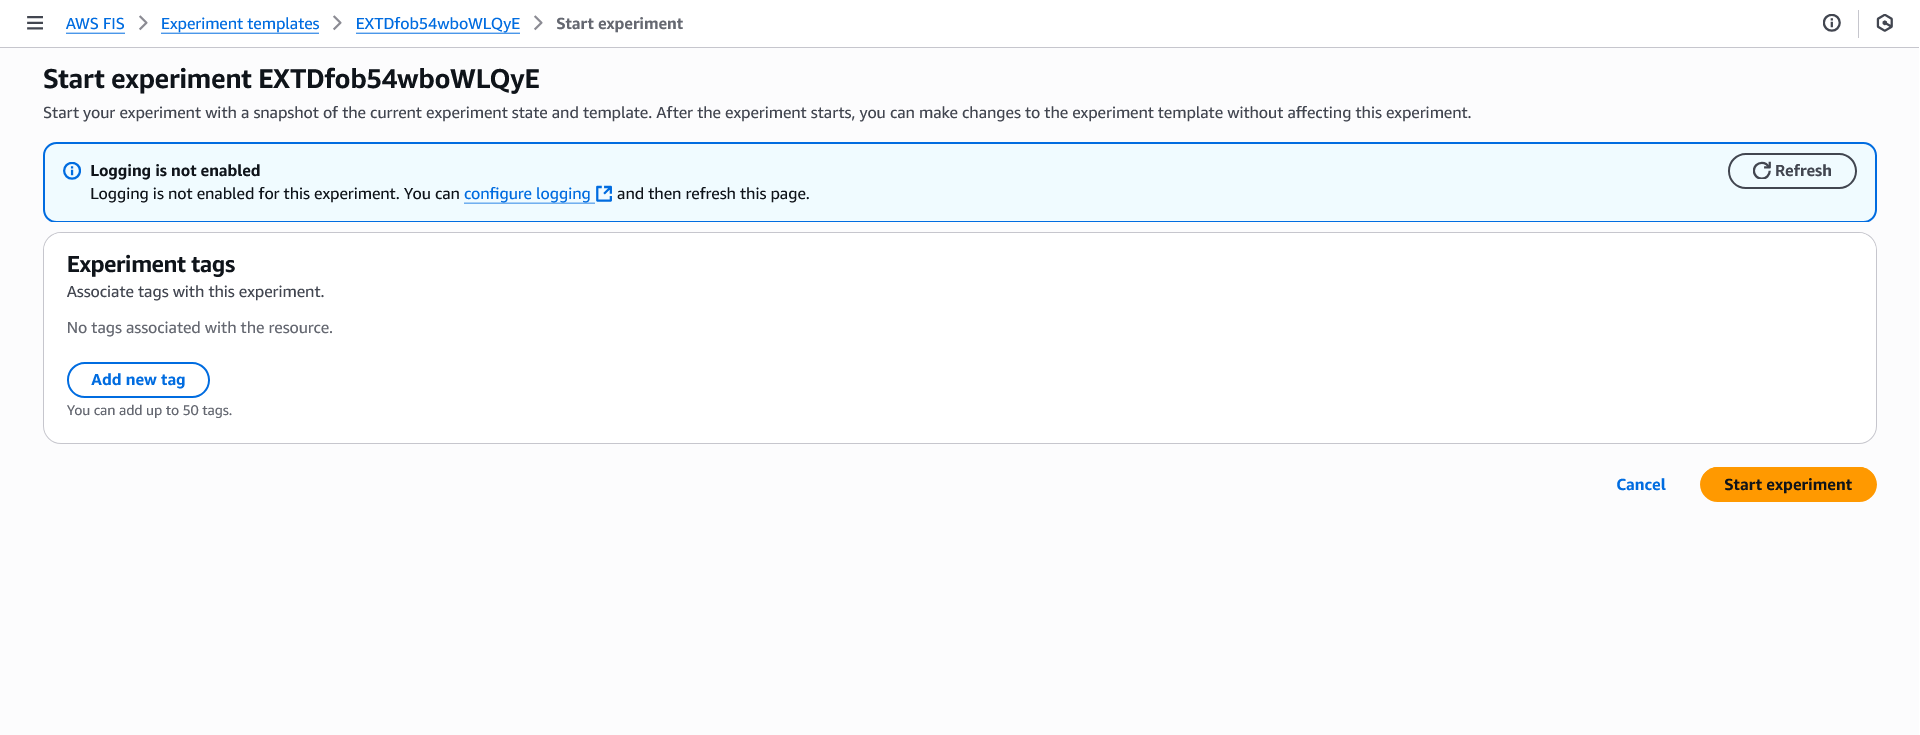
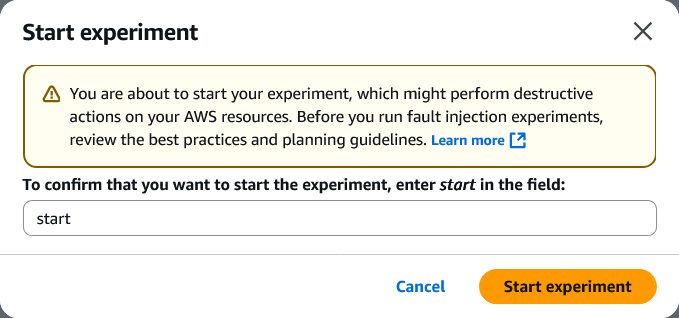
- Once you confirm start experiment you will be prompted to confirm that you want to start the experiment. Type start and click Start Experiment.
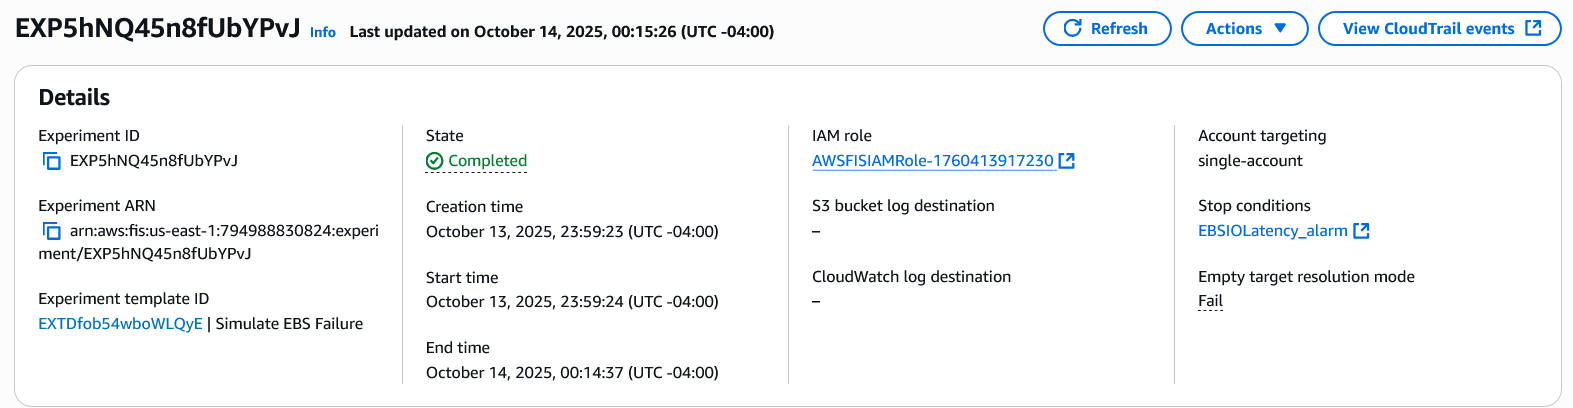
Step 6: Observe various states of the experiment, from Initiated, Running, to Completed
Once the experiment starts, it progresses through three phases: Initiating, Running, and Completed. If issues occur, the experiment enters a Failed state with error details. Review the errors and rerun the experiment to resolve any problems.
Step 7: Review application logs to assess your application’s response
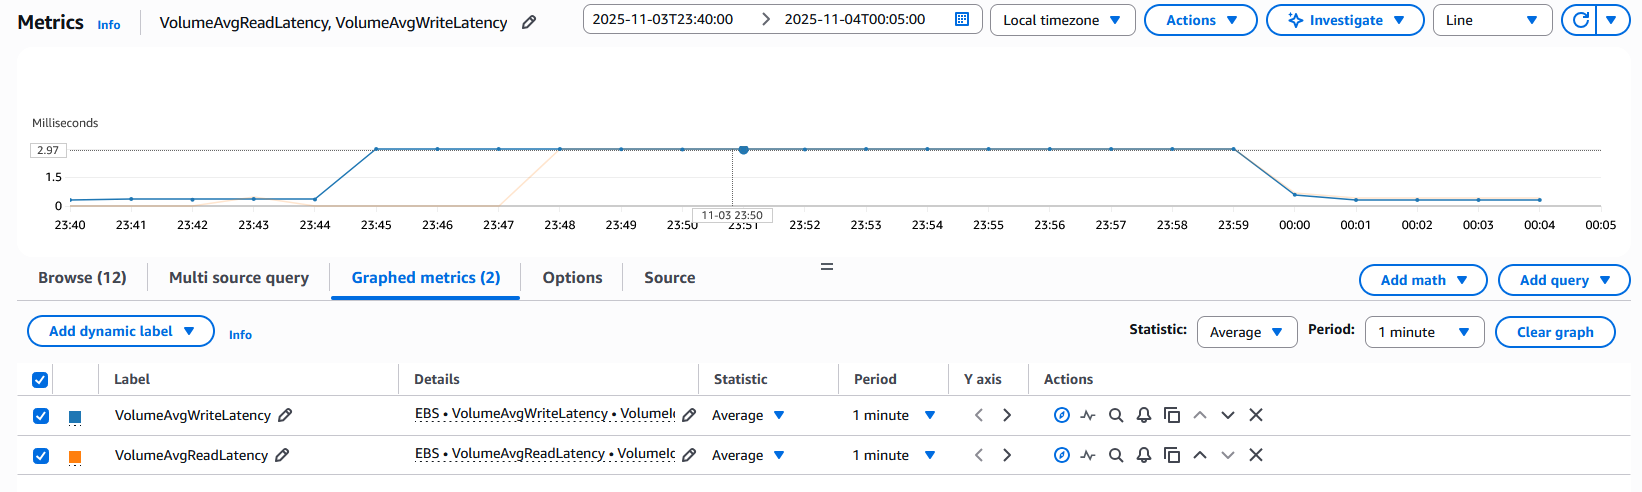
You can review EBS volume CloudWatch metrics (as demonstrated in the experiment) to verify that the volumes in the specified Availability Zone observed I/O latency during the experiment. This helps you confirm that the experiment ran successfully.
Our customer ran this experiment in their pre-production environment and observed that, when their volumes experienced I/O latency of 3 ms, their application and transaction processing times exceeded their business SLA and would have impacted their end customer transactions in a production setting. These findings invalidated their original hypothesis. Therefore, using this experiment, the customer established mechanisms to automatically failover to a secondary AWS Region when latency thresholds were breached.
To evaluate this scenario in your environment, review KPIs that are relevant to your business and application to understand the impact on your customers. Evaluate how your application responds to Amazon EBS I/O latency in single or multiple Availability Zones. Review CloudWatch metrics, application logs, Amazon Route 53 health checks, and any third-party monitoring tools integrated with your application to understand its behavior. Validate your alarms work and recovery workflows initiate as expected.
Based on the results of your AWS FIS experiment, you can accept or reject your hypothesis about your systems resilience. If the experiment reveals that your system doesn’t respond as expected (hypothesis is rejected), then you should:
- Analyze the failure points and components identified during the experiment.
- Review your monitoring mechanisms to verify that you’re capturing the right metrics to quickly identify and alert the impact.
- Evaluate your application architecture and implement necessary changes to improve fault tolerance posture.
- Re-run the experiment to validate that the improvements address the identified gaps.
- Integrate these tests into your continuous integration/continuous development (CI/CD) pipelines and game days to ensure that your applications continue to remain resilient to the disruptions you have designed them to withstand.
This iterative approach ensures the continuous improvement of your system’s resilience posture through controlled experimentation.
Cleaning up
If you created any AWS resources for the preceding experiments, then you should remove them to avoid incurring more costs. Follow the steps in the Delete an Amazon EBS volume or Terminate an EC2 instance documentation as applicable. You can also delete the AWS FIS experiment template if it’s no longer needed by following the steps in the Delete an experiment template documentation.
Conclusion
In this post, we covered the importance of chaos engineering and how it can be used in practice to simulate storage faults specifically for latency sensitive applications such as financial applications and databases. Teams can inject realistic, controlled storage performance degradation to build more resilient systems while maintaining the safety and precision necessary for production-like testing environments. The sample application scenario in the experiment provides a comprehensive mechanism to simulate the impact of latency on Amazon EBS volumes in your applications and shows how you can define guardrails to safely run such experiments.
Our Financial Services Industry customer used these I/O latency experiments to test application response to slower I/O, understand how business SLAs are impacted due to increased storage latency, and implement recovery actions to ensure that their end users aren’t impacted. Customers can use the combination of the AWS FIS sophisticated fault injection capabilities with comprehensive monitoring and observability tools to build and validate resilient database infrastructure. Using these tools, you can understand how your applications respond to storage performance degradation and identify ways to improve their resilience to performance disruptions. To get started with AWS FIS for Amazon EBS, refer to the service documentation.
Thank you for reading this post. If you have any comments or questions, please leave them in the comments section.