Amazon CloudWatch
Observe and optimize your workloads at any scale
What is Amazon CloudWatch?
Amazon CloudWatch is AWS's fully managed monitoring and observability service that collects and visualizes metrics, logs, and traces across your entire AWS environment. It provides real-time visibility into resource utilization, application performance, and operational health, enabling teams to detect anomalies, set alarms, and automate responses before issues reach end users. With native integrations across virtually every AWS service, CloudWatch offers capabilities like composite alarms, anomaly detection, and cross-account observability. As workloads become increasingly AI-driven, CloudWatch also delivers purpose-built AI and agent observability, helping teams monitor model inference performance, trace multi-step agent workflows, and pinpoint failures across complex, autonomous systems. Whether you're running a single EC2 instance or operating distributed, AI-powered applications at scale, CloudWatch provides the unified intelligence you need to keep everything running reliably.

See everything in one place
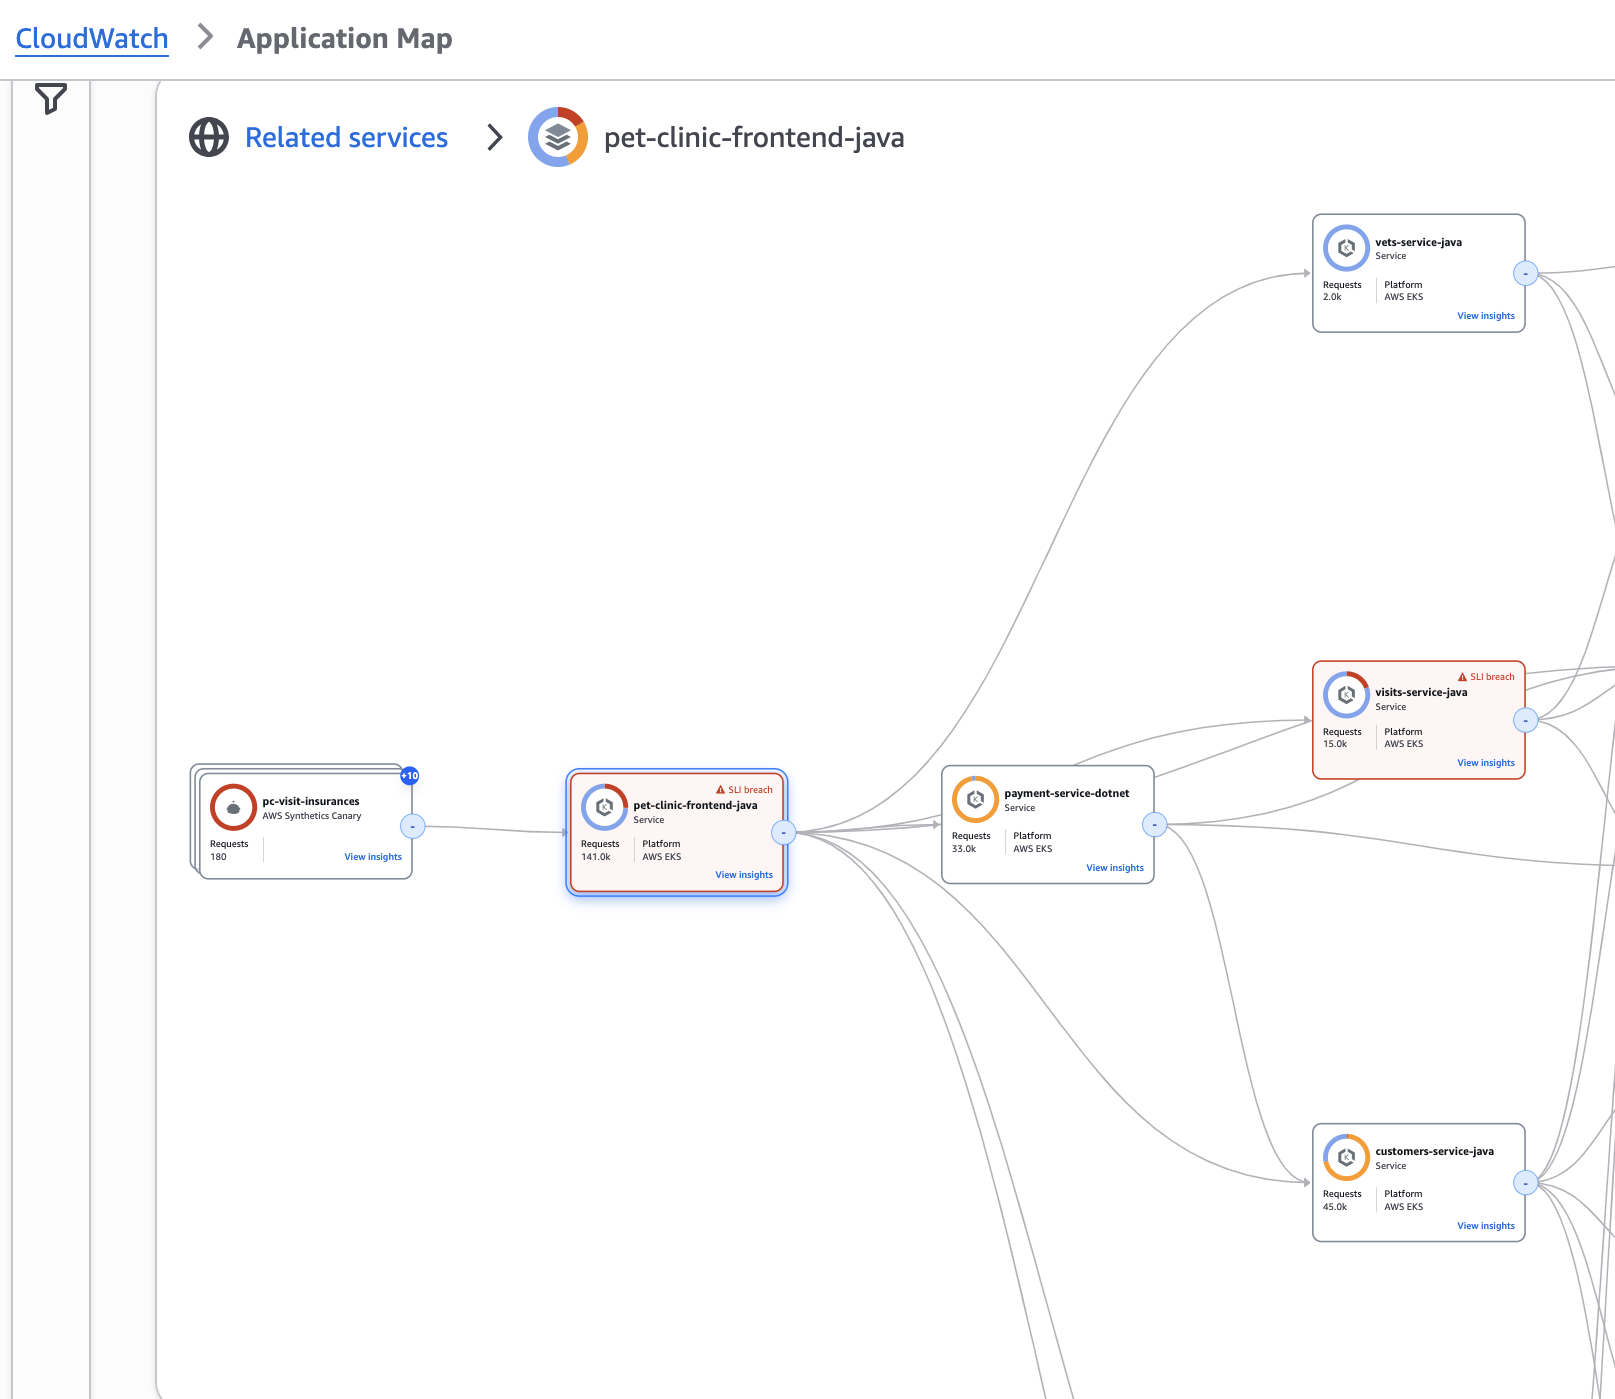
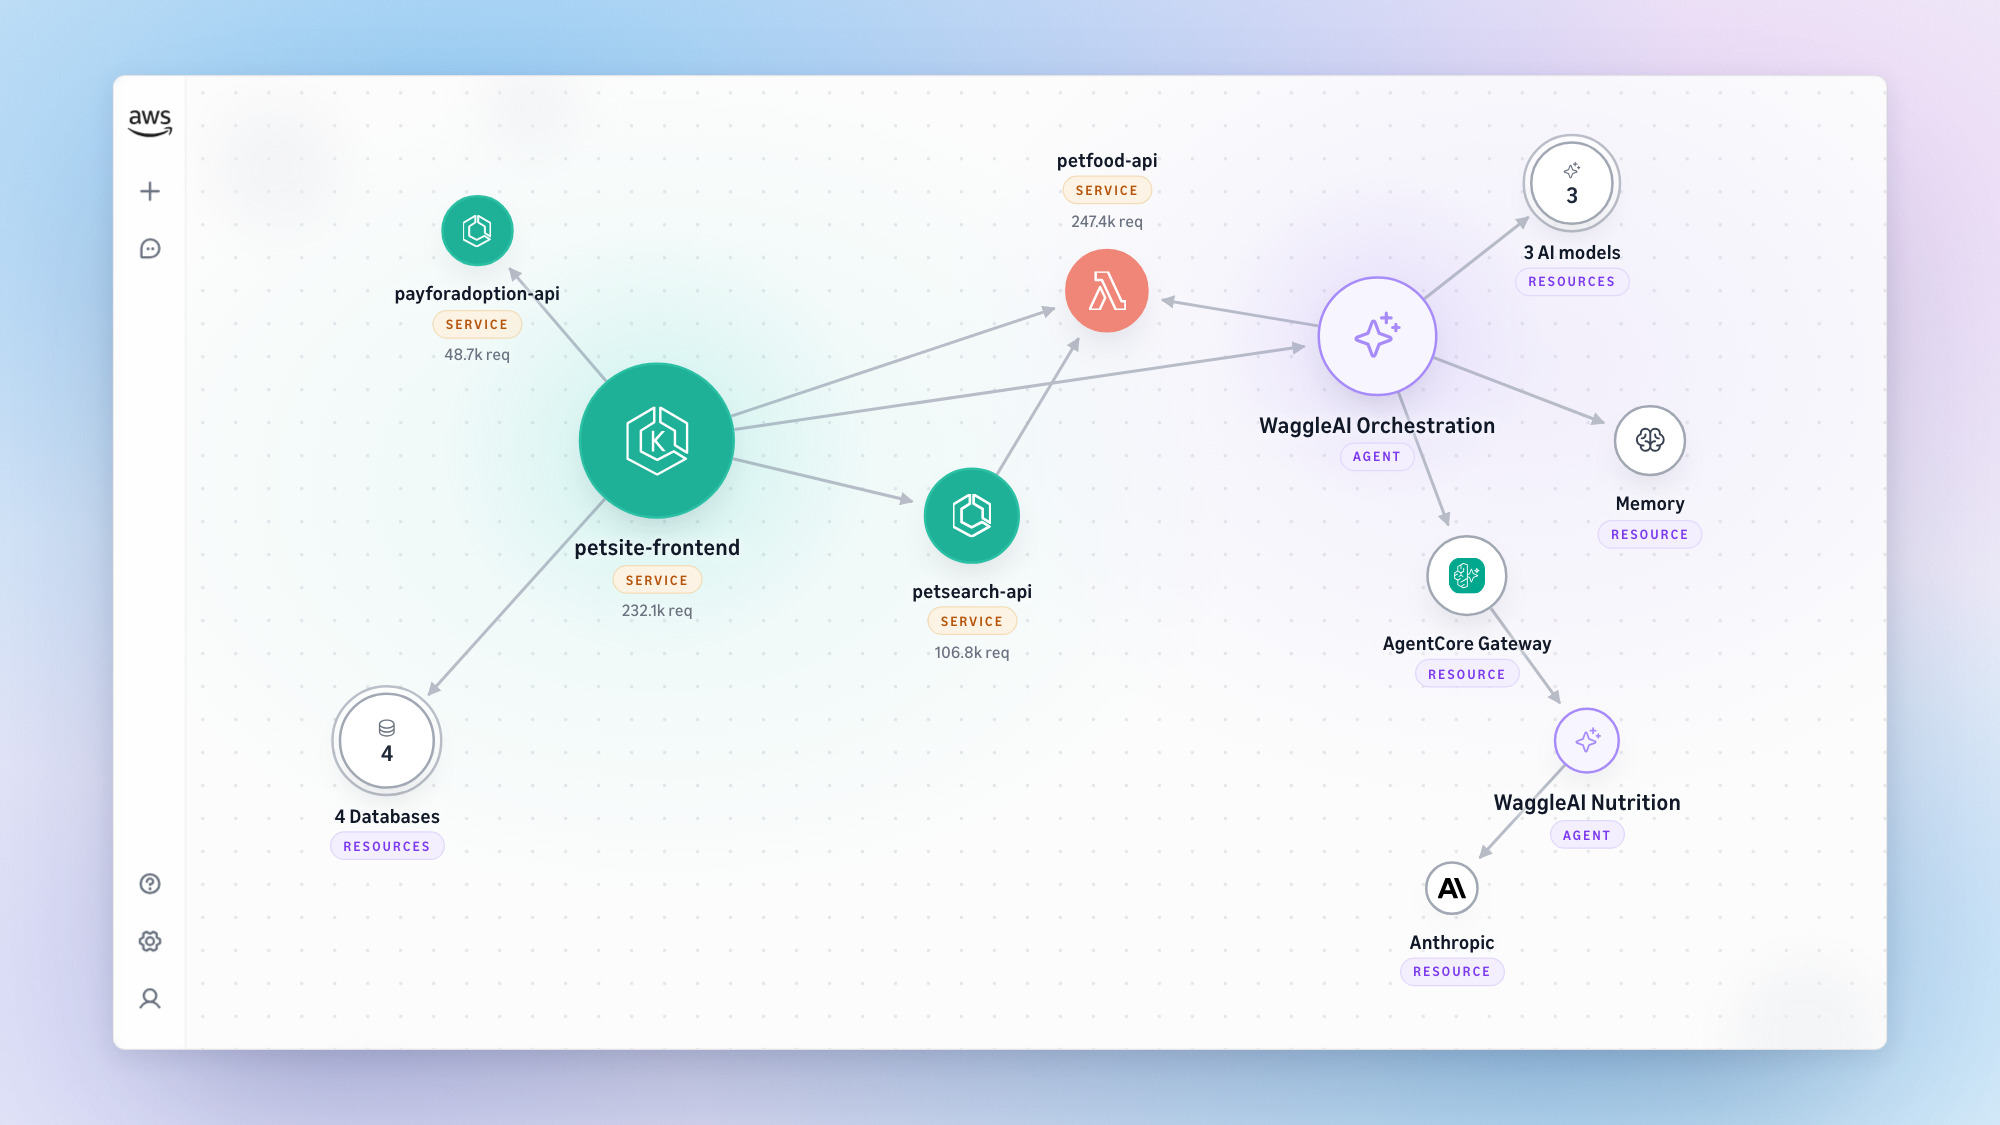
Get a unified view of your generative AI agents, applications, workloads, and the infrastructure that powers them. CloudWatch connects metrics, logs, and traces to help you quickly understand relationships, spot performance bottlenecks, and uncover hidden dependencies without jumping between tools.
CloudWatch Omni, the next generation of CloudWatch offers a re-imagined, AI-powered observability experience built on open standards and delivered where you already work. It embraces openness at its core, working with your existing stack, frameworks, and languages through native OpenTelemetry support. Developers building AI agents get eval-driven observability with continuous quality signals on every invocation, right inside VS Code, Kiro, or Cursor. Operators get application-centric intelligence with auto topology discovery, AI-powered investigation, and fleet-level dashboards, no AWS Console required. The result is one unified experience where you can see agent behavior alongside your applications, all observable from a single place.
Explore Application Performance Monitoring (APM) features
Explore CloudWatch Omni
AI and Agent Observability
Monitor your AI agents with the same confidence you monitor your applications. CloudWatch provides purpose-built observability for AI workloads, giving you full visibility into agent execution paths, model inference performance, and multi-step workflows. Trace every invocation end to end, run continuous evaluations on real user sessions, and pinpoint failures across complex, autonomous systems. With native support for popular agent frameworks including LangChain, LangGraph, CrewAI, OpenAI Agents SDK, Vercel AI SDK, and Strands, CloudWatch works with your existing stack through OpenTelemetry.
Explore Generative AI Observability features
With CloudWatch Omni, agent observability extends into your IDE. Instrument agents with a single prompt, trace execution paths, run evaluations, and experiment on prompt and model configurations without leaving VS Code, Kiro, or Cursor. See agent behavior alongside your applications in one unified view, with eval-driven quality signals that close the observe-evaluate-iterate loop right where you build.
Simplify operations
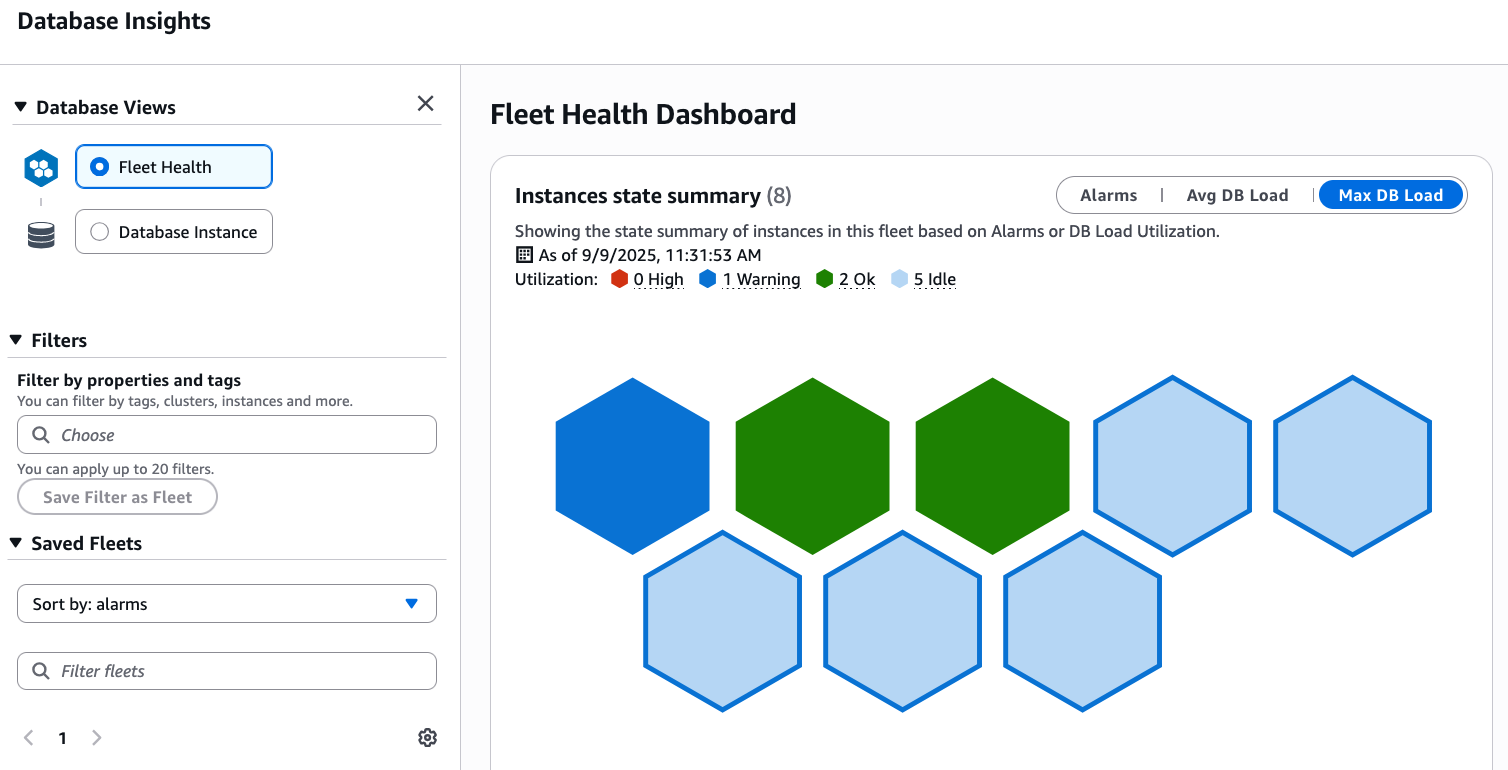
Improve operational efficiency with built-in insights for databases, containers, and serverless such as Lambda—no need to build from scratch. CloudWatch also integrates with popular open-source monitoring and observability solutions like Prometheus and Grafana, plus it supports OpenTelemetry standards, giving you the flexibility to use the best approach for your needs.
Let AI help you
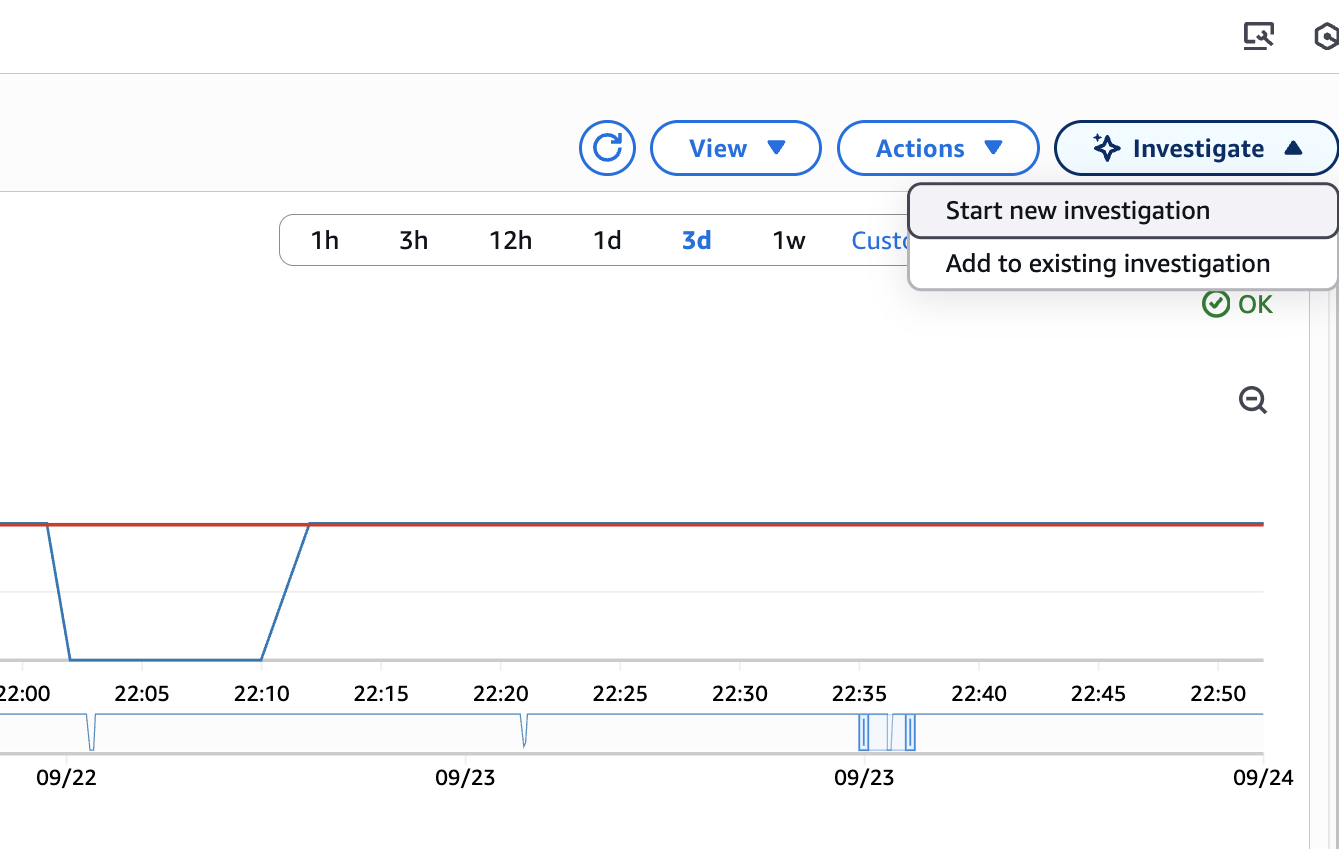
Find and resolve issues with AI-powered CloudWatch investigations and Anomaly Detection. Ask questions in plain English to quickly search logs and metrics—natural language query transforms your questions into precise queries automatically. Connect your own agents directly to your CloudWatch data through Model Context Protocol (MCP) servers for integration with your existing AI workflows. Start troubleshooting from wherever you work.
Troubleshoot smarter, not harder
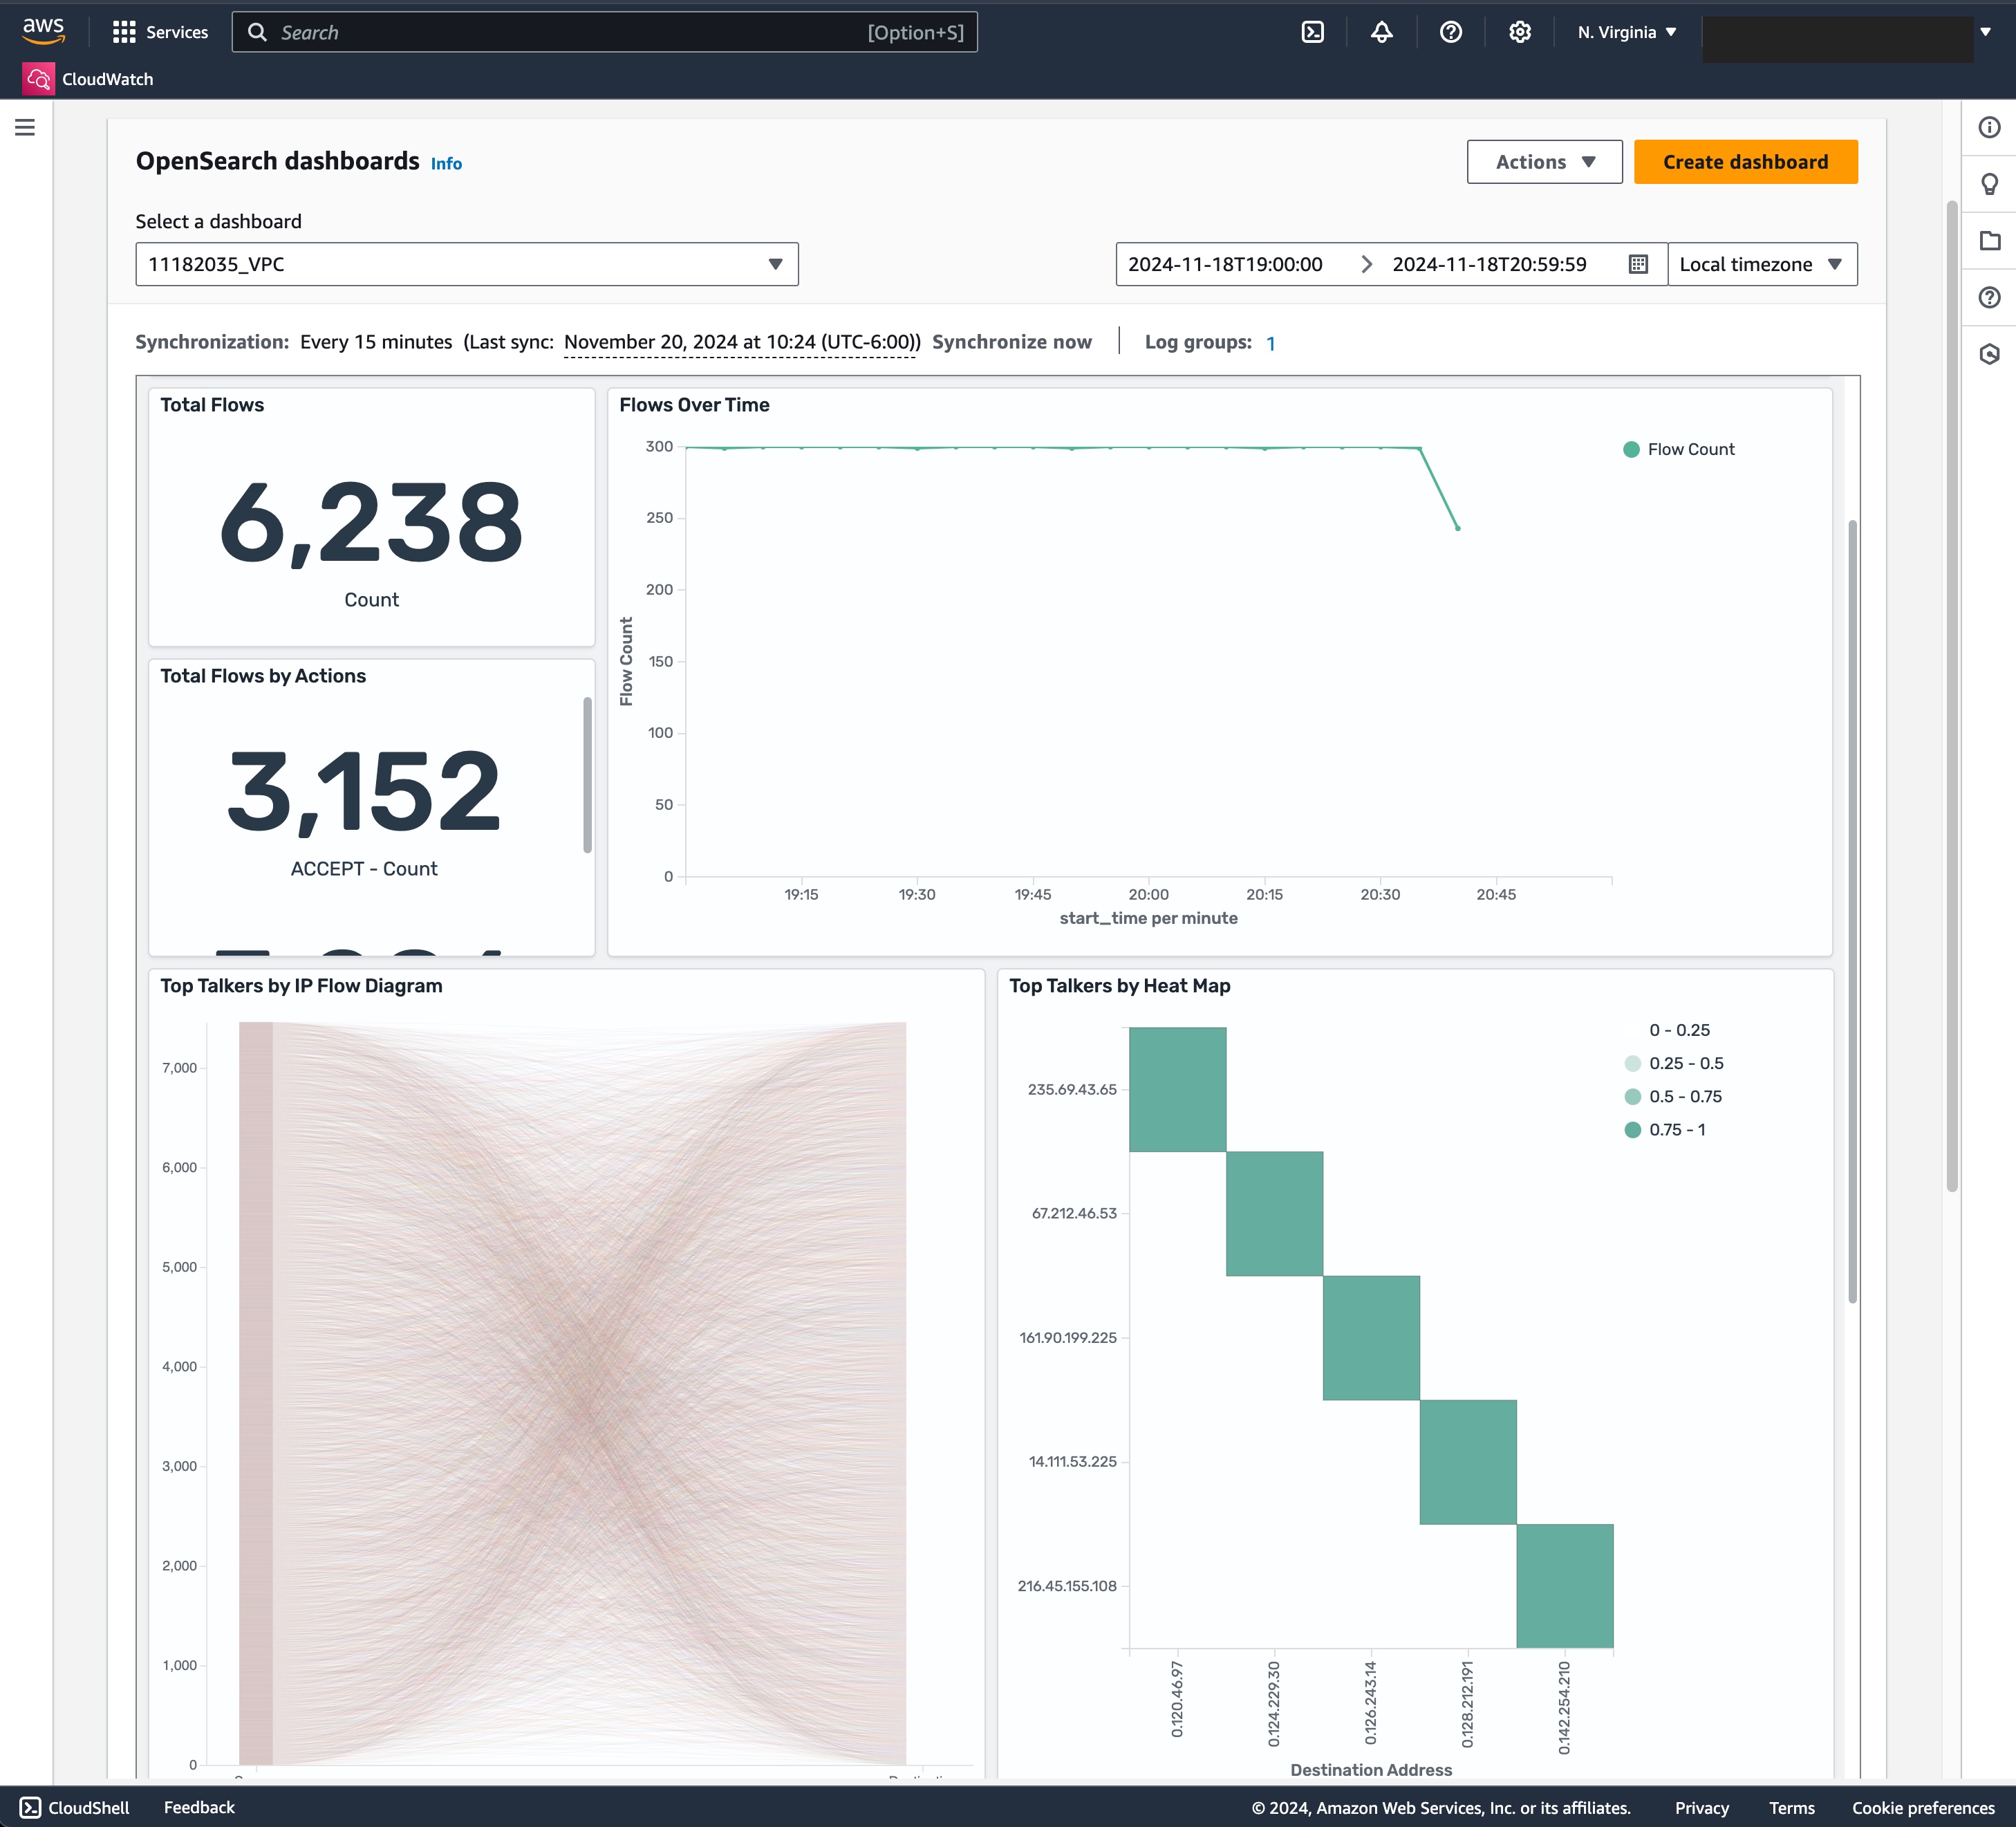
Get analytics and insights your way with flexible capabilities that deliver intelligence wherever you need it. Choose out-of-the-box dashboards, build custom queries with plain English or popular languages such as SQL, or access embedded insights that surface automatically within your workflow.
Capabilities
Operate intelligently with AIOps
Transform how you identify, investigate, and resolve operational issues with AIOps capabilities. Rapidly diagnose complex problems across your AWS environment using AI-powered root cause analysis through CloudWatch investigations, or create tailored workflows through supporting capabilities such as MCP servers and Strands Agent SDK.
Navigate interconnected operational data using simple conversational questions. Surface critical patterns, interpret anomalies, and generate actionable summaries in seconds. Whether investigating performance degradation, analyzing trends, or responding to incidents, CloudWatch AIOps features can make it easy.

Monitor and evaluate generative AI agents
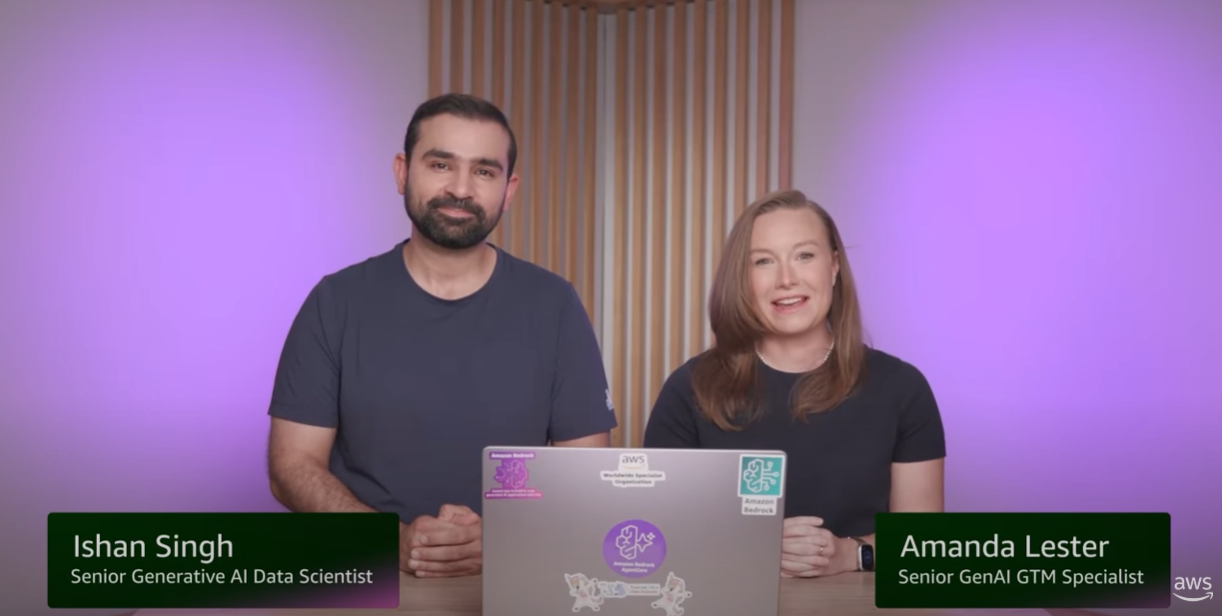
Amazon CloudWatch Omni brings eval-driven observability to AI agents so you not only see whether your agent responded, but whether it responded well. Trace full execution paths, run continuous evaluations on every invocation, and catch silent quality regressions before your users. Bring your own frameworks, your own evaluators, and work from your IDE or a standalone web UI. No context-switching required. Plus, get complete infrastructure visibility with latency, token usage, and error signals across Amazon Bedrock AgentCore capabilities.
Explore GenAI Observability features
Explore CloudWatch Omni
See your full stack in one place
Monitor your entire environment—from infrastructure and applications to real users and synthetic tests—all in one place. Amazon CloudWatch provides a unified observability solution that simplifies monitoring, consolidates tools, and accelerates troubleshooting across workloads.

Instrument once
Simplify instrumentation and maintain vendor flexibility with native support for open standards. CloudWatch now natively ingests OpenTelemetry metrics and supports PromQL for querying, so teams can collect, process, and query metrics, logs, and traces from any environment using the tools they already know. Bring your existing Prometheus dashboards and alerting workflows to CloudWatch without rewriting queries or re-instrumenting your stack. Consistent, end-to-end visibility across open-source and AWS-native observability tools.
Learn more about OpenTelemetry metrics
Discover OpenTelemetry support

Monitor workloads anywhere
Monitor your workloads hosted on AWS, on premises, and on other clouds by ingesting telemetry data using the OpenTelemetry-compatible CloudWatch agent. Ingestion charges are the same whether data originates in AWS or elsewhere.



Did you find what you were looking for today?
Let us know so we can improve the quality of the content on our pages