AWS News Blog
New – API & CloudFormation Support for Amazon CloudWatch Dashboards
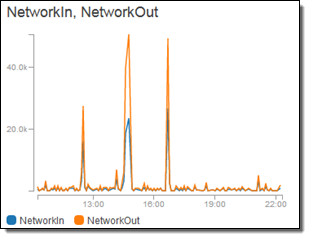
We launched CloudWatch Dashboards a couple of years ago. In the post that I wrote for the launch, I showed you how to interactively create a dashboard that displayed chosen CloudWatch metrics in graphical form. After the launch, we added additional features including a full screen mode, a dark theme, control over the range of the Y axis, simplified renaming, persistent storage, and new visualization options.
New API & CLI
While console support is wonderful for interactive use, many customers have asked us to support programmatic creation and manipulation of dashboards and the widgets within. They would like to dynamically build and maintain dashboards, adding and removing widgets as the corresponding AWS resources are created and destroyed. Other customers are interested in setting up and maintaining a consistent set of dashboards across two or more AWS accounts.
I am happy to announce that API, CLI, and AWS CloudFormation support for CloudWatch Dashboards is available now and that you can start using it today!
There are four new API functions (and equivalent CLI commands):
ListDashboards / aws cloudwatch list-dashboards – Fetch a list of all dashboards within an account, or a subset that share a common prefix.
GetDashboard / aws cloudwatch get-dashboard – Fetch details for a single dashboard.
PutDashboard / aws cloudwatch put-dashboard – Create a new dashboard or update an existing one.
DeleteDashboards / aws cloudwatch delete-dashboards – Delete one or more dashboards.
Dashboard Concepts
I want to show you how to use these functions and commands. Before I dive in, I should review a couple of important dashboard concepts and attributes.
 Global – Dashboards are part of an AWS account, and are not associated with a specific AWS Region. Each account can have up to 500 dashboards.
Named – Each dashboard has a name that is unique within the AWS account. Names can be up to 255 characters long.
Grid Model – Each dashboard is composed of a grid of cells. The grid is 24 cells across and as tall as necessary. Each widget on the dashboard is positioned at a particular set of grid coordinates, and has a size that spans an integral number of grid cells.
Widgets (Visualizations) – Each widget can display text or a set of CloudWatch metrics. Text is specified using Markdown; metrics can be displayed as single values, line charts, or stacked area charts. Each dashboard can have up to 100 widgets. Widgets that display metrics can also be associated with a CloudWatch Alarm.
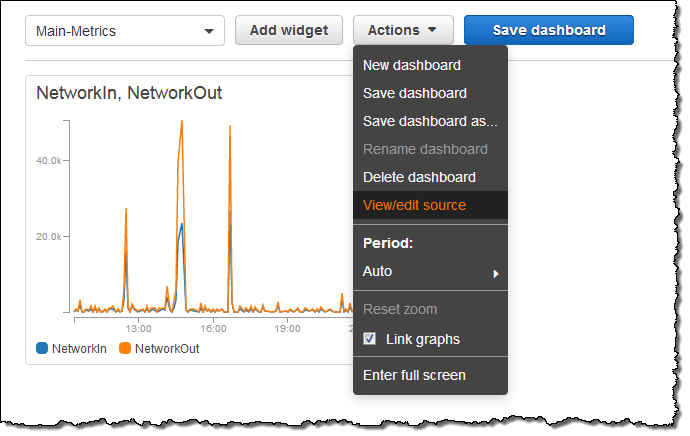
Dashboards have a JSON representation that you can now see and edit from within the console. Simply click on the Action menu and choose View/edit source:
Here’s the source for my dashboard:
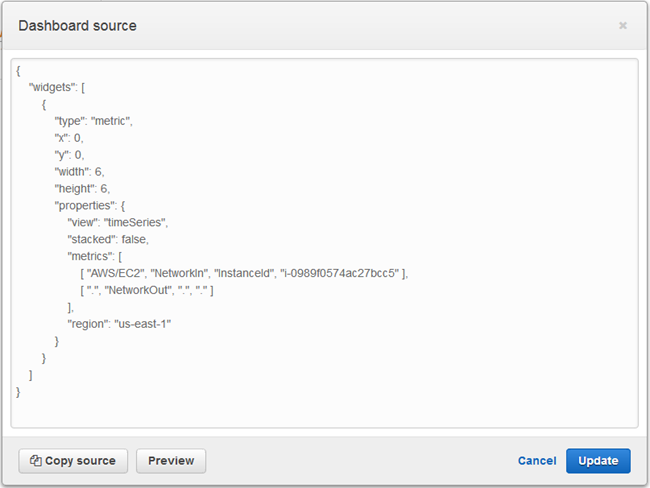
You can use this JSON as a starting point for your own applications. As you can see, there’s an entry in the widgets array for each widget on the dashboard; each entry describes one widget, starting with its type, position, and size.
Creating a Dashboard Using the API
Let’s say I want to create a dashboard that has a widget for each of my EC2 instances in a particular region. I’ll use Python and the AWS SDK for Python, and start as follows (excuse the amateur nature of my code):
Then I simply iterate over the instances, creating a widget dictionary for each one, and appending it to the widgets array:
I update the position (x and y) within the loop, and form a grid (if I don’t specify positions, the widgets will be laid out left to right, top to bottom):
After I have processed all of the instances, I create a JSON version of the widget array:
And I create or update my dashboard:
I run the code, and get the following dashboard:
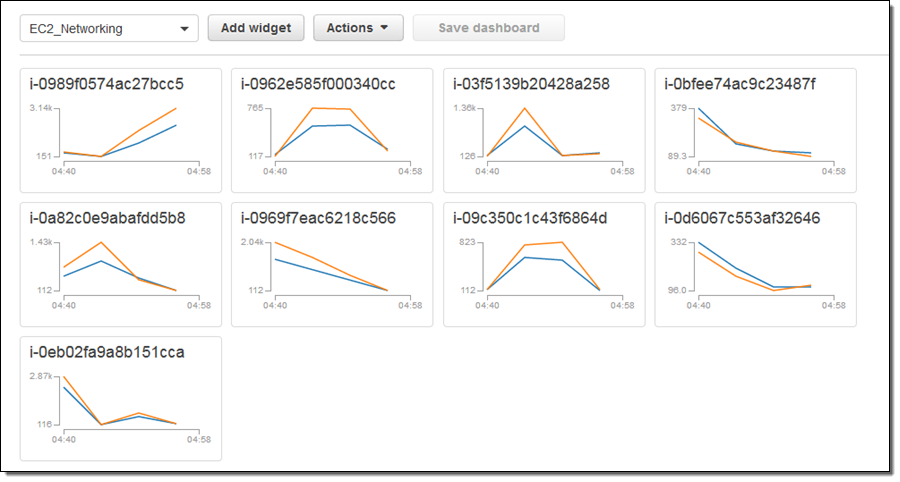
The CloudWatch team recommends that dashboards created programmatically include a text widget indicating that the dashboard was generated automatically, along with a link to the source code or CloudFormation template that did the work. This will discourage users from making manual, out-of-band changers to the dashboards.
As I mentioned earlier, each metric widget can also be associated with a CloudWatch Alarm. You can create the alarms programmatically or by using a CloudFormation template such as the Sample CPU Utilization Alarm. If you decide to do this, the alarm threshold will be displayed in the widget. To learn more about this, read Tara Walker’s recent post, Amazon CloudWatch Launches Alarms on Dashboards.
Going one step further, I could use CloudWatch Events and a Lamba Function to track the creation and deletion of certain resources and update a dashboard in concert with the changes. To learn how to do this, read Keeping CloudWatch Dashboards up to Date Using AWS Lambda.
Accessing a Dashboard Using the CLI
I can also access and manipulate my dashboards from the command line. For example, I can generate a simple list:
And I can get rid of the Disk-Metrics dashboard:
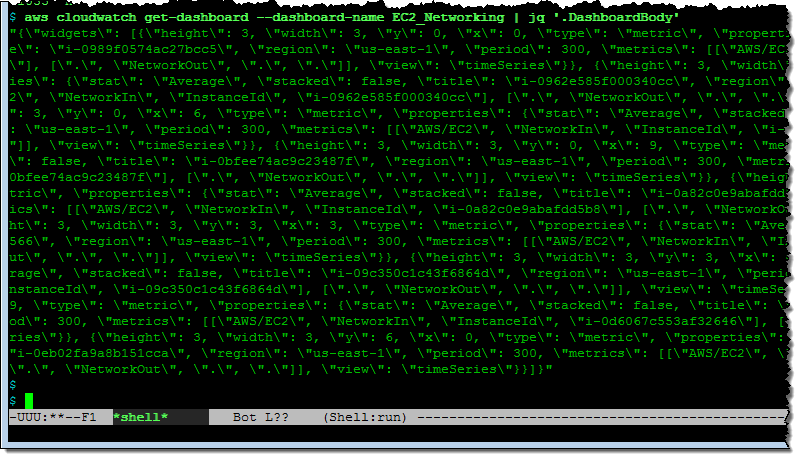
I can also retrieve the JSON that defines a dashboard:
Creating a Dashboard Using CloudFormation
Dashboards can also be specified in CloudFormation templates. Here’s a simple template in YAML (the DashboardBody is still specified in JSON):
I place the template in a file and then create a stack using the console or the CLI:
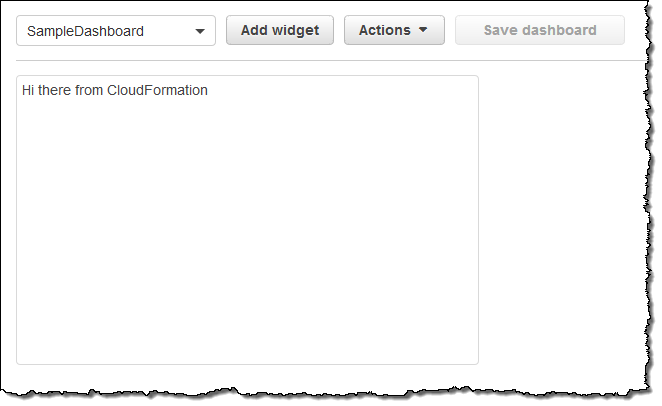
Here’s the dashboard:
Available Now
This feature is available now and you can start using it today. You can create 3 dashboards with up to 50 metrics per dashboard at no charge; additional dashboards are priced at $3 per month, as listed on the CloudWatch Pricing page. You can make up to 1 million calls to the new API functions each month at no charge; beyond that you pay $.01 for every 1,000 calls.
— Jeff;