AWS Big Data Blog
How Realtor.com Monitors Amazon Athena Usage with AWS CloudTrail and Amazon QuickSight
| February 2023 Update: Console access to the AWS Data Pipeline service will be removed on April 30, 2023. On this date, you will no longer be able to access AWS Data Pipeline though the console. You will continue to have access to AWS Data Pipeline through the command line interface and API. Please note that AWS Data Pipeline service is in maintenance mode and we are not planning to expand the service to new regions. For information about migrating from AWS Data Pipeline, please refer to the AWS Data Pipeline migration documentation. |
This is a customer post by Ajay Rathod, a Staff Data Engineer at Realtor.com.
Realtor.com, in their own words: Realtor.com®, operated by Move, Inc., is a trusted resource for home buyers, sellers, and dreamers. It offers the most comprehensive database of for-sale properties, among competing national sites, and the information, tools, and professional expertise to help people move confidently through every step of their home journey.
Move, Inc. processes hundreds of terabytes of data partitioned by day and hour. Various teams run hundreds of queries on this data. Using AWS services, Move, Inc. has built an infrastructure for gathering and analyzing data:
- The data is obtained from various sources.
- The data is then loaded into an Amazon S3 data lake with Amazon Kinesis and AWS Data Pipeline.
- To increase the effectiveness of the storage and subsequent querying, the data is converted into a Parquet format, and stored again in S3.
- Amazon Athena is used as the SQL (Structured Query Language) engine to query the data in S3. Athena is easy to use and is often quickly adopted by various teams.
- Teams visualize query results in Amazon QuickSight. Amazon QuickSight is a business analytics service that allows you to quickly and easily visualize data and collaborate with other users in your account.
- Data access is controlled by AWS Identity and Access Management (IAM) roles.
This architecture is known as the data platform and is shared by the data science, data engineering, and the data operations teams within the organization. Move, Inc. also enables other cross-functional teams to use Athena. When many users use Athena, it helps to monitor its usage to ensure cost-effectiveness. This leads to a strong need for Athena metrics that can give details about the following:
- Users
- Amount of data scanned (to monitor the cost of AWS service usage)
- The databases used for queries
- Actual queries that teams run
Currently, the Move, Inc. team does not have an easy way of obtaining all these metrics from a single tool. Having a way to do this would greatly simplify monitoring efforts. For example, the data operations team wants to collect several metrics every day obtained from queries run on Athena for their data. They require the following metrics:
- Amount of data scanned by each user
- Number of queries by each user
- Databases accessed by each user
In this post, I discuss how to build a solution for monitoring Athena usage. To build this solution, you rely on AWS CloudTrail. CloudTrail is a web service that records AWS API calls for your AWS account and delivers log files to an S3 bucket.
Solution
Here is the high-level overview:
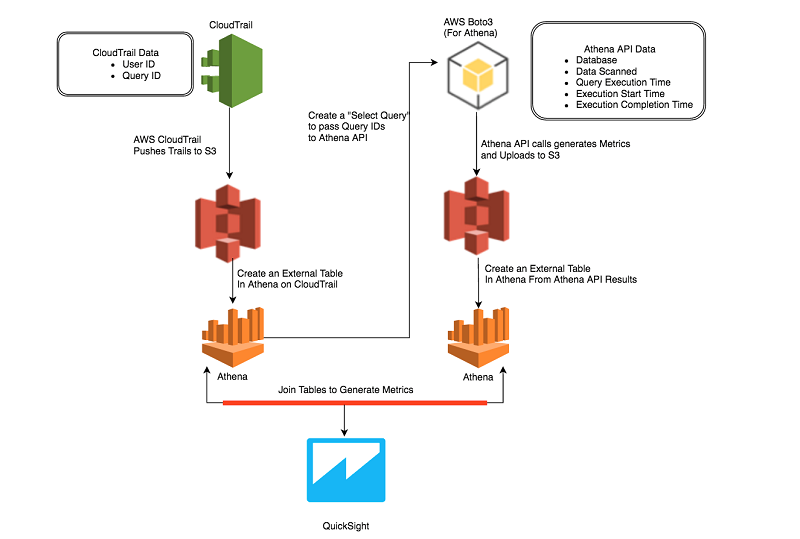
- Use the CloudTrail API to audit the user queries, and then use Athena to create a table from the CloudTrail logs.
- Query the Athena API with the AWS CLI to gather metrics about the data scanned by the user queries and put this information into another table in Athena.
- Combine the information from these two sources by joining the two tables.
- Use the resulting data to analyze, build insights, and create a dashboard that shows the usage of Athena by users within different teams in the organization.
The architecture of this solution is shown in the following diagram.

Take a look at this solution step by step.
IAM and permissions setup
This solution uses CloudTrail, Athena, and S3. Make sure that the users who run the following scripts and steps have the appropriate IAM roles and policies. For more information, see Tutorial: Delegate Access Across AWS Accounts Using IAM Roles.
Step 1: Create a table in Athena for data in CloudTrail
The CloudTrail API records all Athena queries run by different teams within the organization. These logs are saved in S3. The fields of most interest are:
- User identity
- Start time of the API call
- Source IP address
- Request parameters
- Response elements returned by the service
When end users make queries in Athena, these queries are recorded by CloudTrail as responses from Athena web service calls. In these responses, each query is represented as a JSON (JavaScript Object Notation) string.
You can use the following CREATE TABLE statement to create the cloudtrail_logs table in Athena. For more information, see Querying CloudTrail Logs in the Athena documentation.
Step 2: Create a table in Amazon Athena for data from API output
Athena provides an API that can be queried to obtain information of a specific query ID. It also provides an API to obtain information of a batch of query IDs, with a batch size of up to 50 query IDs.
You can use this API call to obtain information about the Athena queries that you are interested in and store this information in an S3 location. Create an Athena table to represent this data in S3. For the purpose of this post, the response fields that are of interest are as follows:
- QueryExecutionId
- Database
- EngineExecutionTimeInMillis
- DataScannedInBytes
- Status
- SubmissionDateTime
- CompletionDateTime
The CREATE TABLE statement for athena_api_output, is as follows:
You can inspect the query IDs and user information for the last day. The query is as follows:
Step 3: Obtain Query Statistics from Athena API
You can write a simple Python script to loop through queries in batches of 50 and query the Athena API for query statistics. You can use the Boto library for these lookups. Boto is a library that provides you with an easy way to interact with and automate your AWS development. The response from the Boto API can be parsed to extract the fields that you need as described in Step 2.
An example Python script is available in the AthenaMetrics GitHub repo.
Format these fields, for each query ID, as CSV strings and store them for the entire batch response in an S3 bucket. This S3 bucket is represented by the table created in Step 2, cloudtrail_logs.
In your Python code, create a variable named sql_query, and assign it a string representing the SQL query defined in Step 2. The s3_query_folder is the location in S3 that is used by Athena for storing results of the query. The code is as follows:
You can iterate through the results in the response object and consolidate them in batches of 50 results. For each batch, you can invoke the Athena API, batch-get-query-execution.
Store the output in the S3 location pointed to by the CREATE TABLE definition for the table athena_api_output, in Step 2. The SQL statement above returns only queries run in the last 24 hours. You may want to increase that to get usage over a longer period of time. The code snippet for this API call is as follows:
The batchqueryids value is an array of 50 query IDs extracted from the result set of the SELECT query. This script creates the data needed by your second table, athena_api_output, and you are now ready to join both tables in Athena.
Step 4: Join the CloudTrail and Athena API data
Now that the two tables are available with the data that you need, you can run the following Athena query to look at the usage by user. You can limit the output of this query to the most recent five days.
Step 5: Analyze and visualize the results
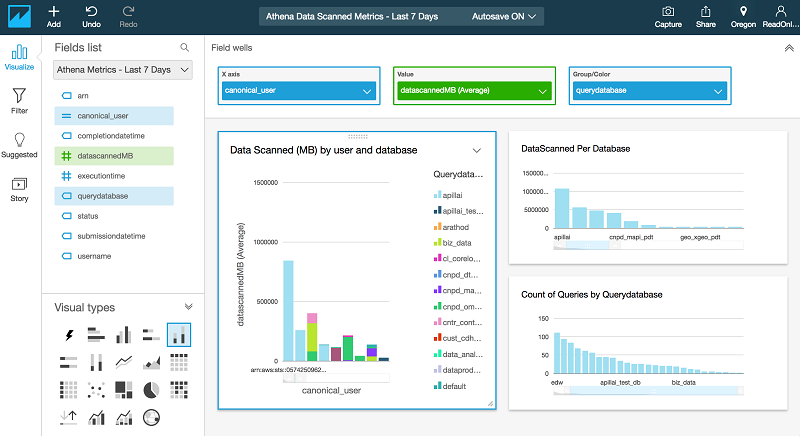
In this step, using QuickSight, you can create a dashboard that shows the following metrics:
- Average amount of data scanned (MB) by a user and database
- Number of queries per user
- Count of queries per database
For more information, see Working with Dashboards.

Conclusion
Using the solution described in this post, you can continuously monitor the usage of Athena by various teams. Taking this a step further, you can automate and set user limits for how much data the Athena users in your team can query within a given period of time. You may also choose to add notifications when the usage by a particular user crosses a specified threshold. This helps you manage costs incurred by different teams in your organization.
Realtor.com would like to acknowledge the tremendous support and guidance provided by Hemant Borole, Senior Consultant, Big Data & Analytics with AWS Professional Services in helping to author this post.
Additional Reading
If you found this post useful, be sure to check out Build a Schema-on-Read Analytics Pipeline Using Amazon Athena and Query and Visualize AWS Cost and Usage Data Using Amazon Athena and Amazon QuickSight.

About the Author

Ajay Rathod is Staff Data Engineer at Realtor.com. With a deep background in AWS Cloud Platform and Data Infrastructure, Ajay leads the Data Engineering and automation aspect of Data Operations at Realtor.com. He has designed and deployed many ETL pipelines and workflows for the Realtor Data Analytics Platform using AWS services like Data Pipeline, Athena, Batch, Glue and Boto3. He has created various operational metrics to monitor ETL Pipelines and Resource Usage.