AWS Big Data Blog
Build governance dashboards for Amazon SageMaker Catalog with Amazon Quick
Maintaining visibility into your data catalog’s health requires more than ad-hoc queries. Data stewards and compliance teams need automated dashboards that surface governance metrics and alert them when issues arise. These issues include undocumented assets, missing ownership, and stale metadata.
In a previous post, we showed you how to query Amazon SageMaker Catalog metadata using SQL by using the metadata export feature. This post builds on that foundation by demonstrating how to create governance dashboards with Amazon Quick.
Amazon Quick is an agentic AI-powered digital workspace that provides integrated analytics, automation, and research capabilities. With Amazon Quick Sight, a component of Amazon Quick, you can create interactive dashboards and visualizations with automatic chart suggestions and machine learning (ML) insights.
We walk through how to connect Amazon Quick Sight to your Amazon SageMaker Catalog metadata and build governance dashboards using natural language prompts.
Solution overview
This solution extends the metadata export architecture by adding a visualization layer:
- Amazon SageMaker Catalog exports asset metadata daily to Amazon Simple Storage Service (Amazon S3) Tables
- Amazon Athena queries the metadata using standard SQL
- Amazon Quick Sight connects to Athena for interactive dashboards
- Amazon Quick uses natural language to build visualizations
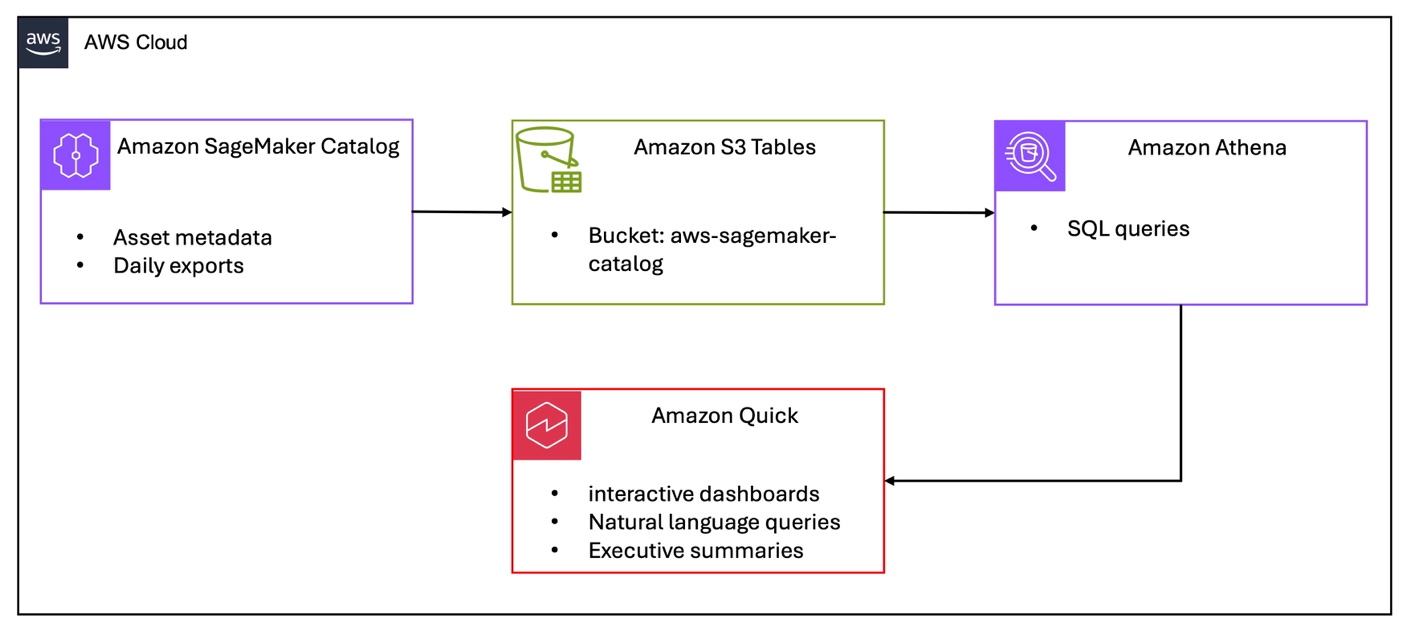
Figure 1 – Amazon SageMaker Catalog governance dashboard architecture
Prerequisites
Before you begin, complete the following steps from Analyzing your data catalog: Query SageMaker Catalog metadata with SQL. You must also have the following:
- Amazon SageMaker Catalog metadata export enabled
- Amazon Athena configured with query results S3 bucket
- AWS Lake Formation permissions configured for AWS Identity and Access Management (IAM)-based access
- Verified that the
asset_metadata.assettable contains data
Additionally, you need:
- Amazon Quick Sight subscription (Standard or Enterprise edition)
- AWS Identity and Access Management permissions to create Amazon Quick Sight datasets and dashboards
Building a governance dashboard with Amazon Quick Sight
To visualize catalog health metrics, connect Amazon Quick Sight to your Athena metadata tables.
Configure Amazon Quick Sight permissions
- Grant permissions to the Amazon Quick Sight service role.
The Amazon Quick Sight service role (default name: aws-quicksight-service-role-v0) needs permissions to access Amazon S3 Tables and AWS Glue catalog:
Add this as an inline policy to the Amazon Quick Sight service role in the IAM console.
- Grant AWS Lake Formation permissions:
Both the Amazon Quick Sight service role and your Amazon Quick Sight admin user need AWS Lake Formation permissions on the S3 Tables catalog. First, find your Amazon Quick Sight admin user ARN by running this AWS Command Line Interface (AWS CLI) command:
Amazon Quick Sight users are managed in the Amazon Quick Sight home AWS Region (us-east-1).To grant permissions, use the Lake Formation console.
- Navigate to AWS Lake Formation in the AWS Management Console.
- Select Data permissions and Grant.
- For Principals, choose SAML users and groups.
- Enter your Amazon Quick Sight admin user ARN (from the preceding command).
- Under LF-Tags or catalog resources, choose Named Data Catalog resources.
- For Catalogs, choose the S3 Tables catalog: ACCOUNT_ID:s3tablescatalog/aws-sagemaker-catalog.
- For Databases, choose asset_metadata.
- Under Tables, choose asset.
- For Table permissions, choose Select and Describe.
- Select Grant.
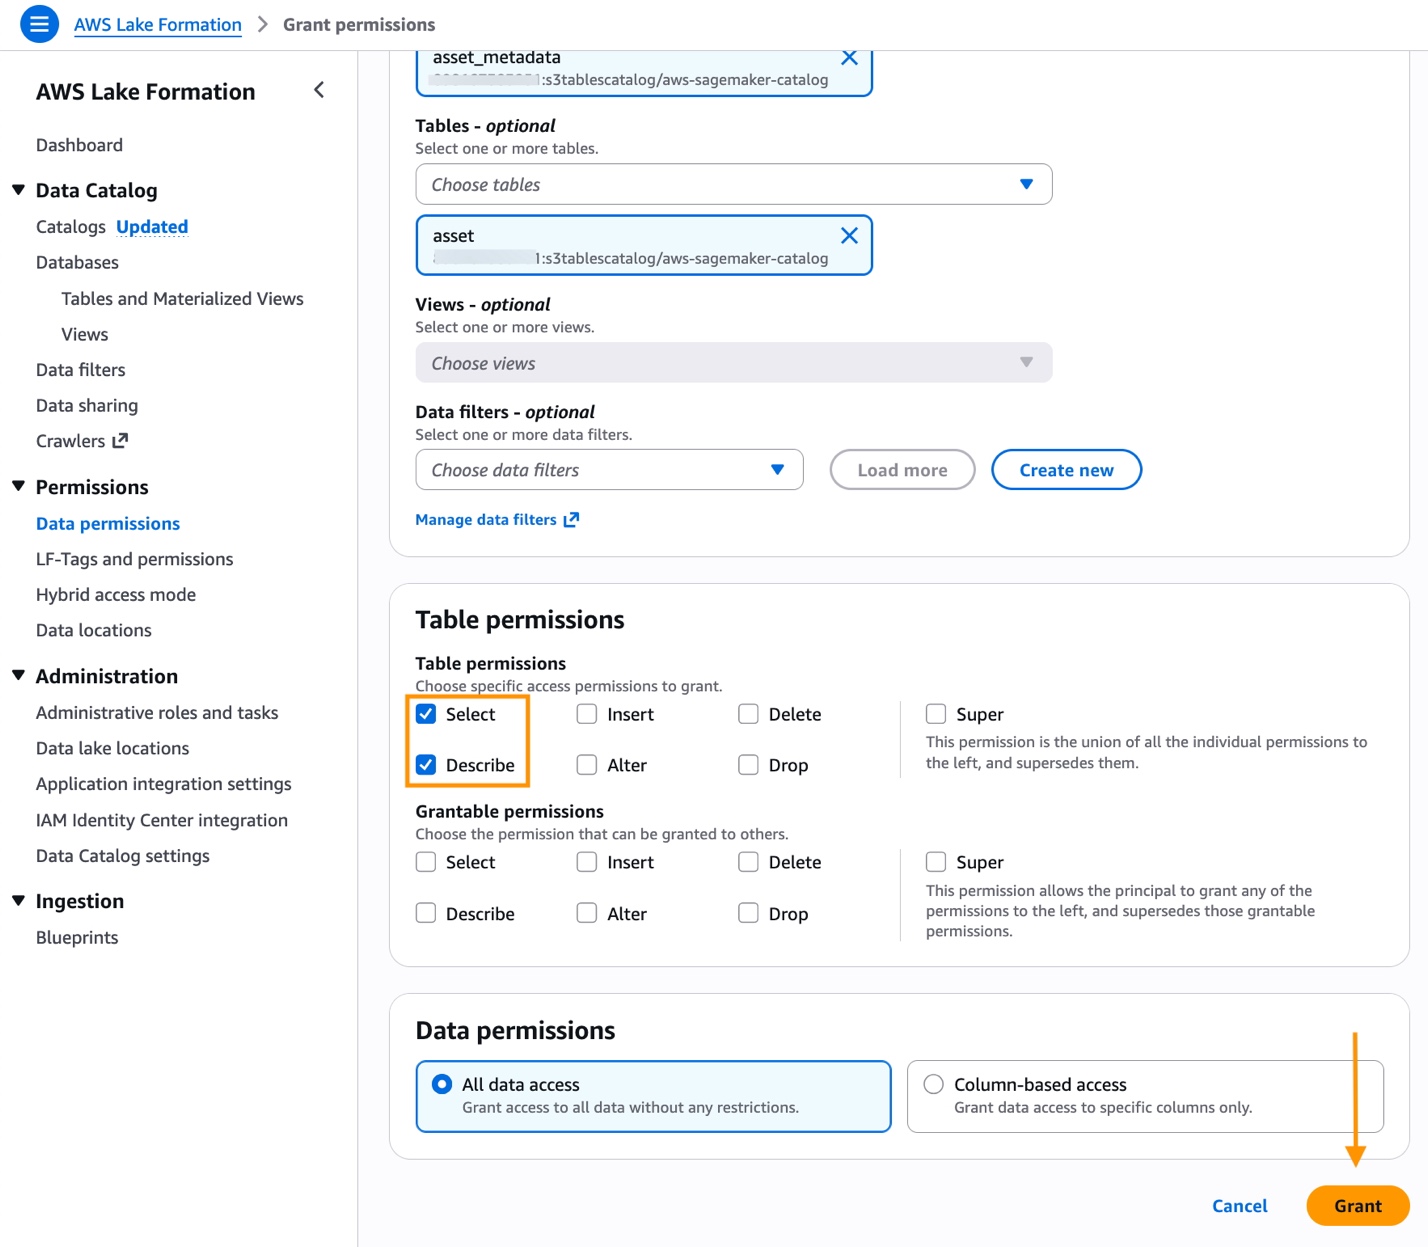
Figure 2 – Grant access to Amazon SageMaker Catalog resources
- Repeat steps 1–9 for the Amazon Quick Sight service role, but in step 2 choose IAM users and roles instead.
When choosing the catalog in the Lake Formation console, you must choose the full S3 Tables catalog identifier (ACCOUNT_ID:s3tablescatalog/aws-sagemaker-catalog) to see the asset_metadata database.
Create an Amazon Quick Sight dataset.
Access S3 Tables data by creating a Quick Sight dataset using an Amazon Athena data source and the custom SQL option. An S3 Tables data source is also available but requires additional permissions. See Introducing new data source with S3 Tables in Amazon Quick for using S3 Tables as an Amazon Quick data source.
- Open Amazon Quick Sight in the AWS Management Console.
- Select Analyses and Create analysis.
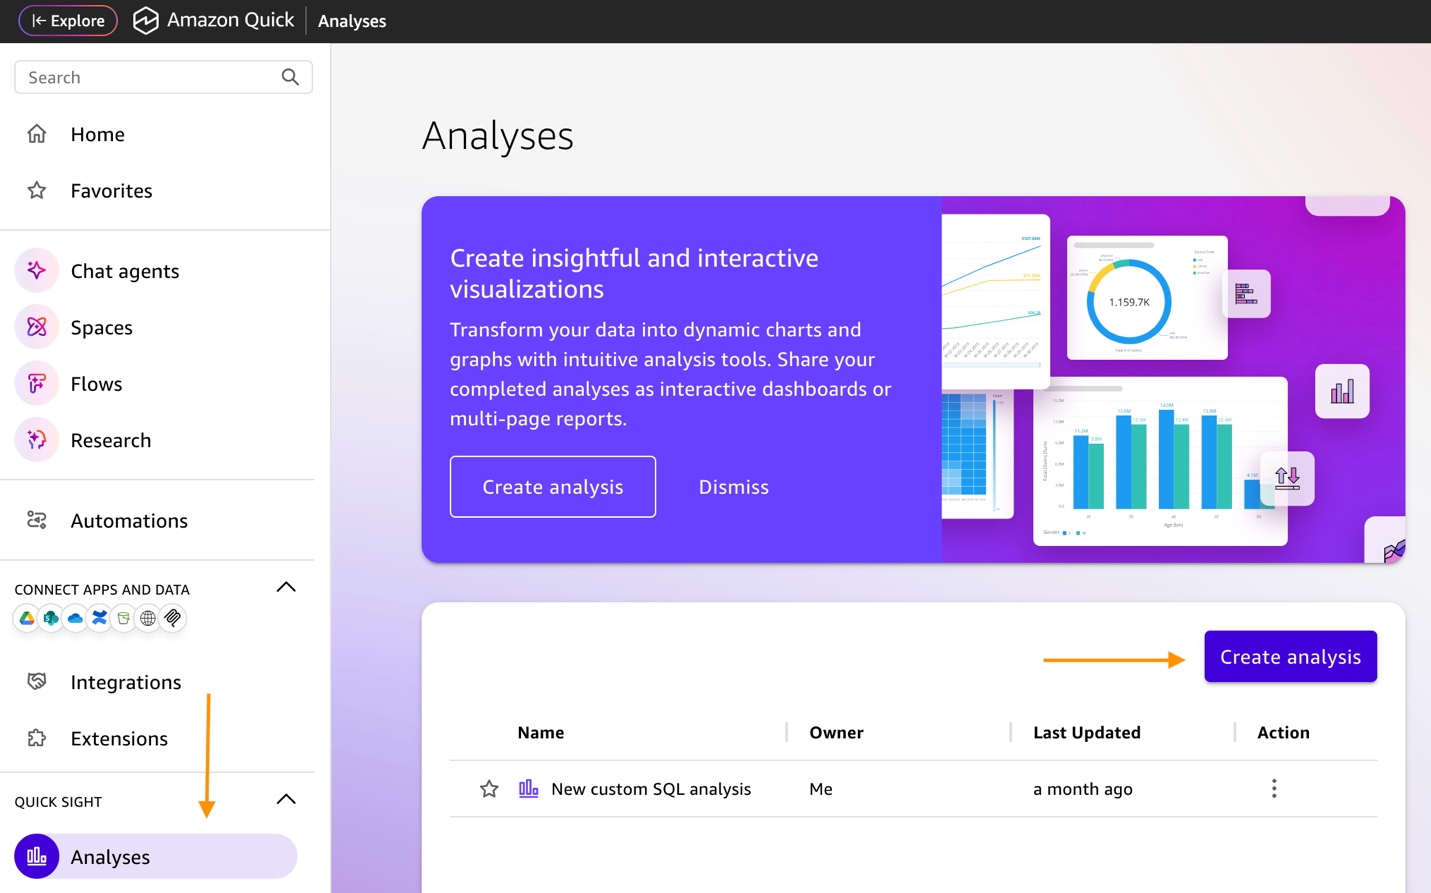
Figure 3 – Create Amazon Quick Sight analysis
- Choose Create dataset and Create data source.
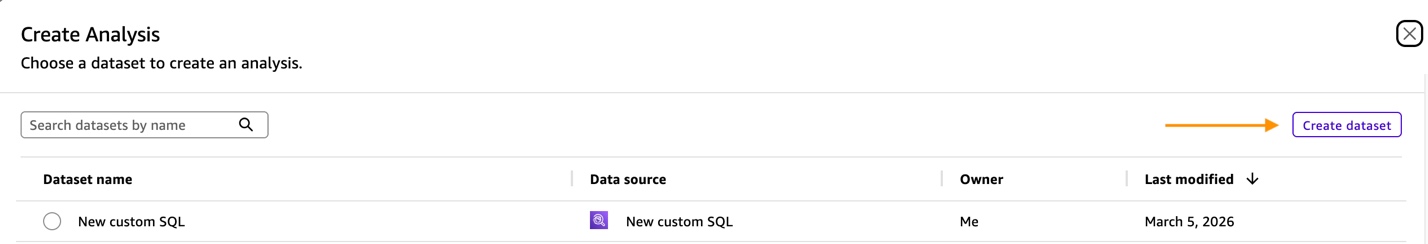
Figure 4 – Create dataset
- Select Amazon Athena as the data source and select Next.
- Enter a Data source name (for example, “SageMaker Catalog Metadata”) and choose Create data source.
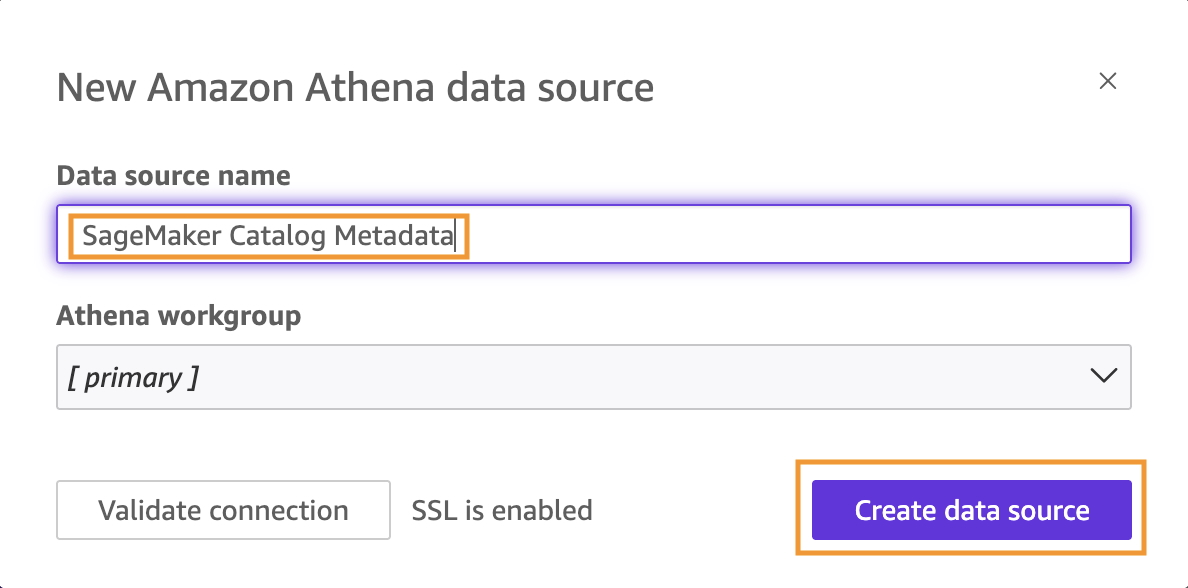
Figure 5 – Create data source
- Select Use custom SQL and enter a custom SQL query that references the S3 Tables catalog using the full three-part name.
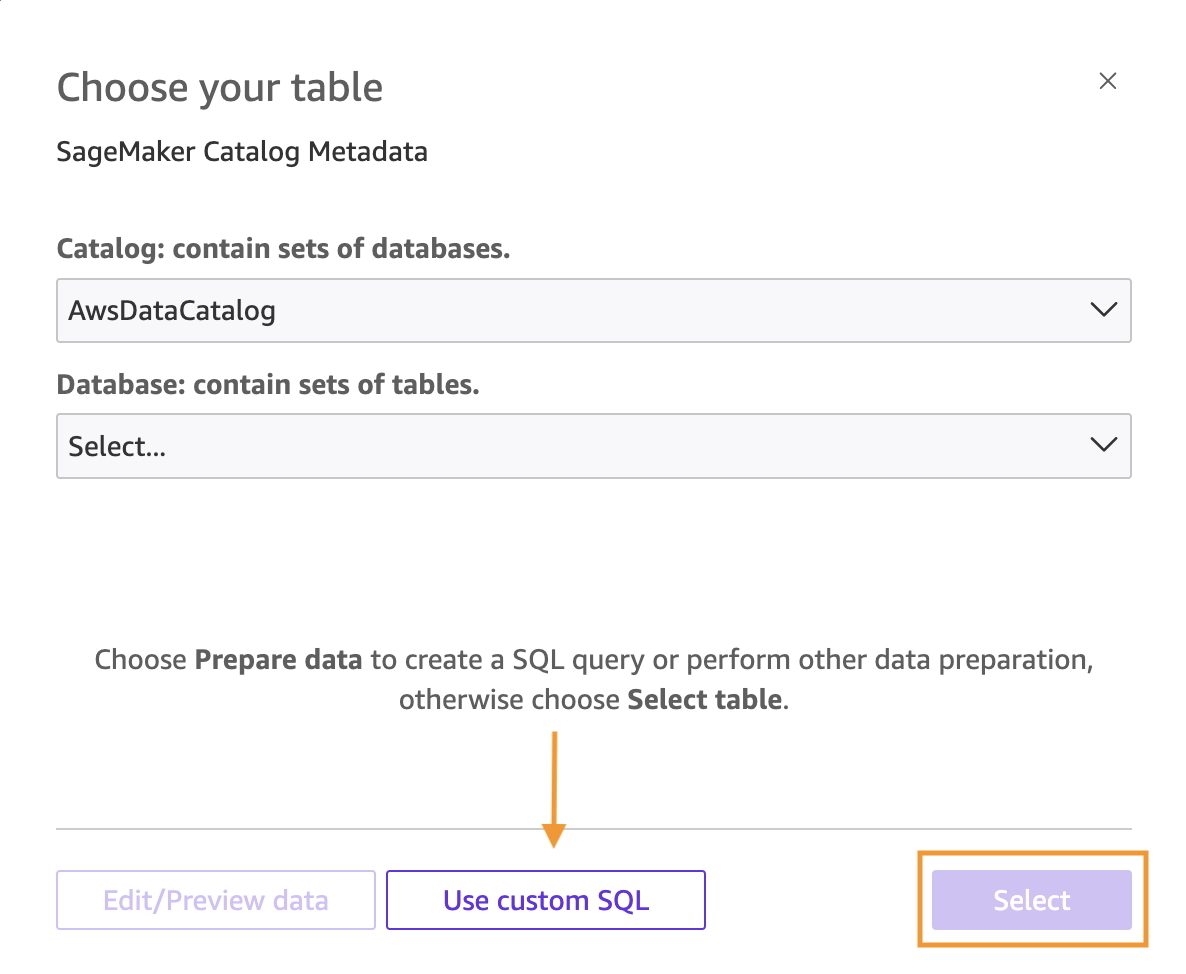
Figure 6 – Use custom SQL
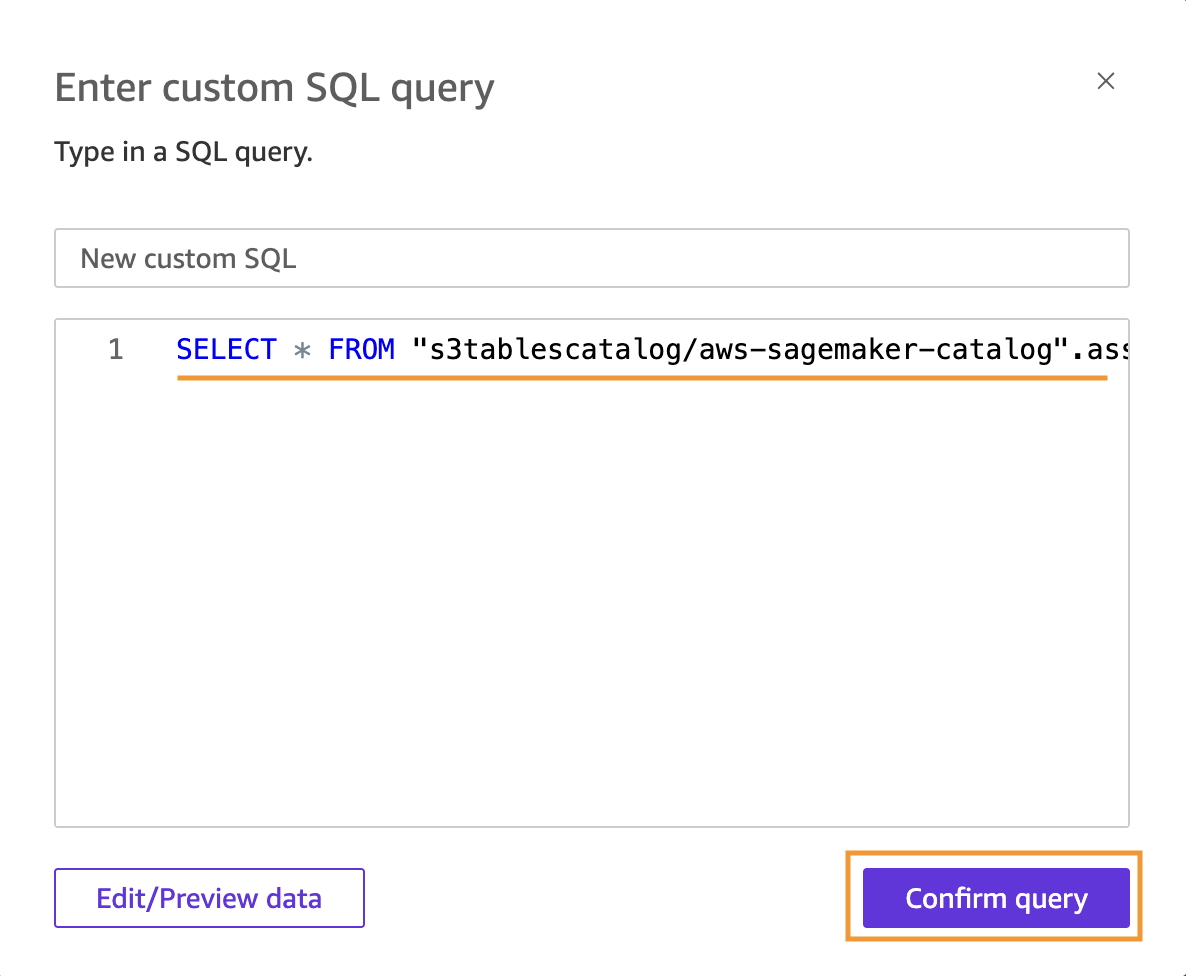
Figure 7 – Enter custom SQL
SELECT * FROM "s3tablescatalog/aws-sagemaker-catalog".asset_metadata.asset
- Select Confirm query.
- Choose Directly query your data (SPICE import may fail with S3 Tables catalogs)
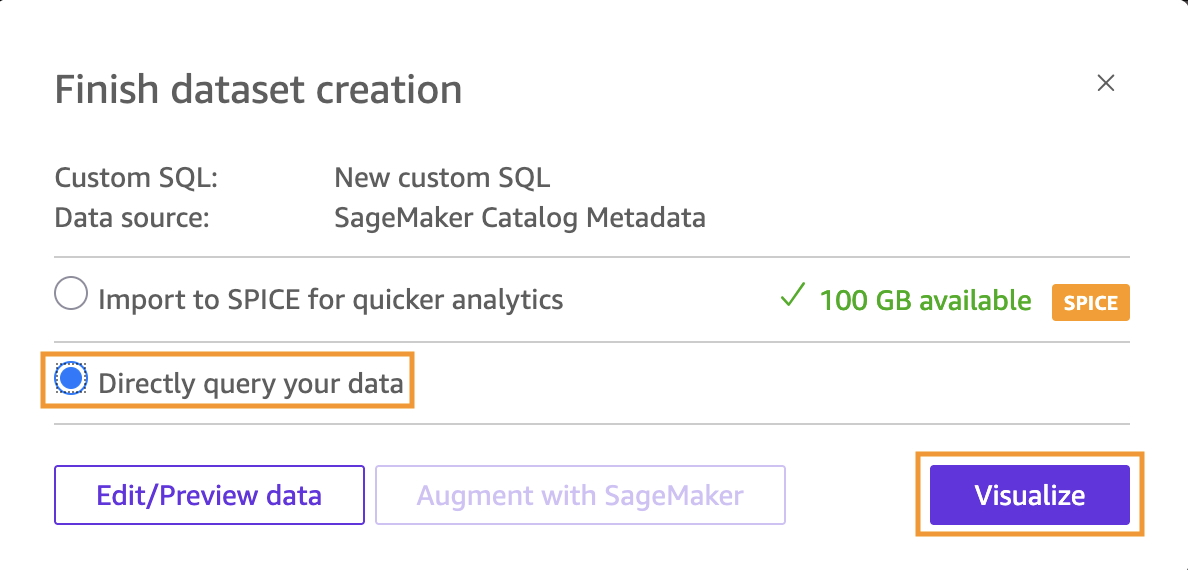
Figure 8 – Directly query your data
- Choose Visualize and Create to start building your dashboard.
Create visualizations with Amazon Quick.
With Amazon Quick, you can build governance dashboards using natural language prompts. This removes the need for manual field configuration. This approach is faster and more intuitive than traditional dashboard building.The Amazon Quick Sight user must have AdminPro or AuthorPro subscription (the Build feature isn’t available for Reader users).Start building your dashboard with the following steps:
- Select Build in the top toolbar to open the natural language builder.
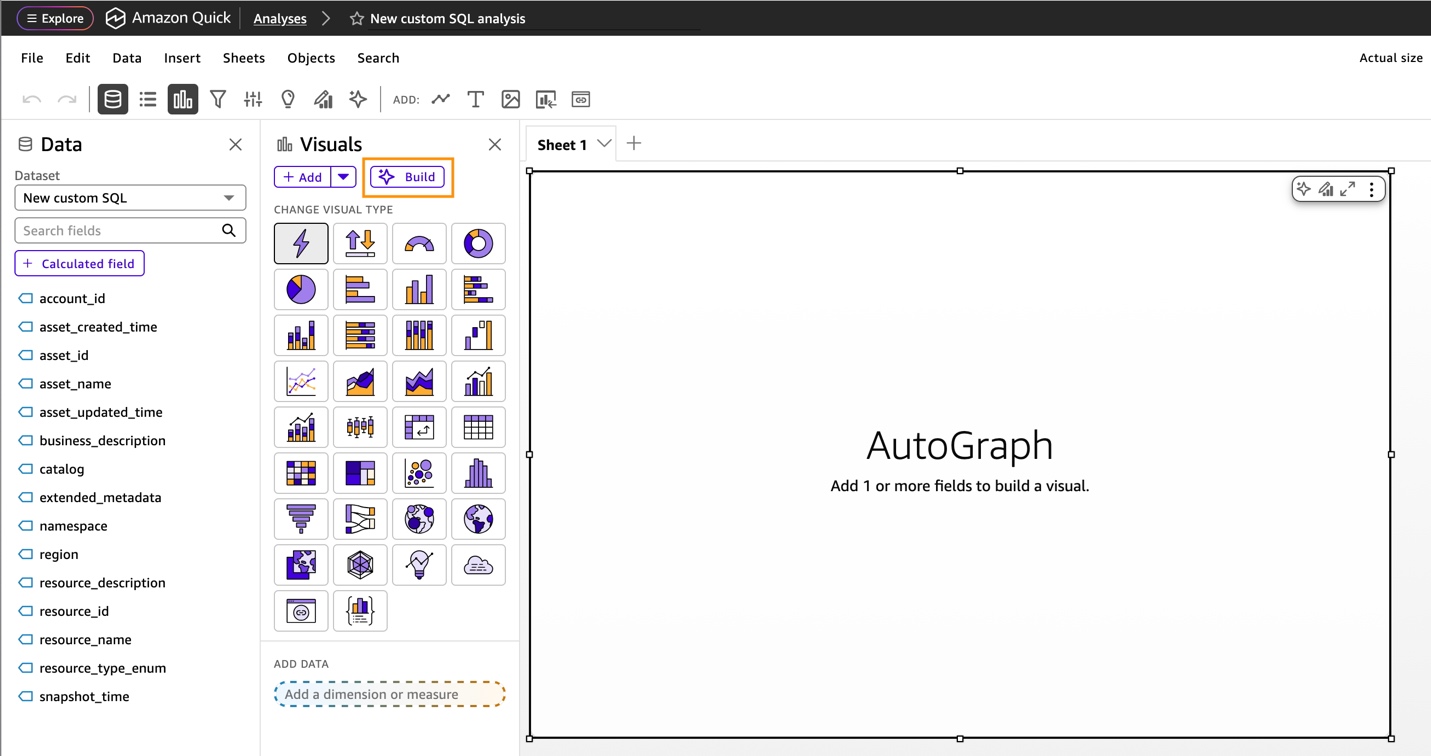
Figure 9 – Amazon Quick build dashboard
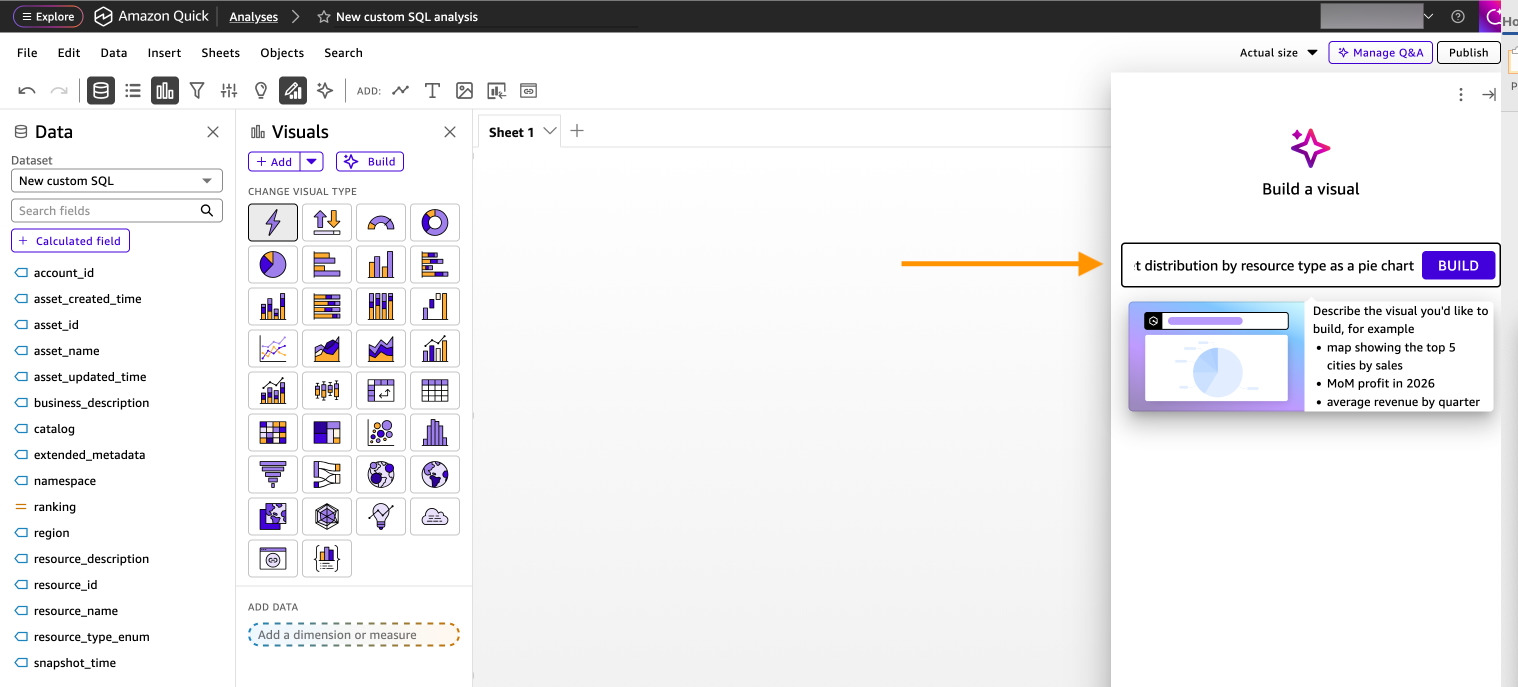
- You will see a text box where you can describe the visualization that you want to create.
Create each visualization using natural language. For each of the six recommended visualizations, enter the corresponding natural language prompt, select Build, then choose ADD TO ANALYSIS.
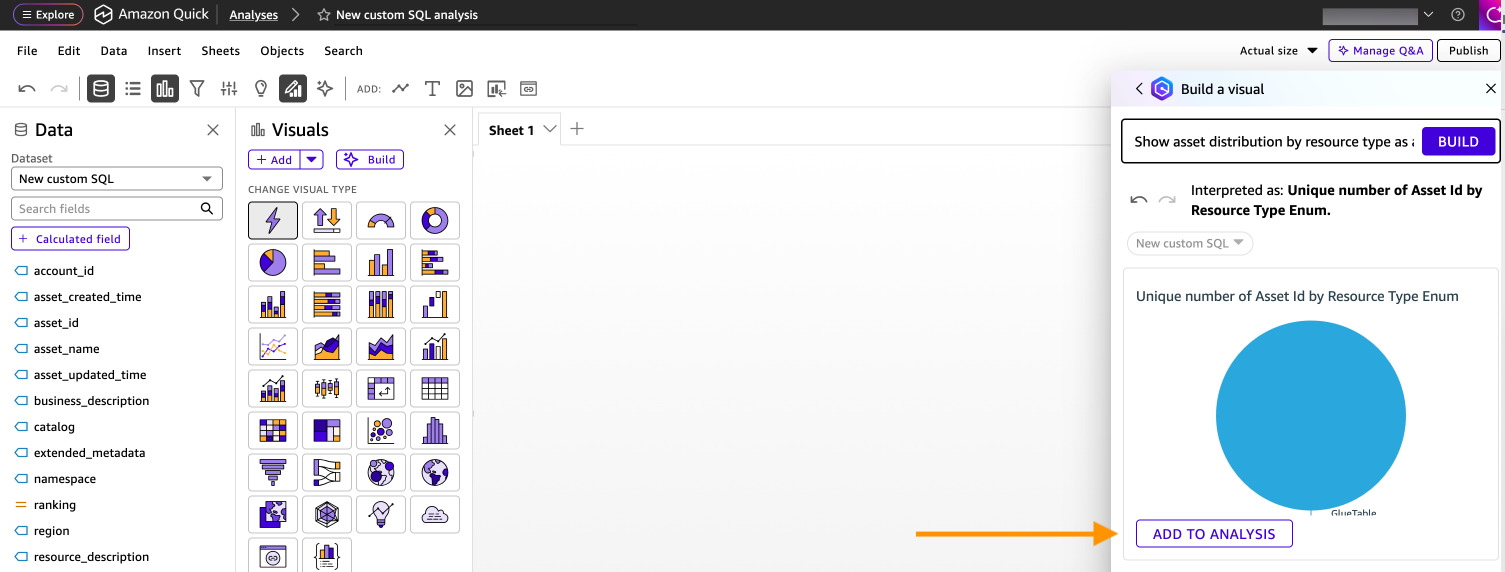
Figure 11 – Add to analysis
Visualization 1: Asset inventory by type
Show count of asset_id by resource_type_enum as a pie chart
After the pie chart is created, choose ADD TO ANALYSIS.
Visualization 2: Documentation completeness
Show count of asset_id where business_description is not null asa KPI
After the KPI is created, choose ADD TO ANALYSIS.
Visualization 3: Monthly registration trends
Show count of asset_id by asset_created_time month as a line chart
After the line chart is created, choose ADD TO ANALYSIS.
Visualization 4: Asset count by account
Show count of asset_id by account_id as a bar chart
After the bar chart is created, choose ADD TO ANALYSIS.
Visualization 5: Namespace distribution
Show count of asset_id by namespace as a treemap
After the treemap is created, choose ADD TO ANALYSIS.
Visualization 6: Resource type by namespace
Show count of asset_id by resource_type_enum and namespace as a heat map
Choose ADD TO ANALYSIS
- Arrange and publish your governance dashboard with the following steps:
- Delete any empty or unwanted visualizations by choosing the three dots menu and choosing Delete.
- Arrange visualizations by dragging them into your preferred layout.
- Resize visualizations to emphasize key metrics.
- Add titles to each visualization for clarity.
- Choose PUBLISH in the top right corner.
- Enter a dashboard name: “SageMaker Catalog Governance Dashboard”.
- Verify these options are selected:
- Allow executive summary.
- Allow sharing stories.
- Allow sharing scenarios.
- Choose Publish dashboard.
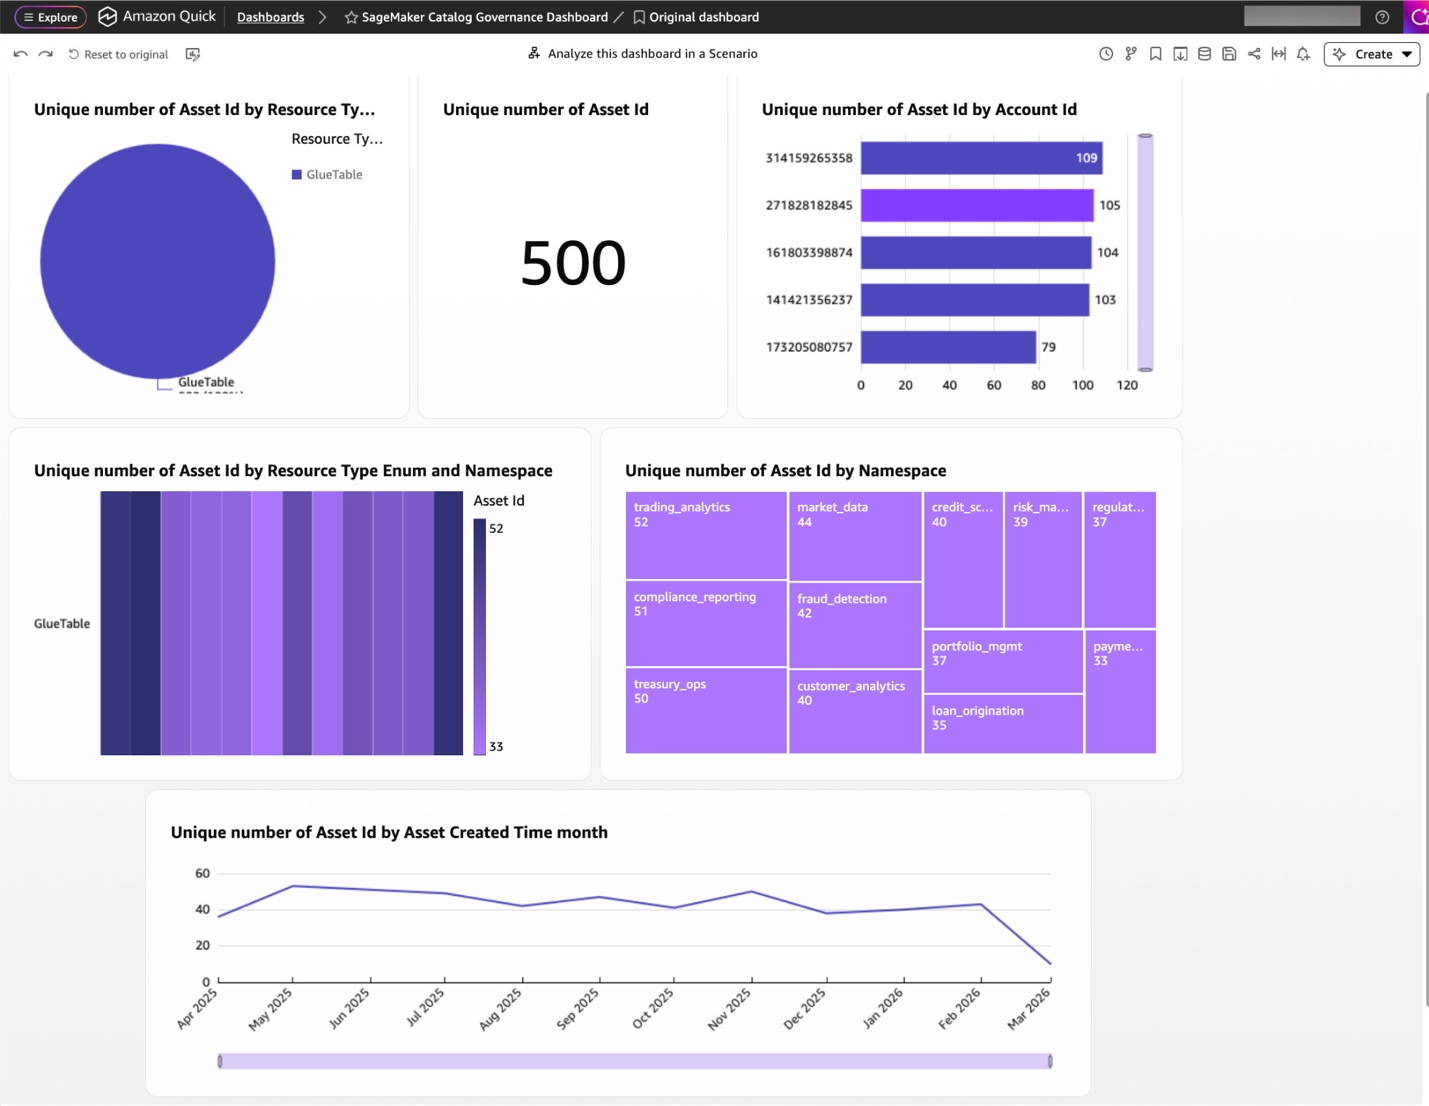
Figure 12 – Amazon SageMaker Catalog governance dashboard
-
- Analyze your dashboard with natural language.
After you publish, you can ask questions about your governance data:
-
- On the dashboard, choose Analyze this dashboard in a Scenario in the top center.
- In the Data to Insights panel, enter natural language questions such as:
- “Which resource types have the lowest documentation rates?”
- “How many assets were registered last month compared to this month?”
- “What percentage of assets lack ownership information?”
- Choose Submit to generate AI-powered insights.
Amazon Quick analyzes your data and provides insights with supporting visualizations.
-
- Generate executive summaries
Create automated governance reports for data stewards and compliance teams:
-
- Choose the Amazon Quick logo in the top left to return to the home page
- Select Dashboards from the left panel
- Choose your “SageMaker Catalog Governance Dashboard”
- Choose the Create dropdown menu in the top right
- Select Executive Summary
Amazon Quick will automatically generate a summary with key governance insights, including Total asset counts and growth trends, Documentation completeness metrics, Ownership coverage statistics, and Classification distribution analysis.
-
- Create governance stories.
Build governance reports that combine multiple dashboards:
-
- From the Create dropdown, select Story.
- Enter a prompt: “Write a summary of catalog governance metrics and data quality trends”.
- Choose Add to select dashboards to include in the report.
- Choose Build (this might take a few minutes to complete).
Amazon Quick will generate a narrative report combining your visualizations with AI-generated insights. Share the reports with leadership or compliance teams.
Governance dashboards contain metadata such as ownership and classification details. Restrict access to users who need it. In the Amazon Quick Sight console, open the dashboard, choose Share, and grant access to named users or a dedicated Quick Sight group (for example, data-stewards) instead of selecting Everyone in this account. Review the dashboard’s permissions periodically and remove entries that are no longer needed.
Cleaning up
To avoid ongoing charges, clean up the resources created in this walkthrough. Delete Amazon Quick Sight resources including the dashboard, analyses, and dataset.
Conclusion
In this post, you connected Amazon Quick Sight to your Amazon SageMaker Catalog metadata export, built governance dashboards using the Amazon Quick natural language prompts. This approach gives data stewards and compliance teams visibility into catalog health through six key visualizations covering asset inventory, documentation completeness, registration trends, account distribution, classification coverage, and stale asset detection.
Together with the metadata export and SQL query capabilities covered in the Analyzing your data catalog: Query SageMaker Catalog metadata with SQL post, this solution provides a complete, low-overhead governance monitoring pipeline from raw catalog metadata to executive-ready.
To learn more about Amazon SageMaker Catalogs, see Amazon SageMaker Catalog documentation. To expand the work done with Amazon Quick, review Amazon Quick Sight documentation.