AWS Compute Blog
Automating Amazon EC2-Windows EBS Volumes monitoring and creating alarms
This blog post is written by, Santhosh Kumar Adapa, Database Consultant, AWS WWCO ProServe, Jeevan Shetty, Database Consultant, AWS WWCO ProServe, and Bhanu Ganesh Gudivada, Consultant Databases, AWS WWCO ProServe.
Customers who are running fleets of Amazon Elastic Compute Cloud (Amazon EC2) instances use advanced monitoring techniques to observe their operational performance. Capabilities like aggregated and custom dimensions help customers categorize and customize their metrics across server fleets for fast and efficient decision making. Customers require visibility into not only infrastructure metrics (such as CPU and memory), but also disk usage metrics.
Monitoring Amazon EC2-Windows Amazon Elastic Block Store (Amazon EBS) Volumes usage is critical, especially when customers have a large fleet of Amazon EC2 Windows servers running to host their databases and applications in AWS. Generally, we see issues with EC2 instances running out of disk space, and free disk space isn’t a metric that is directly available with Amazon CloudWatch. Amazon CloudWatch agent helps solve this problem. After installing and configuring the CloudWatch agent on your EC2 instance, the agent will send metric data with the disk utilization to CloudWatch. The next step is to create a CloudWatch alarm to monitor the disk utilization metric.
In this post, we showcase the steps to automate the monitoring and creating alarms for EBS volumes attached to Amazon EC2 Windows instances. Alarms are created using AWS Lambda that monitors the free disk space and alerts whenever thresholds are crossed using Amazon Simple Notification Service (Amazon SNS).
Solution overview
To demonstrate the solution we first install and configure the CloudWatch agent in your Amazon EC2 Windows instance, and then the agent will send metric data with the disk utilization to CloudWatch. To monitor the disk on each Amazon EC2 Windows instance, we’ll use two custom Metrics, “FreeStorageSpaceInMB” and “FreeStorageSpaceInPercent”, that are collected by CloudWatch agent and pushed to CloudWatch.
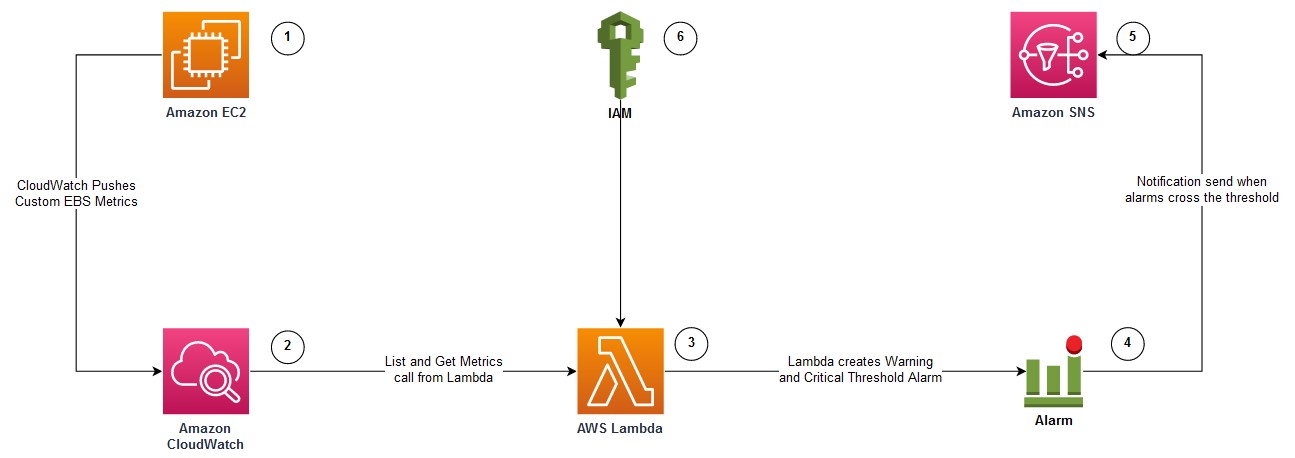
The following diagram illustrates the architecture used in this post:
- Amazon EC2 Windows instance with attached Amazon EBS Volumes to be monitored for free disk usage. The EC2 instance is configured with Amazon CloudWatch Agent.
- CloudWatch agent is configured to monitor the “FreeStorageSpaceInMB” and “FreeStorageSpaceInPercent” metrics, and pushed to AWS CloudWatch.
- Lambda function that can be invoked to create CloudWatch alarms for each disk attached to the EC2 instance.
- CloudWatch Alarms are created with warnings and critical thresholds based on storage size.
- Amazon SNS is used to send alerts when the CloudWatch Alarms crosses the threshold.
- AWS Identity and Access Management (IAM) to provide permission to the Lambda function to get Amazon EBS metrics and to create CloudWatch Alarms.
Prerequisites
You will need the following prerequisites:
- To implement this solution, you must have an Amazon EC2 Windows instance configured with Amazon CloudWatch Agent by following the steps documented in the article – How to monitor Windows and Linux servers and get internal performance metrics.
- To monitor the “
FreeStorageSpaceInMB” and “FreeStorageSpaceInPercent” metrics for Amazon EBS volumes attached to the EC2 instance, the CloudWatch agent configuration JSON should have the following section:
"LogicalDisk": {
	"measurement": [
	{
		"name":"% Free Space",
		"rename":"FreeStorageSpaceInPercent",
		"unit":"Percent"
	},
	{
		"name":"Free Megabytes",
		"rename":"FreeStorageSpaceInMB",
		"unit":"Megabytes"
	}
	],
	"metrics_collection_interval": 10,
	"resources": [
		"*"
	]
},- Amazon EC2 host or bastion host with an IAM role attached that has permissions to create an IAM role, Lambda function, and run Amazon Relational Database Service (Amazon RDS) CLI commands. A Lambda function and an IAM role are created using AWS Serverless Application Model (SAM).
AWS SAM
In this section, we provide the steps to create an IAM role and deploy a Lambda function using AWS SAM.
- Log in to the Amazon EC2 host and install the AWS SAM CLI.
- Download the source code and deploy it by running the following command:
git clone https://github.com/aws-samples/aws-ec2-windows-ebs-volumes-monitoring

cd aws-ec2-windows-ebs-volumes-monitoring/ebs_volumes_monitoring
sam deploy --guided
3. Provide the following parameters:
-
- Stack Name – Name for the AWS CloudFormation stack.
- AWS Region – AWS Region where the stack is being deployed.
The following is the sample output when you run sam deploy –guided with default arguments:
=========================================
Stack Name [ebs-volumes-monitoring]: ebs-volumes-monitoring
AWS Region [us-west-2]:
#Shows you resources changes to be deployed and require a 'Y' to initiate deploy
Confirm changes before deploy [y/N]:
#SAM needs permission to be able to create roles to connect to the resources in your template
Allow SAM CLI IAM role creation [Y/n]:
#Preserves the state of previously provisioned resources when an operation fails
Disable rollback [y/N]:
Save arguments to configuration file [Y/n]:
SAM configuration file [samconfig.toml]:
SAM configuration environment [default]:
In the following sections, we describe the AWS services deployed with AWS SAM.
IAM role
AWS SAM creates an IAM role with policies to describe EC2 instances, as well as List, Get, and Put CloudWatch metrics. Furthermore, it attaches an AWS managed IAM policy called AWSLambdaBasicExecutionRole to the IAM role. This role is attached to the Lambda functions to create Amazon EBS volume alarms for EC2 instances.
Lambda function
AWS SAM also deploys the Lambda function. It uses Python 3.8 and accepts two parameters:
- Hostname: Amazon EC2 Windows instance name, or, if we must configure alarms for multiple servers, then you can use a wild card character, such as Instance_name* or Instance_name?
- sns_topic_name: ARN of the SNS topic that is used to configure CloudWatch Alarms. Notification is sent to the SNS topic when the Amazon EBS Volume metric crosses the threshold.
Invoking Lambda function
After the SAM deployment is successful, we can invoke the Lambda function with the instance name and the SNS Topic ARN. The Lambda function creates two alarms (Warning and Critical) for every Amazon EBS volume attached to the instance. The Warning and Critical values can be changed in the Lambda code so that there are two different values depending on the size of the disk drive. Furthermore, the alarms are configured to send notifications to the SNS Topic. The following is the sample command to invoke the Lambda function:
aws lambda invoke --function-name ec2-ebs-metric --cli-binary-format raw-in-base64-out \
--payload '{"hostname": "Windows*", "sns_topic_name": "arn:aws:sns:us-west-2:123456789:notify_dba" }' response.json
Verifying CloudWatch Alarms:
Verify the CloudWatch Alarms that are created in the CloudWatch console. The following screenshot shows the CloudWatch alarms created for an EC2 instance with four disks. There are two alarms (Warning and Critical) created for every disk (four disks in total). Therefore, we see eight CloudWatch alarms.
Checking CloudWatch Logs:
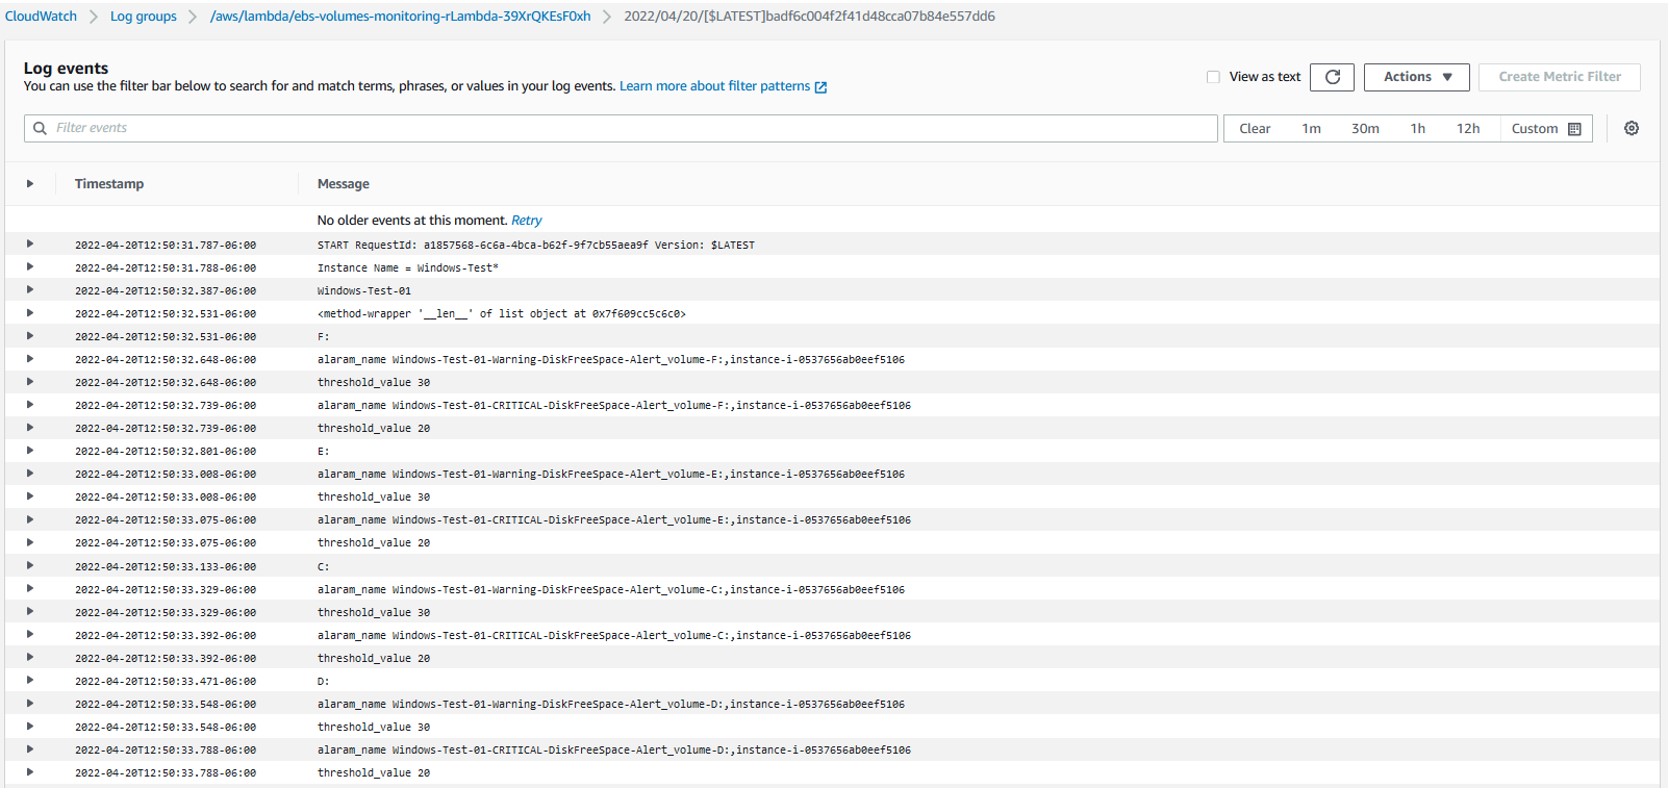
After running the Lambda function, to verify the log, go to Lambda Service page, select the Lambda function created, navigate to the Monitor tab, and then select “View logs in CloudWatch”. Then, go to the latest log file to check the CloudWatch log files for any errors.
 Select the latest Log Steam to check the details of the last Lambda function execution.
 The log file shows the full details of the Lambda function execution. Furthermore, it shows the CloudWatch alarms configured for each disk, as well as if there are any errors generated during execution.
 Cleanup
To clean up the resources used in this post, complete the following steps:
- Delete the CloudFormation stack by running below command and replacing
STACK_NAMEwith stack name provided in step 3a above, under section “AWS SAM”
sam delete --stack-name STACK_NAME- Confirm the stack has been deleted by running below command. Replace
STACK_NAMEas mentioned in previous step.
aws cloudformation list-stacks --query "StackSummaries[?contains(StackName,' STACK_NAME ')].StackStatus"- Delete any CloudWatch alarms created by the Lambda function by following the document – Editing or deleting a CloudWatch alarm.
Conclusion
In this post, we demonstrated how the requirement of monitoring Amazon EC2 Windows EBS Volumes usage is critical. In particular, this is essential when customers have a large fleet of Amazon EC2 Windows servers running to host their databases and applications in the cloud. We showcased the process of automating the free disk monitoring using Lambda and notifying through Amazon SNS when disks cross the storage threshold. By implementing such monitoring, customers can prevent issues with EC2 instances running out of disk space thus preventing critical production outages.
Provide any thoughts or questions in the comments section. We also encourage you to explore CloudWatch monitoring and try out additional use cases mentioned in the documentation.

