AWS Contact Center
Amazon Connect Service Quota Monitor
Your Amazon Connect contact center is running at 92% of its concurrent call capacity, and no service quota monitor is watching. The dashboard shows green. Agents are handling calls. Then one more call comes in, and the next 50 callers receive no response.
Amazon Connect enforces quotas on more than 300 resource types and API rate limits. These quotas protect the service, but Amazon Connect doesn’t natively alert you when you’re approaching them. You find out when something breaks.
In this post, you can deploy a three-tier monitoring solution that alerts you before Amazon Connect quotas impact your callers. Each tier includes example alert output so you can see exactly how the tool answers those questions in practice.
How you got here
This tool helps you monitor quotas during migrations of tens of thousands of agents to Amazon Connect. During these migrations, quota-related events that proactive monitoring would have prevented occurred repeatedly. Examples include:
- A contact flow deployment that pushed past the 100-flow limit
- An API integration that hit its per-second rate limit during the first production peak
- A phone number porting wave that consumed capacity nobody was tracking
The existing Quota Monitor for AWS covers approximately 70 quotas across multiple services, but Amazon Connect-specific coverage is limited. The tool answers three questions simultaneously. The tool identifies which capacity quotas are approaching their limits, which APIs are about to be throttled, and which APIs are already being throttled.
The monitoring gap
The Service Quotas console shows current limits but not current usage against those limits. You can set Amazon CloudWatch alarms on some metrics, but Amazon Connect’s API rate limits reset every second. An API averaging 3 calls/second over an hour can spike to 40 calls/second at 10 AM when agents log in. Hourly averages hide those spikes entirely.
Solution overview
The solution uses three monitoring tiers, each targeting a different class of problem. The following section describes how the AWS services connect to deliver alerts from detection to notification.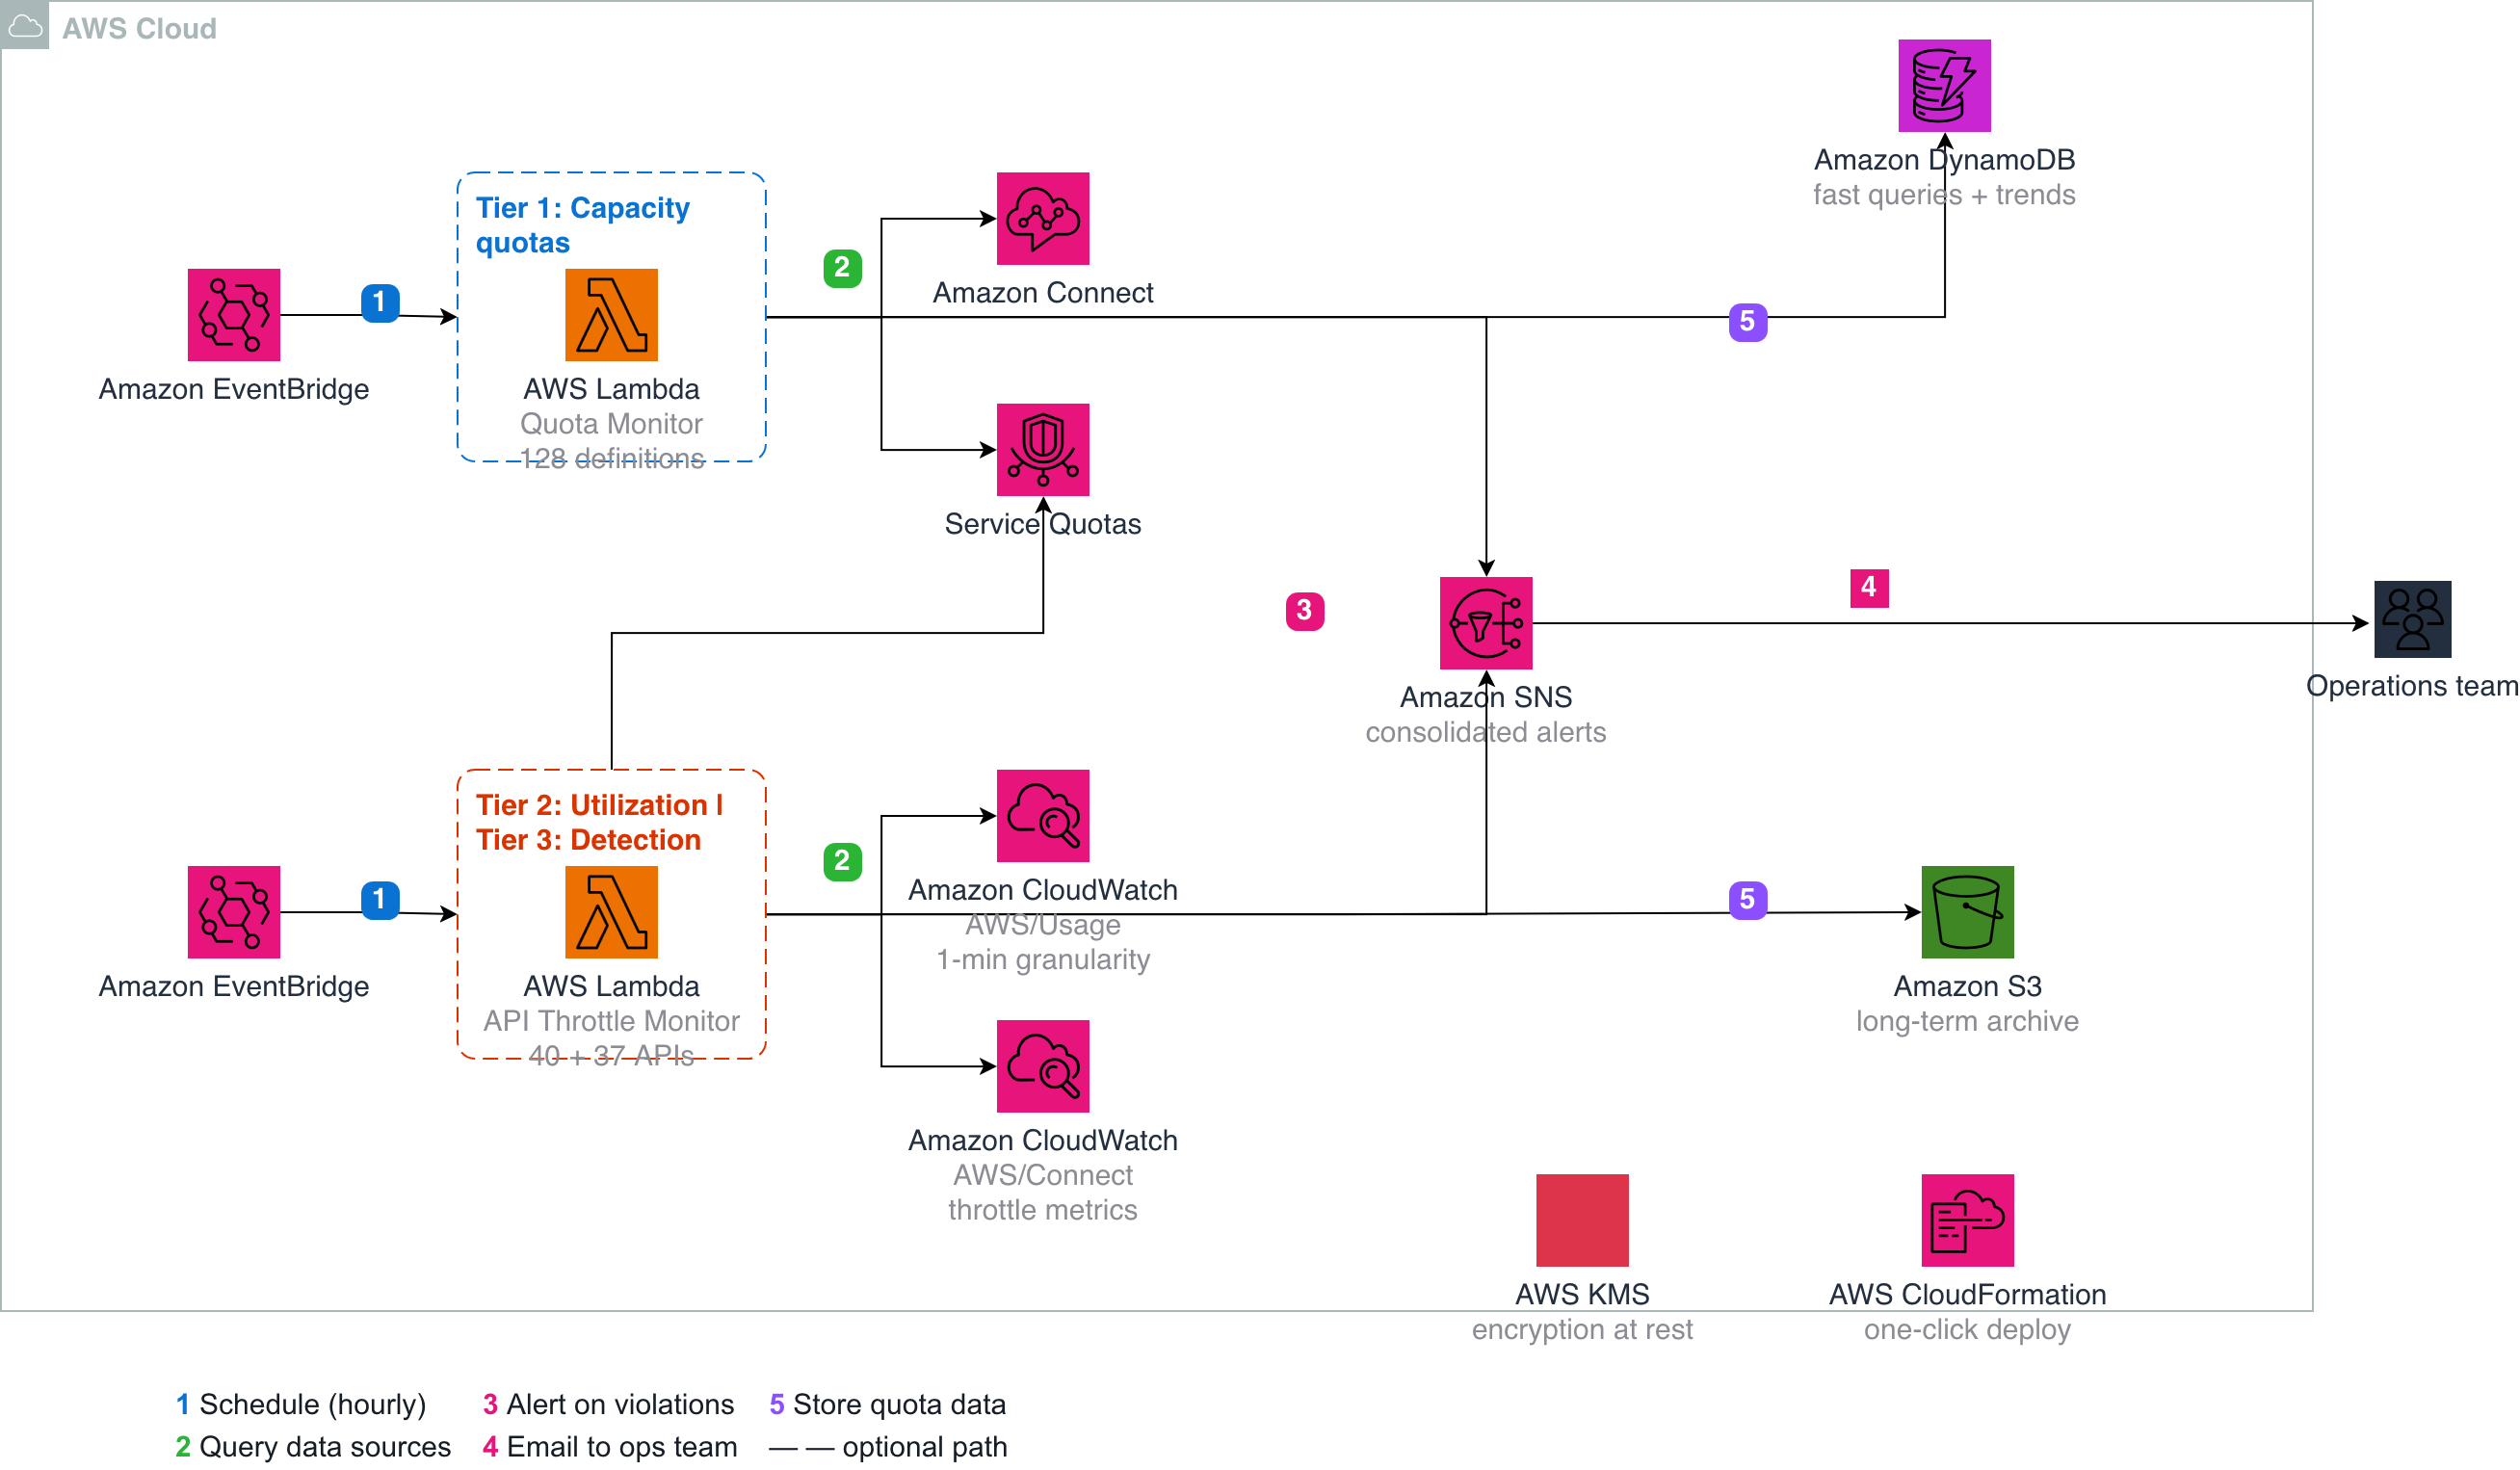
Three-tier monitoring architecture with Amazon EventBridge, AWS Lambda, CloudWatch, Amazon Simple Notification Service, and Amazon DynamoDB.
How the architecture works
The following sequence describes how each component interacts during a monitoring cycle:
- Amazon EventBridge triggers both Lambda functions on an hourly schedule.
- Each Lambda function queries its data sources:
- Quota Monitor queries Amazon Connect APIs and Service Quotas limits
- API Throttle Monitor queries CloudWatch metrics (AWS/Usage and AWS/Connect namespaces)
- When any quota crosses its threshold, Lambda publishes an alert to a shared Amazon SNS topic.
- Amazon SNS delivers a consolidated email notification to the operations team.
- Both Lambda functions store quota data in Amazon DynamoDB for fast queries and trend analysis, with optional archival to Amazon S3.
Deployment and cost
AWS CloudFormation handles the entire deployment. The stack costs between $4 and $11 per month depending on instance count and storage options. For a detailed breakdown, see the AWS Pricing Calculator.
Production recommendations
For production environments, route the Amazon SNS topic to AWS Chatbot for Slack or Amazon Chime notifications. You can also forward alerts to a centralized operations dashboard using Amazon CloudWatch.
The CloudFormation template uses Amazon SNS as the notification layer, so you can replace or extend the email subscription with supported Amazon SNS endpoints, including AWS Lambda for custom integrations with your existing event management tools.
Prerequisites
Before deploying the Amazon Connect Service Quota Monitor, confirm that you have the following:
- An active AWS account with administrative access. You need IAM permissions to create CloudFormation stacks, Lambda functions, DynamoDB tables, and Amazon SNS topics.
- AWS CLI installed and configured with credentials for the target account
- At least one Amazon Connect instance provisioned in the target Region
- Git installed on your local machine for cloning the repository
- A valid email address to receive Amazon SNS alert notifications
Tier 1: Capacity quota monitoring
The first Lambda function discovers all Amazon Connect instances in the account and checks 88 capacity quotas against their Service Quotas limits. Rather than requiring you to manually configure each quota to monitor, the function automatically enumerates all supported resource types. Coverage spans:
- Users, security profiles, contact flows, phone numbers
- Queues, routing profiles, integrations
- Cases, Customer Profiles, Voice ID, Amazon Connect AI assistance, and Forecasting
The default threshold is 80%. When any quota crosses this mark, the function sends one consolidated alert per instance listing all violations. This single-email approach prevents alert fatigue while giving your team a prioritized view of which resources need attention first.
Example alert
Subject: Amazon Connect Quota Alert - Instance: MyConnectInstance (2 violations)

VIOLATIONS:
Contact flows per instance: 147/100 (147.0%) - VIOLATION
Lambda functions per instance: 42/50 (84.0%) - VIOLATION
Tier 2: Proactive utilization monitoring
This tier is the key differentiator from standard approaches.
A second Lambda function fetches the Amazon Connect API rate limit quotas from the Service Quotas API dynamically, with no hardcoded list to maintain. It pulls 1-minute CloudWatch metrics from the AWS/Usage namespace and compares actual peak-second usage against each limit.
Why 1-minute granularity matters
Hourly or 5-minute monitoring periods work well for steady-state tracking, but they average out the short spikes that cause throttling. A 1-minute window captures the real per-second peaks.
Alert thresholds
The Lambda function evaluates API utilization against two configurable thresholds. A warning fires at 70% utilization, giving your team time to request a quota increase. A critical alert fires at 90%, signaling that throttling is imminent. These thresholds differ from the 80% default in Tier 1 because API rate limits have less headroom than capacity quotas. You can adjust both values in the CloudFormation template parameters to match your operational risk tolerance.
Example alert
GetContactAttributes:
  Limit: 60/s | Peak: 52.3/s (87.2%) — CRITICAL

GetCurrentMetricData:
  Limit: 5/s | Peak: 3.7/s (74.0%) — WARNING

Recommended: Request quota increase or add caching
Tier 3: Throttle detection
The same Lambda function monitors 37 API operations for active throttling events. It uses the AWS/Connect CloudWatch namespace. If an API is already being throttled, you know within the hour.
Example alert
Subject: Amazon Connect API Throttling Detected

Instance: production-connect
Throttled APIs:
  StartOutboundVoiceContact: 12 throttle events in the last 60 minutes
  GetCurrentMetricData: 8 throttle events in the last 60 minutes

Action required: Review call volumes and consider requesting a quota increase.
The three tiers are complementary
Each tier addresses a different failure mode. Together, they provide coverage from early capacity warnings through active throttle detection:
| Tier | Purpose |
|---|---|
| Tier 1 | Prevents running out of resources |
| Tier 2 | Prevents throttling before it impacts callers |
| Tier 3 | Catches anything that slipped through |
Why retry logic doesn’t solve throttling
A common but flawed pattern teams use:
- Contact flow blocks like TransferContactToQueue are orchestrated by Amazon Connect internally. No retry configuration exists.
- When a block hits a throttle, it follows the Error branch immediately.
- Looping back creates tight loops that hammer the throttled API and add dead air for callers.
- Lambda-invoked APIs within contact flows have an 8-second execution limit. Three retry attempts with backoff consume 2–4 seconds of that budget.
Proactive monitoring catches utilization at 80% and triggers a quota increase before throttling starts. This prevents the problem that retry logic tries to solve after the fact.
In our experience, this solution has reduced quota-related incident response time from over 45 minutes to under 10 minutes, prevented unplanned outages during migrations of 10,000+ agents, and identified capacity risks an average of 6 hours before they would have caused caller impact.
Multi-account deployment
You might run Amazon Connect instances across multiple AWS accounts. You can deploy the CloudFormation stack in each account individually. Alternatively, use AWS CloudFormation StackSets to deploy and manage the monitoring solution centrally from a delegated administrator account.
Each stack operates independently, monitoring the Amazon Connect instances in its own account and publishing alerts to its local Amazon SNS topic.
To consolidate alerts across accounts, you have two options:
- Route each account’s Amazon SNS topic to a central Amazon EventBridge event bus
- Connect to a shared operations Slack channel via AWS Chatbot
Getting started
Follow these five steps to deploy the solution in your AWS account. The process typically takes under 15 minutes.
Step 1: Clone the repository
git clone https://github.com/aws-samples/sample-amazon-connect-service-quota-monitor.git
cd sample-amazon-connect-service-quota-monitor
Step 2: Deploy the capacity quota monitor
The deploy.sh script creates a CloudFormation stack that provisions the Tier 1 Lambda function, DynamoDB table, Amazon SNS topic, and EventBridge rule. The –email flag specifies the address that receives quota alerts.
./deploy.sh --email admin@company.comStep 3: Deploy the API throttling monitor
The deploy_throttling_monitor.sh script creates a second CloudFormation stack for Tier 2 and Tier 3 monitoring. This stack provisions its own Lambda function and EventBridge rule, sharing the Amazon SNS topic created in Step 2.
./deploy_throttling_monitor.shStep 4: Confirm the Amazon SNS subscription
Look for a subscription confirmation message from Amazon SNS in your email inbox. Choose the confirmation link to activate alert delivery.
Step 5: Verify deployment
After the next hourly execution cycle, confirm that you receive a test notification or review the Lambda function logs in Amazon CloudWatch Logs for successful execution.
After deployment, monitoring starts automatically on an hourly schedule. Alerts start flowing on the next execution cycle.
Cleanup
To remove the solution and stop incurring charges, delete the two CloudFormation stacks deployed during setup. Deleting the stacks removes the deployed Lambda functions, DynamoDB tables, Amazon SNS topics, and associated IAM roles.
To delete the stacks, run the following commands:
aws cloudformation delete-stack --stack-name AmazonConnectQuotaMonitor
aws cloudformation delete-stack --stack-name AmazonConnectThrottleMonitor
You must delete any data stored in Amazon S3 separately.
Conclusion
Large-scale contact centers don’t fail because of a single large event. They fail because a quota that nobody was watching crossed a threshold during a traffic spike that nobody expected. The Amazon Connect Service Quota Monitor eliminates that blind spot, giving your operations team hours of lead time instead of minutes of downtime.
You can find the solution on GitHub at https://github.com/aws-samples/sample-amazon-connect-service-quota-monitor. Contributions and feedback are welcome.
Learn more
About the authors
 Guruprasad Seeryada is a Senior Technical Account Manager at AWS Enterprise Support, based in Atlanta, GA. He works with Fortune 100 insurance customers on AI/ML strategy, cloud operations, and proactive reliability engineering.
 Arun Kumar S is a Senior Technical Account Manager at AWS Enterprise Support, based in Kentucky. He works with Fortune 100 insurance customers on container modernization, Amazon Connect migrations, and operational excellence.