AWS Database Blog
Create monitoring dashboard for Amazon RDS for Db2
Amazon Relational Database Service (Amazon RDS) for Db2 is a fully managed relational database service that simplifies setting up, operating, and scaling IBM Db2 databases in the cloud. It automates time-consuming administration tasks such as hardware provisioning, database setup, patching, and backups — freeing you to focus on building and optimizing your applications. However, to maintain optimal performance and verify application health, you need to continuously monitor your database metrics.
In this post, we walk you through deploying an automated Amazon CloudWatch monitoring dashboard for Amazon RDS for Db2. This solution works for both internet-connected (online) and private subnet (air-gapped) environments, requiring no manual console steps. A single shell script orchestrates the entire deployment. It provisions an AWS Lambda function, Amazon EventBridge schedules, Amazon VPC endpoints, and a comprehensive Amazon CloudWatch dashboard that provides real-time visibility into your database performance.
Solution overview
The solution uses a shell script (db2monitor.sh) that orchestrates an AWS CloudFormation-based deployment. It automates the following:
- Creates a Lambda function (Python 3.12) with an
ibm_dblayer to connect securely to your RDS for Db2 instance - Stores database credentials in AWS Secrets Manager for secure access
- Schedules metric collection via Amazon EventBridge Scheduler at regular intervals
- Publishes performance metrics to Amazon CloudWatch under the
RDS-DB2-MONnamespace - Builds a CloudWatch dashboard scoped to your DB instance, database name, and deployment tag for easy identification
For air-gapped (private subnet) environments, a separate script (db2mon-airgap.sh) pre-stages all artifacts in a private S3 bucket, so that no internet access is needed at deployment time.
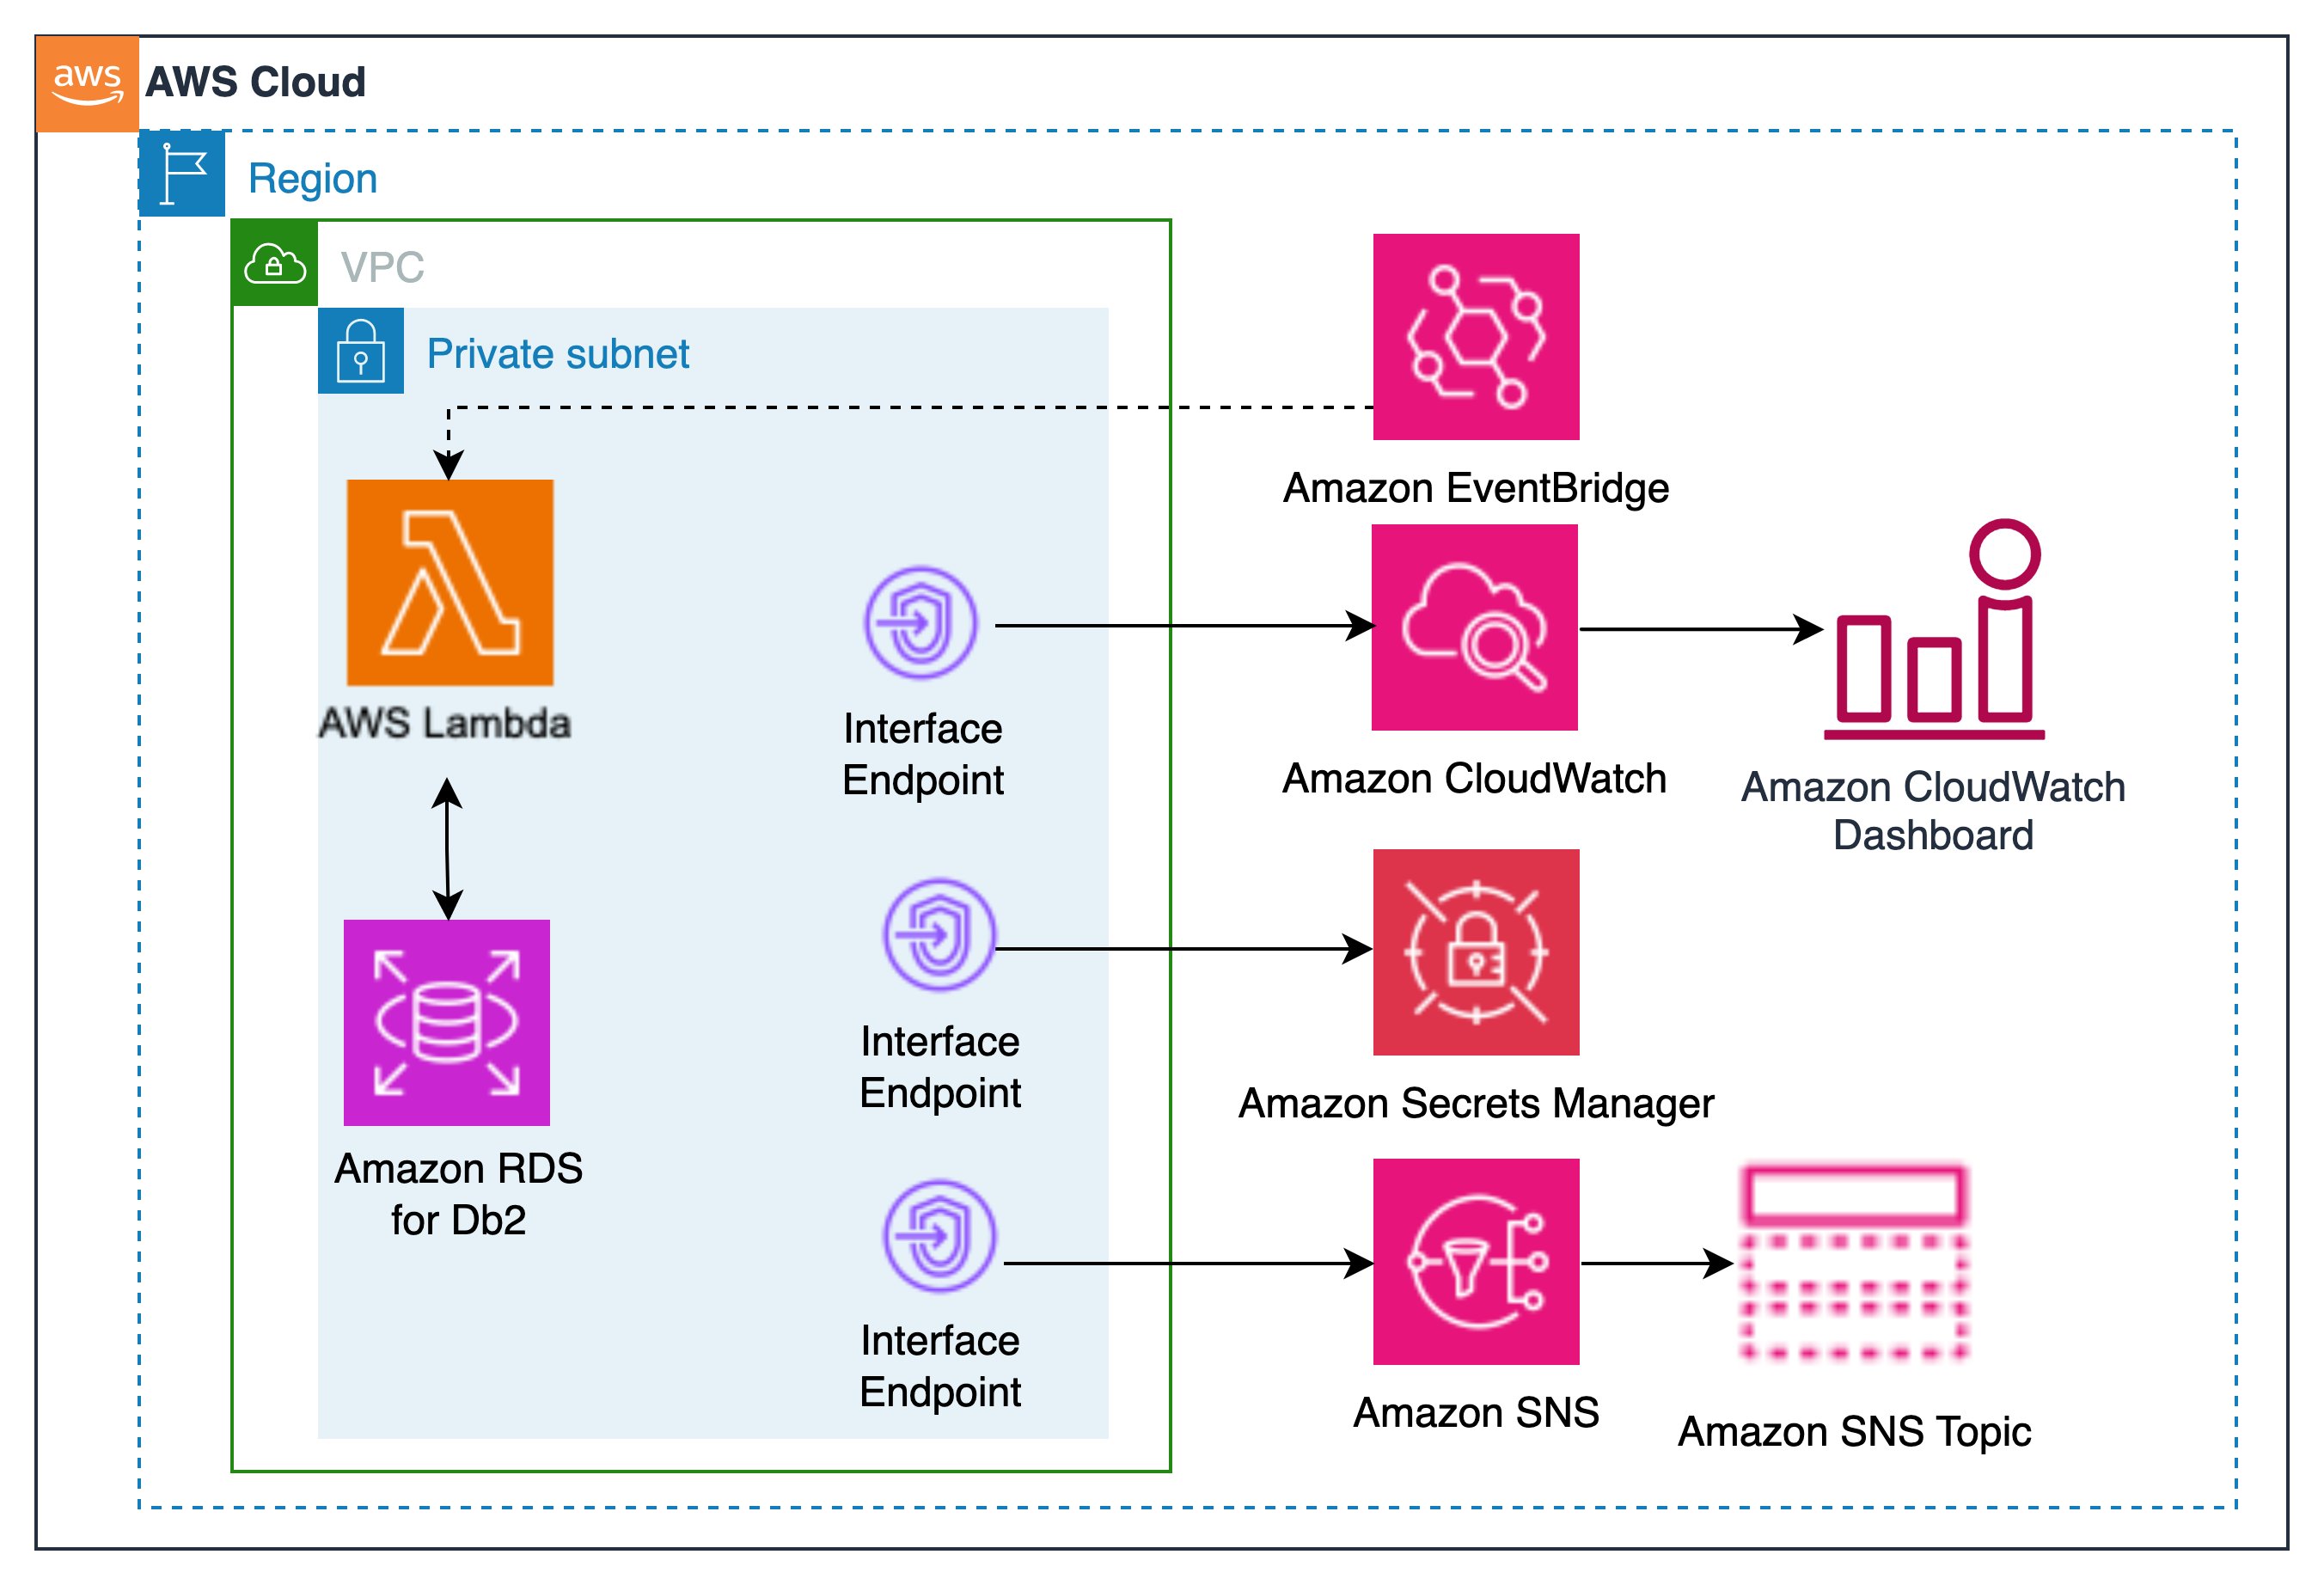
Architecture diagram for Amazon RDS for Db2 monitoring solution
The architecture illustrates how Amazon EventBridge Scheduler triggers a Lambda function at regular intervals to collect performance metrics from your Amazon RDS for Db2 instance. The Lambda function securely retrieves database credentials from AWS Secrets Manager and connects to the database through the VPC. It then publishes custom metrics to Amazon CloudWatch, which powers a comprehensive monitoring dashboard. For air-gapped (private subnet without Network Address Translation (NAT) deployments), all AWS service interactions occur through VPC interface endpoints, which provides complete isolation from the public internet.
Prerequisites
Online deployment
For deployments from AWS CloudShell or an Amazon Elastic Compute Cloud (Amazon EC2) instance with internet access, you need:
- AWS Command Line Interface (AWS CLI) v2 installed and configured
- jq (JSON processor) installed
- AWS Identity and Access Management (AWS IAM) permissions to create AWS Lambda, AWS CloudFormation, Amazon EventBridge, Amazon Secrets Manager, AWS Systems Manager, Amazon Simple Storage Service (Amazon S3), Amazon CloudWatch, and Amazon VPC resources
- Run
./db2monitor.sh --check-permissions --region <region>to validate your permissions before deployment
Air-gapped deployment
For deployments in private subnets without internet access, you need:
- A machine with internet access to download artifacts
- A machine with AWS CLI access to upload artifacts to S3
- A private-subnet EC2 instance to run the deployment
- The following VPC endpoints must exist before deployment:
| Type | Service |
| Gateway | s3 |
| Interface | ssm, ssmmessages, ec2messages, ec2 |
Note:
- Script
db2monitor.shautomatically creates the remaining required endpoints (sts, secretsmanager, monitoring, logs, lambda, rds, sns, sqs, scheduler, cloudformation) during deployment. - VPC DNS settings:
enableDnsSupport=true,enableDnsHostnames= true
Deploy Lambda to build Amazon RDS for Db2 dashboard
Online deployment
Step 1: Download the script
Note: The above URL points to https://raw.githubusercontent.com/aws-samples/sample-rds-db2-tools/main/tools/RDS-Db2-Dashboard/db2mon-unified.sh
Step 2: (Optional) Pre-configure environment variables
If you prefer to set variables once rather than passing them inline:
Step 3: Deploy
Alternatively, pass all options inline for a single-command deployment:
Air-gapped deployment
Step 1: Download artifacts (from an internet-connected machine)
This saves all artifacts to ./db2mon-artifacts/.
Step 2: Upload artifacts to your private S3 bucket
Or combine download and upload in one step if the machine has both internet and AWS access:
This creates the bucket s3://lambda-functions-<account>-<region>/.
Step 3: Deploy from your private-subnet EC2 instance
# Pull the script from your private bucket (via S3 Gateway endpoint)
Post-deployment modules
After the initial install, use --module to manage the deployment:
Resource naming
The deployment creates resources with predictable names scoped to your instance, database, and tag:
| Resource | Name |
| CloudFormation stack | DB2-Dashboard-<DB_INSTANCE_ID>-<DBNAME>-<TAG> |
| Lambda function | DB2Mon-Lambda-Function-<region> |
| Secrets Manager secret | SM-<DB_INSTANCE_ID>-<DBNAME>-<TAG> |
| SSM registry | /db2mon/instances |
| EventBridge schedule | db2mon-cw-<DB_INSTANCE_ID>-<DBNAME>-<TAG> |
| S3 bucket | lambda-functions-<account>-<region> |
Diagnostics script
Run the diagnostics script before deploying to catch common issues:
This script validates:
- AWS credentials and AWS Region configuration
- VPC endpoints (all required services)
- Security group rules (inbound DB2 port, outbound 443)
- Network connectivity to the RDS endpoint
- IAM permissions
- S3 bucket and artifact presence
Common issues:
| Symptom | Root Cause | Solution |
| Lambda cannot reach Amazon RDS | Security group misconfiguration | Verify that the security group allows inbound traffic on the Db2 port (default 50000) and outbound traffic on port 443 for 0.0.0.0/0. |
| Air-gap deploy fails immediately | Missing VPC endpoints | Amazon S3 gateway endpoint and Amazon EC2 interface endpoint must exist before running db2monitor.sh |
| Metrics not appearing in Amazon CloudWatch | EventBridge schedule disabled or Lambda errors | Is the EventBridge schedule enabled? Run --module start. Check Lambda logs in CloudWatch Logs. |
| Permission errors during deployment | Insufficient IAM permissions | Run --check-permissions and attach missing IAM actions. |
| Connection timeout to Amazon RDS | Network routing or DNS issues | Verify the VPC. |
Cost considerations
This monitoring solution incurs minimal operational costs. The primary cost components include Lambda invocations for metric collection, CloudWatch custom metrics and dashboard usage, Secrets Manager for credential storage, and Amazon CloudWatch Logs retention. Additional costs apply for VPC interface endpoints required for private subnet connectivity for Lambda function invocations.
Key cost factors:
- Lambda execution frequency (default: 1-minute intervals)
- Number of custom metrics published to CloudWatch
- VPC interface endpoints for Lambda function
- CloudWatch Logs retention period
Cost optimization: Ahare VPC endpoints across multiple solutions, and configure appropriate log retention policies.
Cleanup
Try this solution
The source code of the scripts is available in the aws-samples/sample-rds-db2-tools repository. Open an issue to submit your enhancements request or submit a pull request with your suggested changes.
Db2 Monitor Dashboard
Upon deploying the dashboard and activating the event bridge to commence monitoring your Amazon RDS for Db2 database, you will encounter a multitude of dashboard widgets. For illustrative purposes, several screenshots of these widgets are presented below, providing a visual representation of their appearance and functionality.
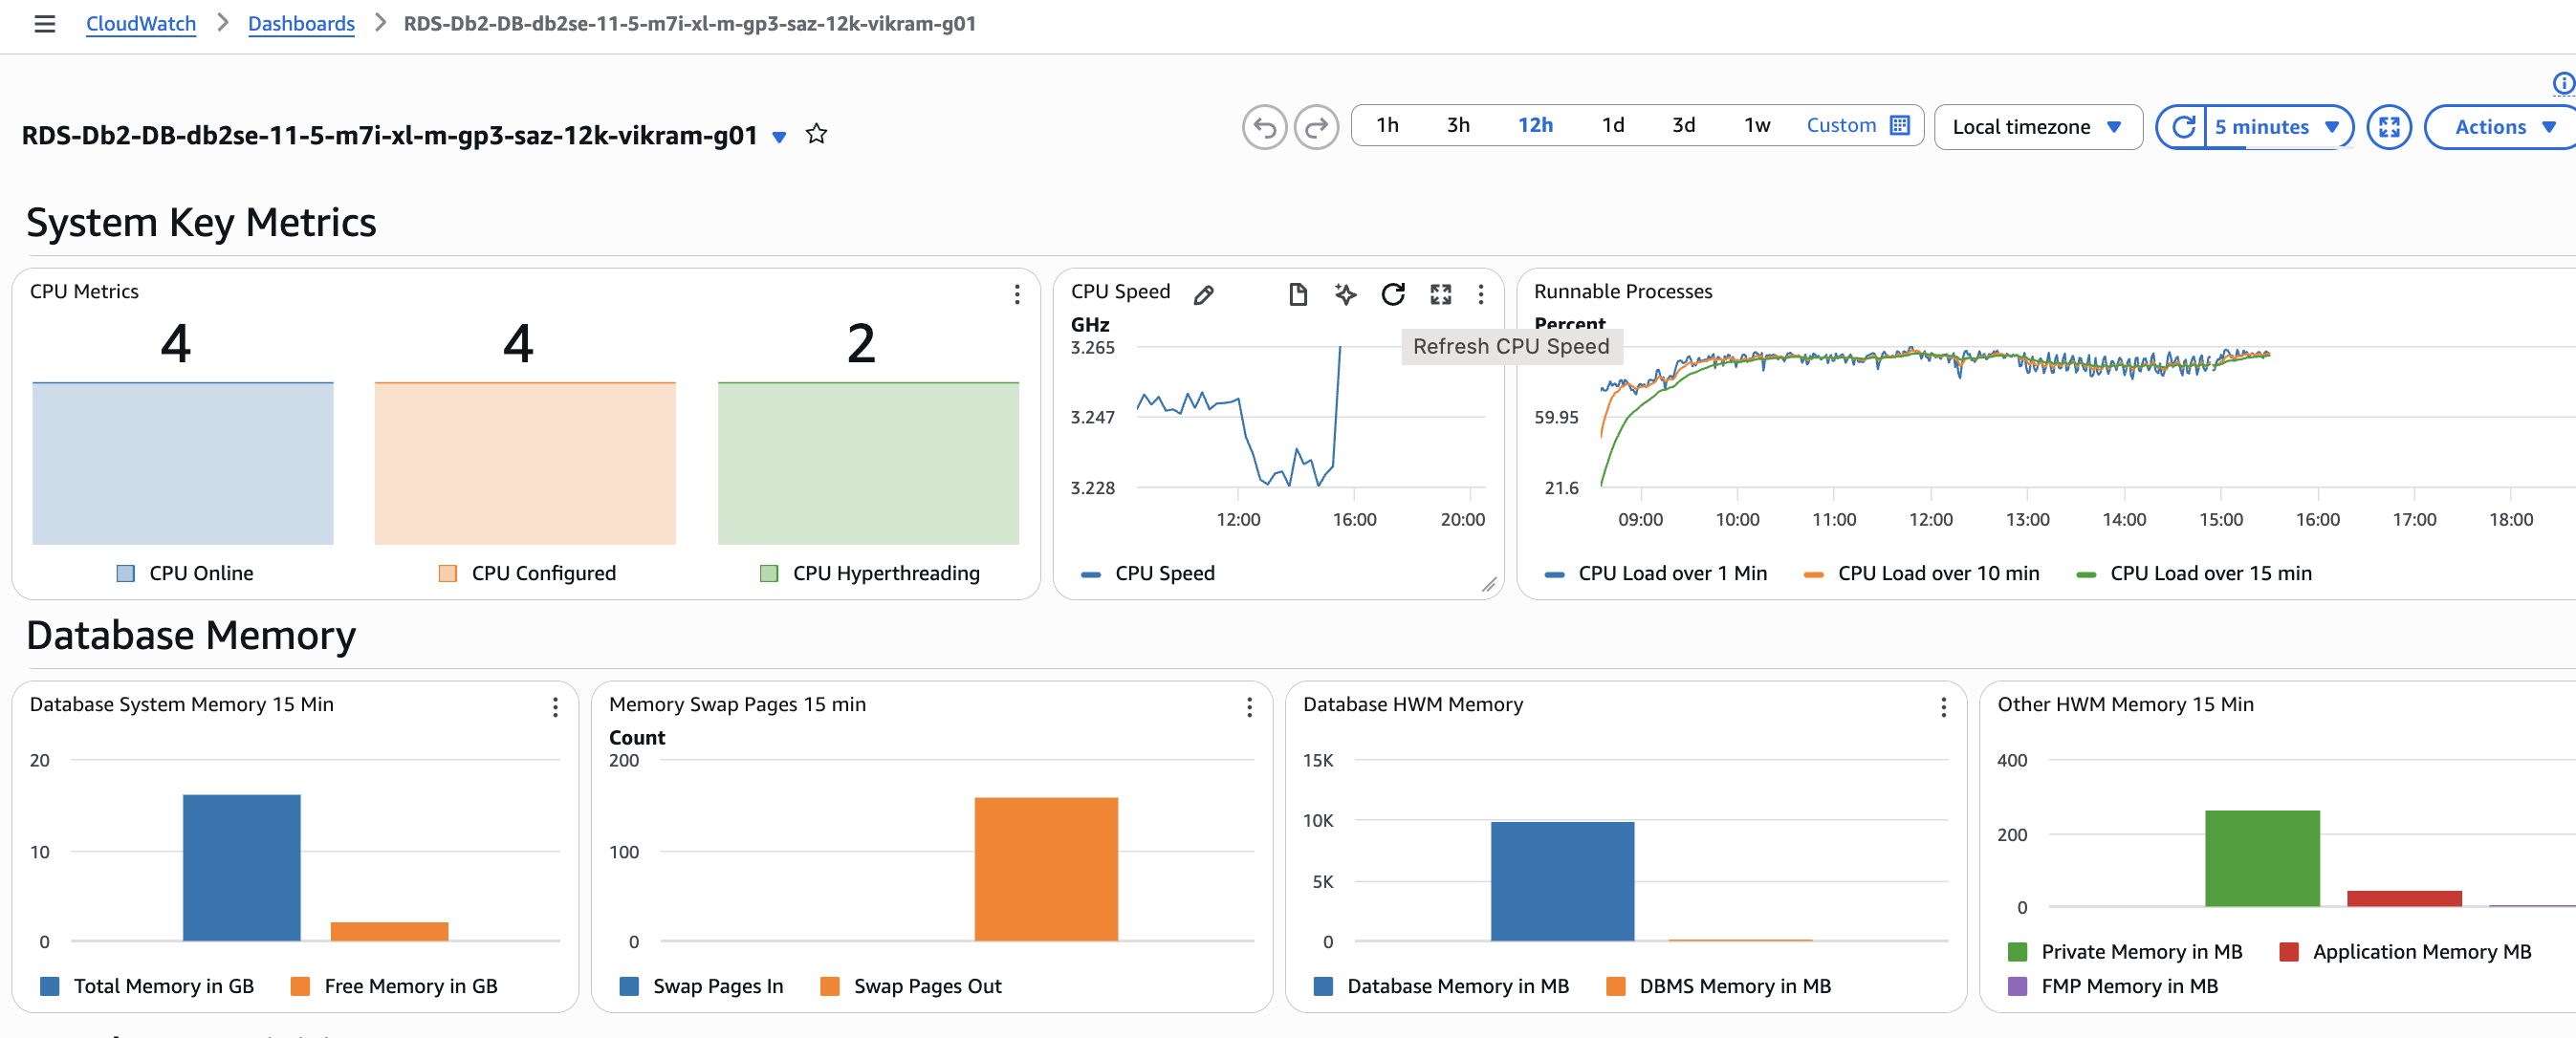
The provided screenshot illustrates the number of CPUs configured and available online for the RDS for Db2 system. It also displays the variation in CPU speed at the server and CPU load over a 1-minute, 10-minute, and 15-minute period. Additionally, the database memory utilization with High Water Marks (HWM) is depicted.
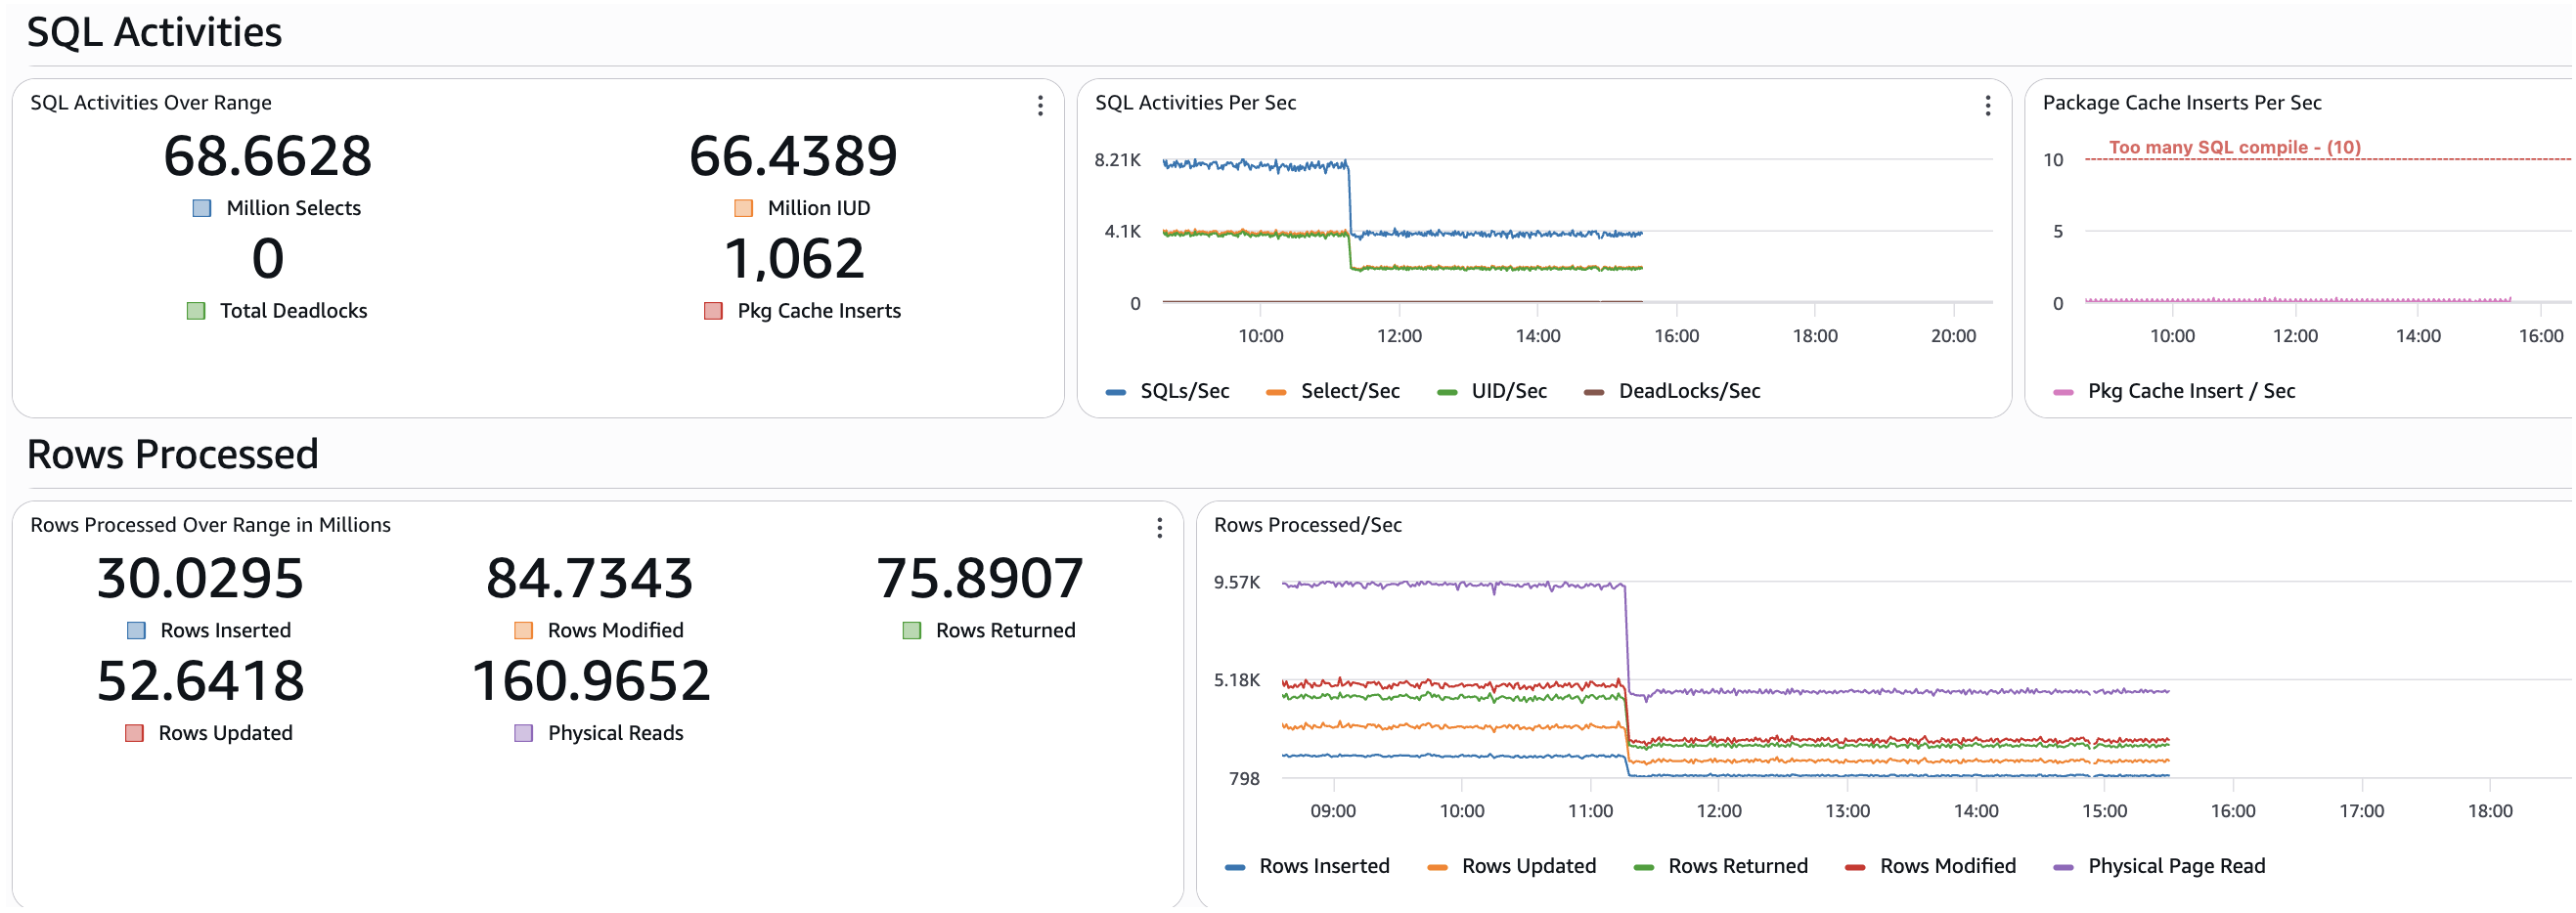
The provided screen snapshot illustrates the activities monitored over the specified time range in the CloudWatch console. For instance, selecting a 24-hour range will display the total SQL activities and rows processed by the RDS for Db2 database. These key performance indicators (KPIs) serve as crucial indicators of the workload type of the database being monitored.
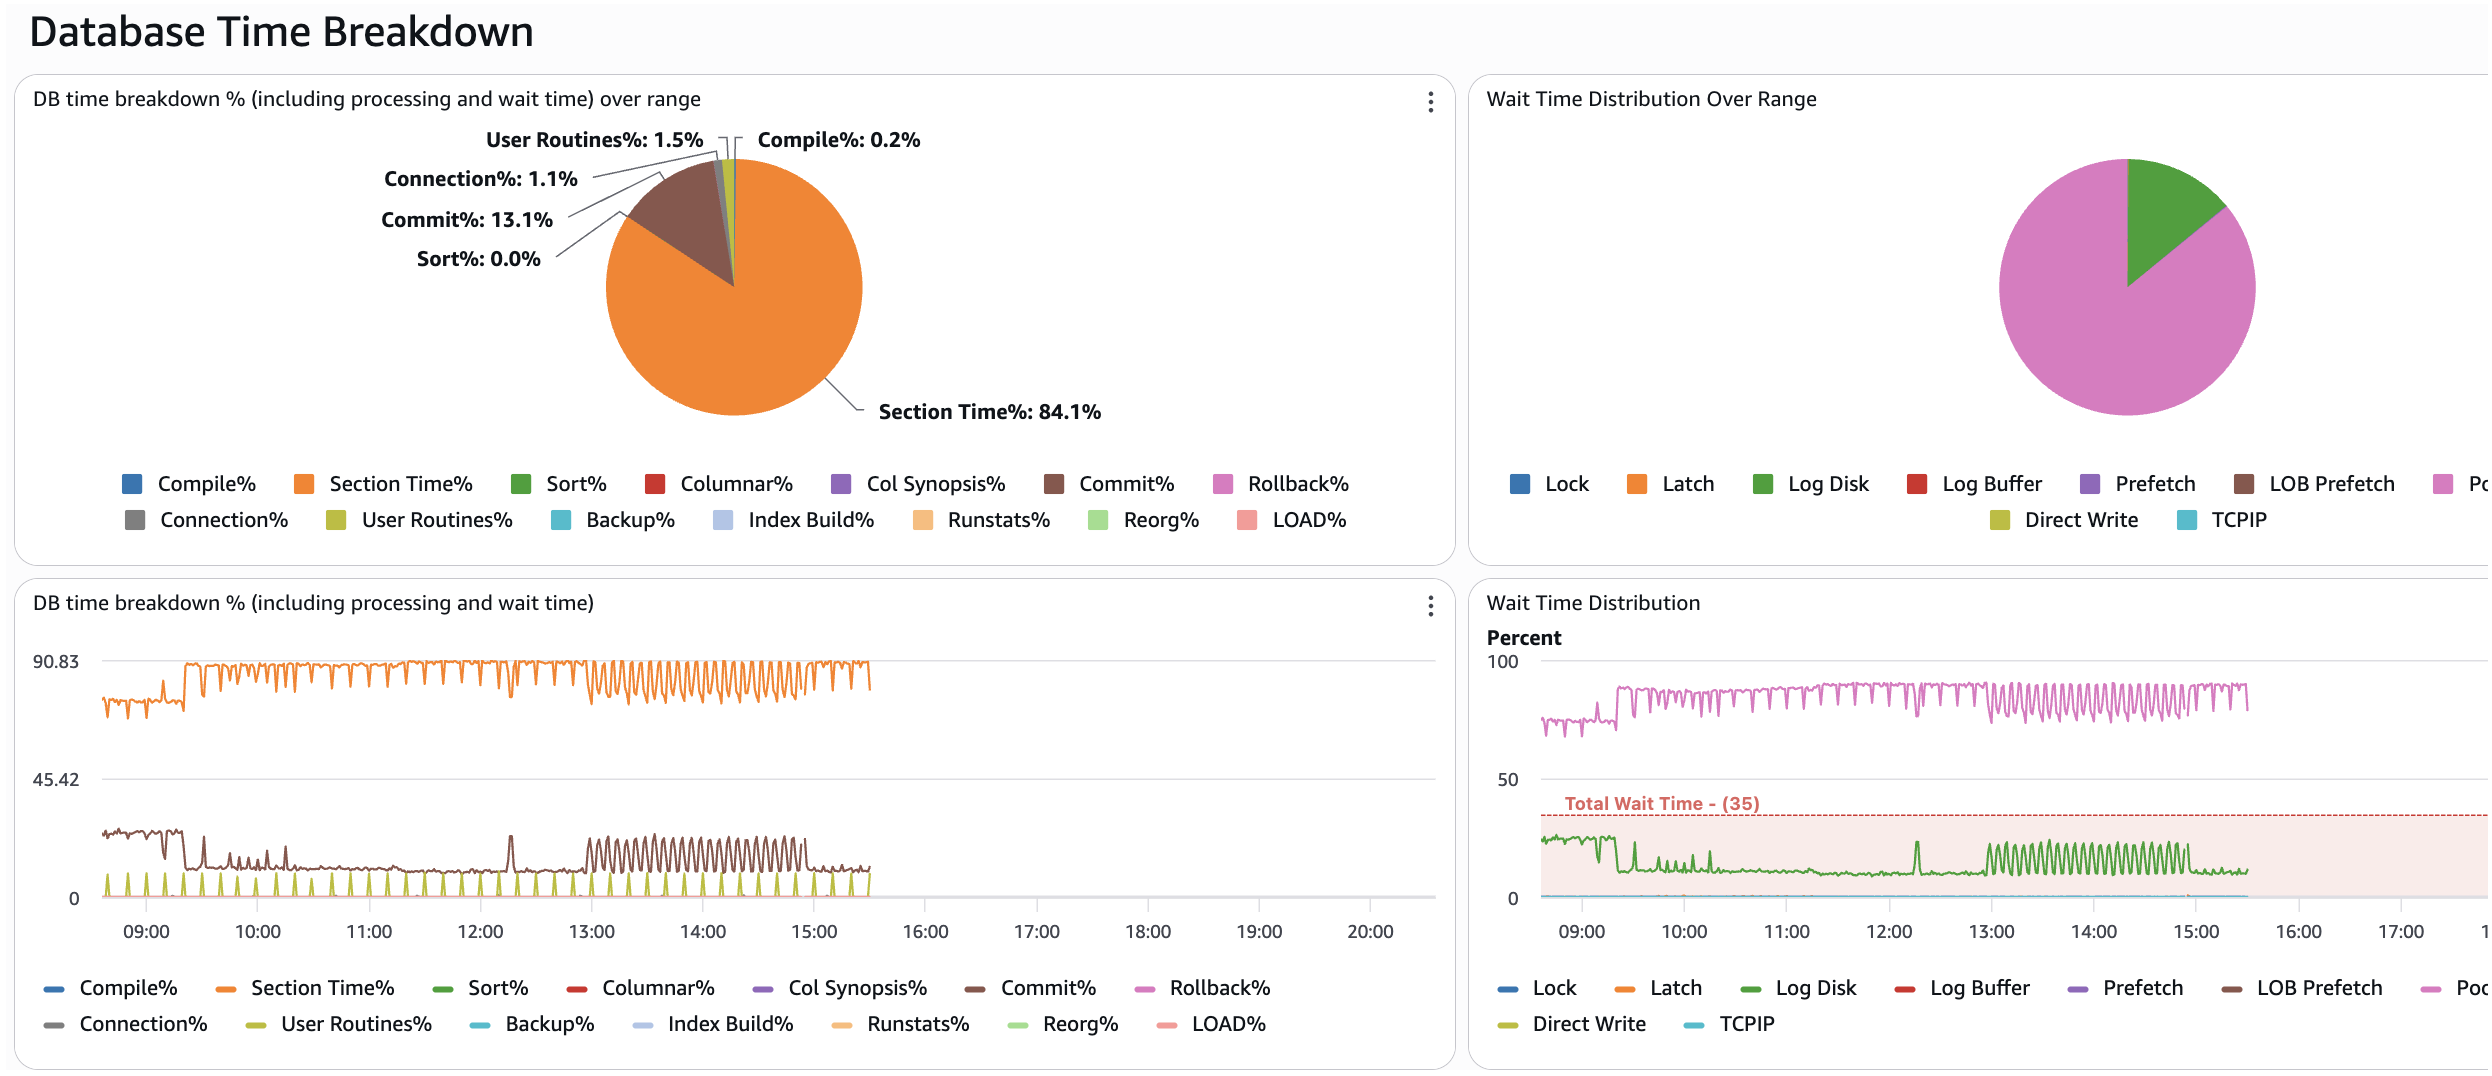
The provided screen snapshot illustrates the database time breakdown, encompassing wait time across the specified range. Additionally, the distribution of wait time over the range is depicted. This data serves as a valuable tool for analyzing the time allocated to various database activities, enabling further investigation.
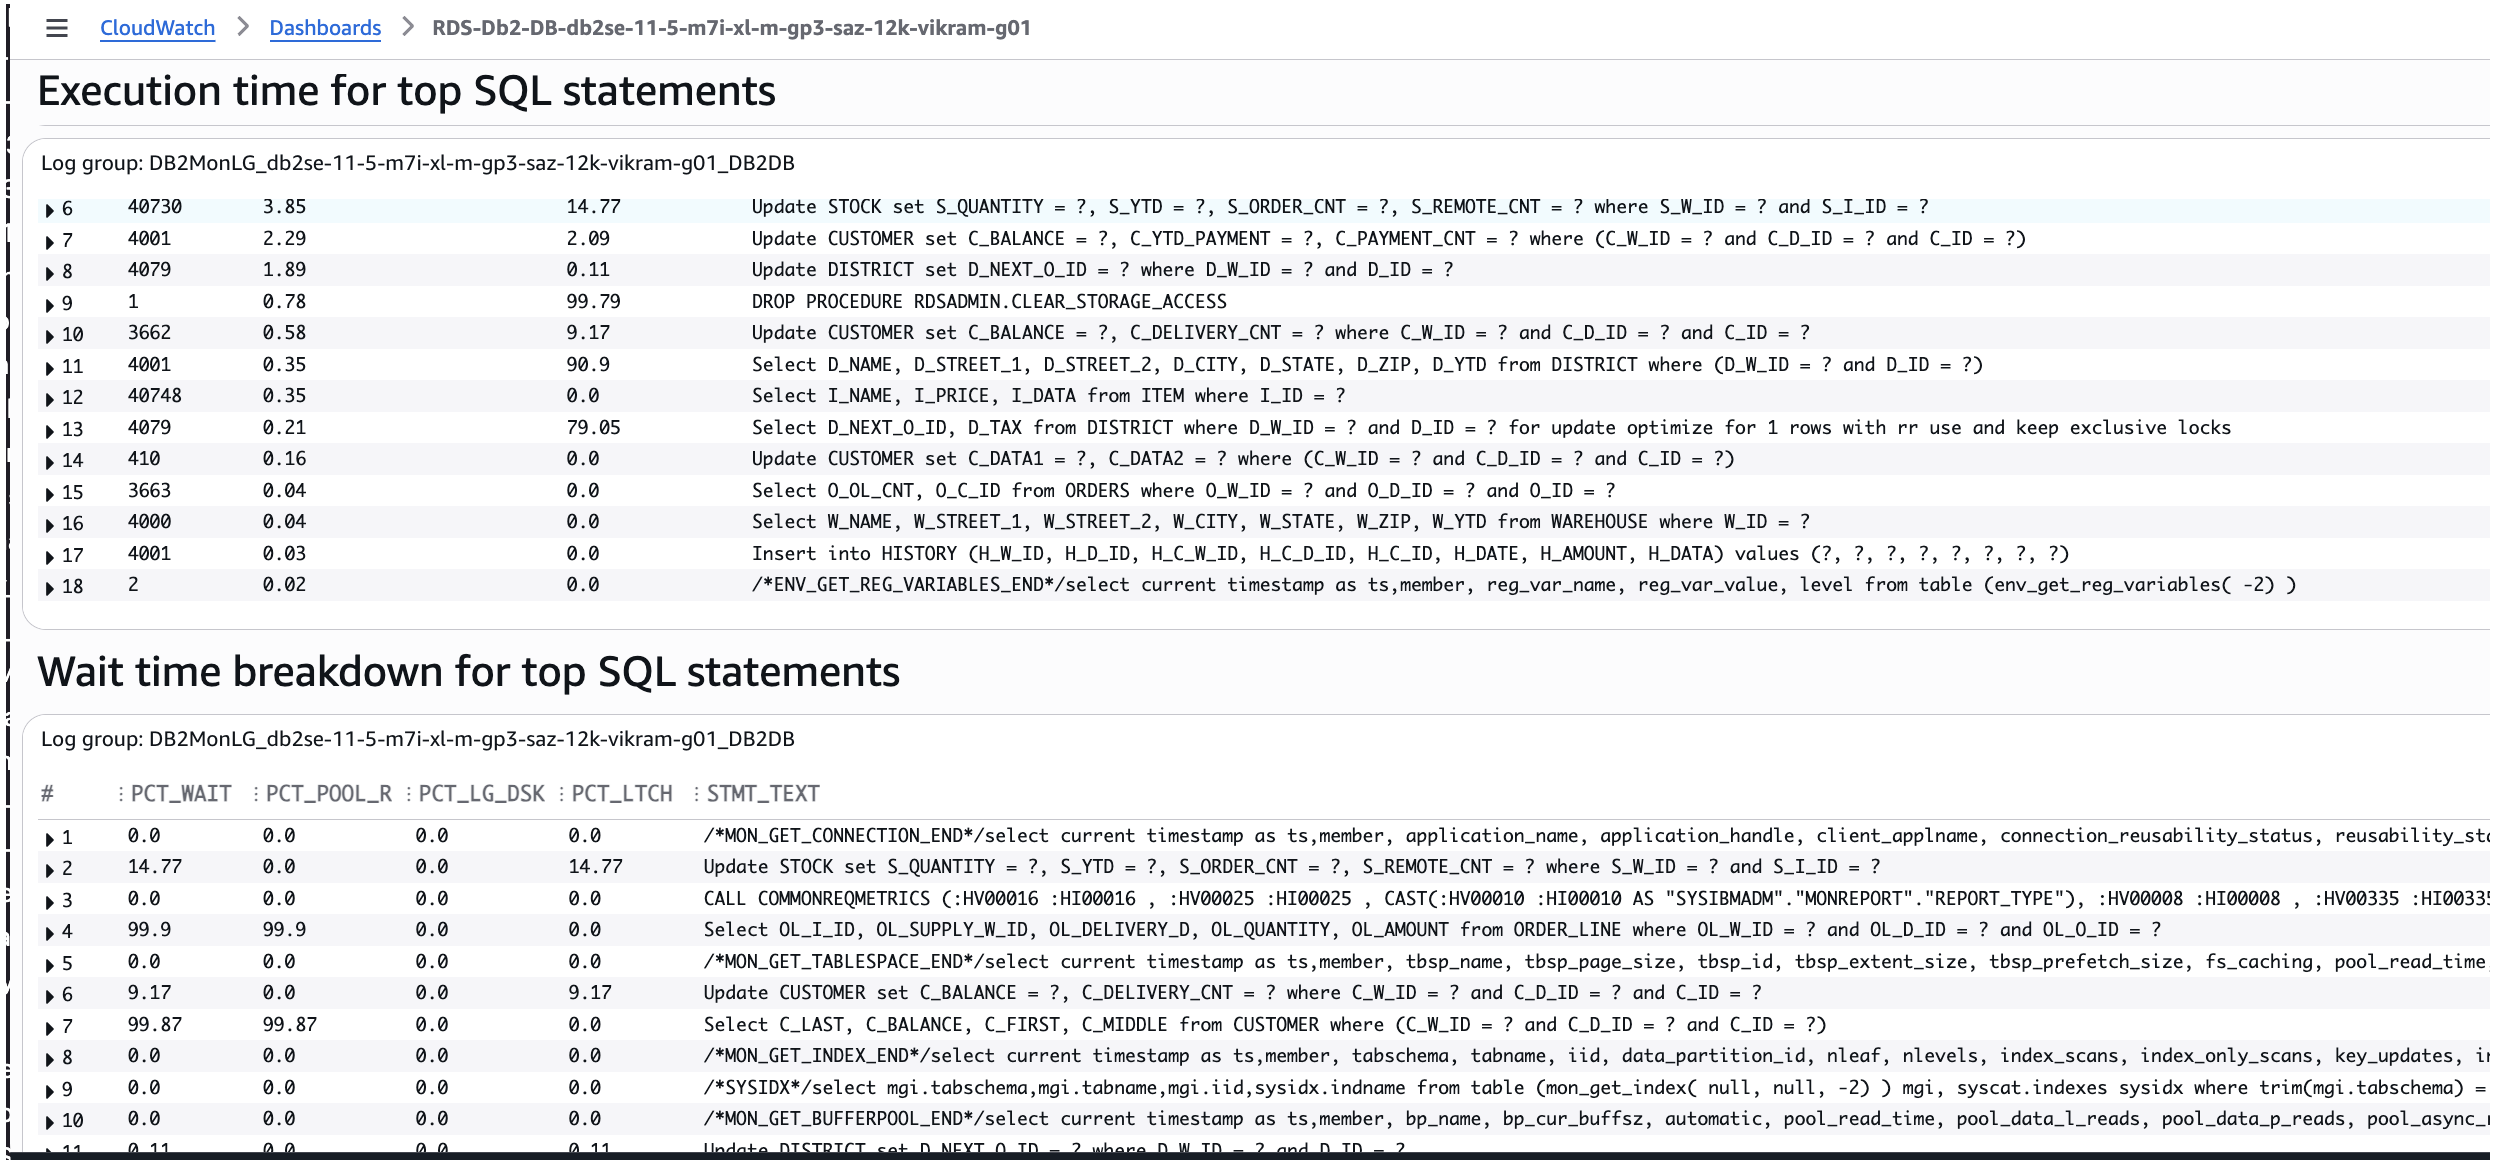
The provided screen capture illustrates the cost-intensive SQL statements categorized for targeted enhancement.
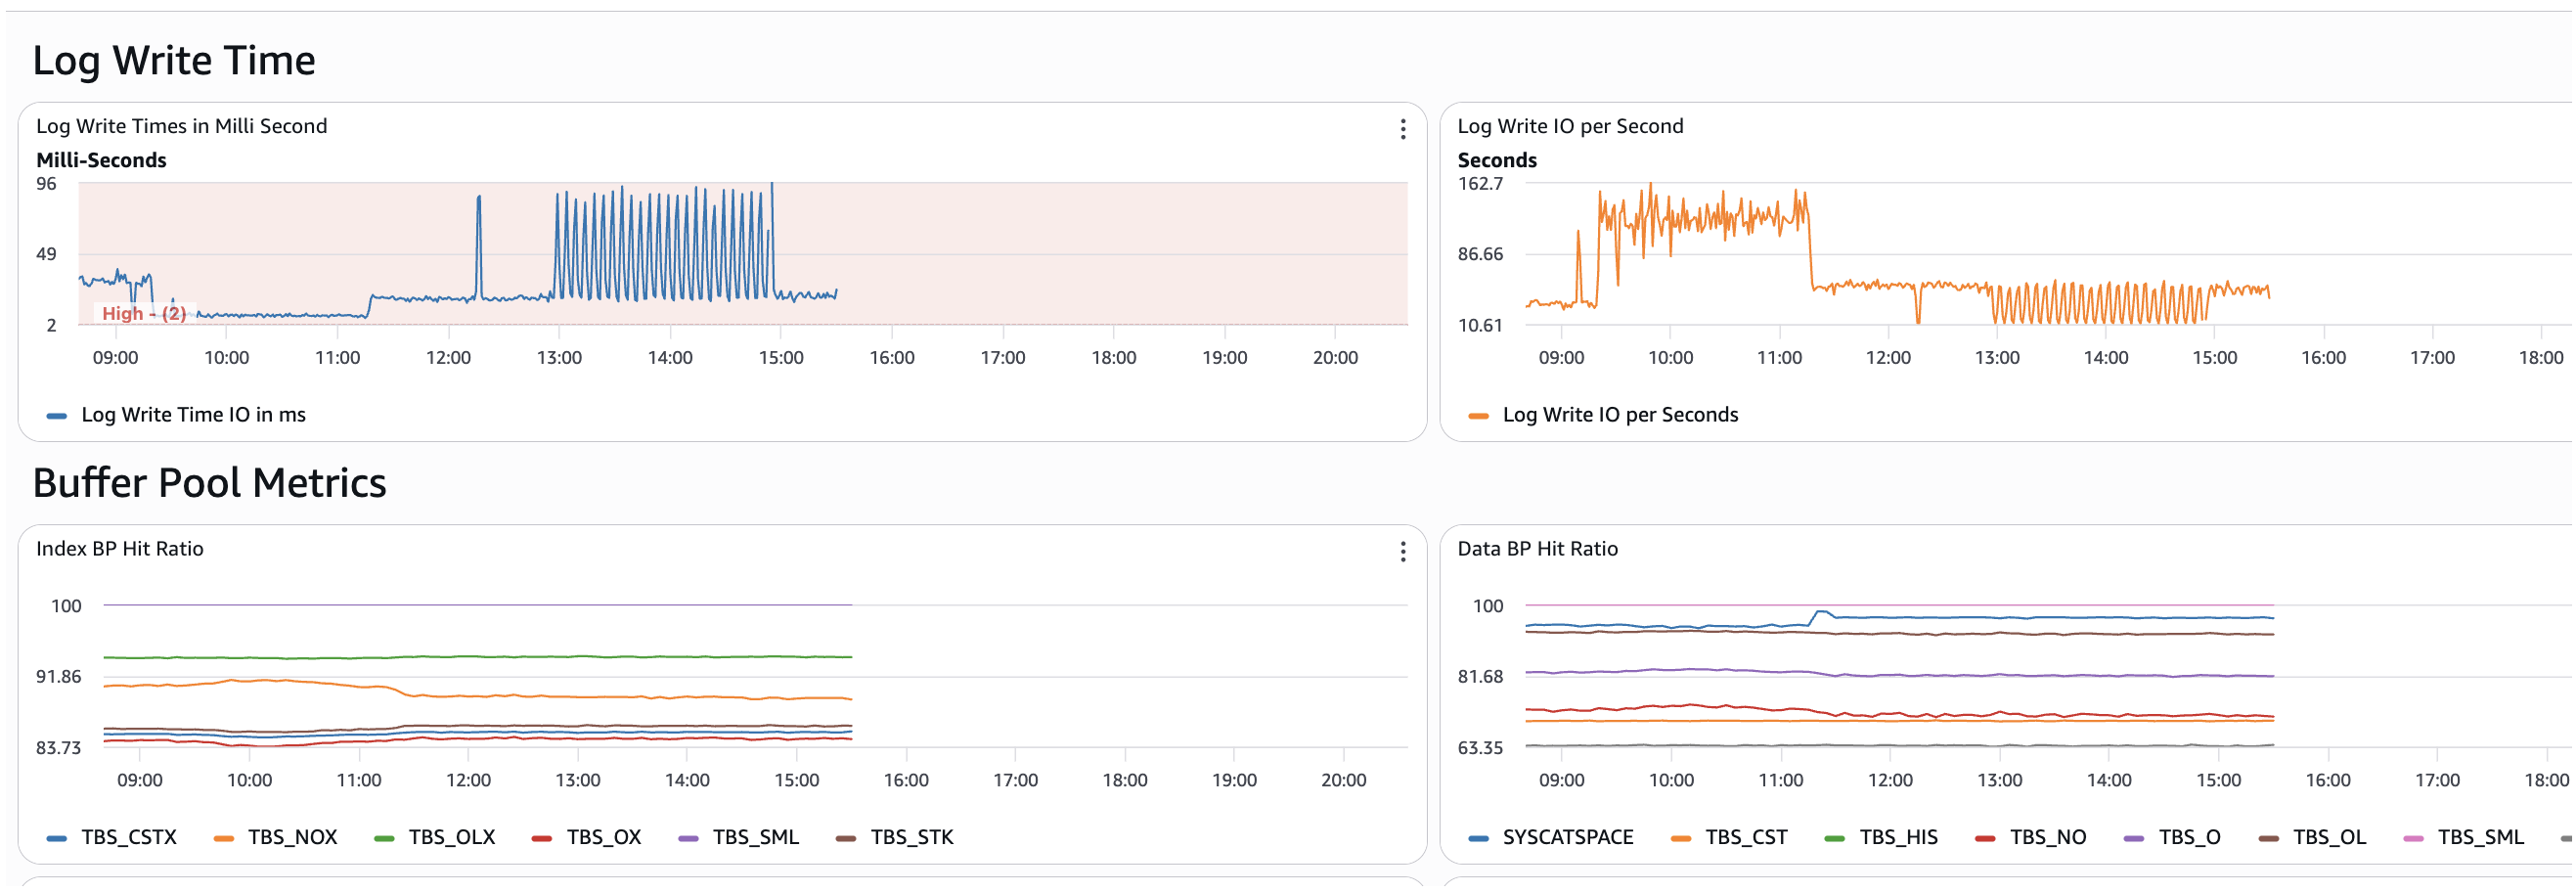
The provided screenshot illustrates the Db2 buffer pool activities for data and index, including the log write time information.
Note: The dashboard contains numerous widgets, with only a select few being displayed above.
The CloudWatch dashboard provides a feature called “Play” that allows users to activate it to view widgets over a specified time. An illustrative example is provided below.
Conclusion
In this post, we demonstrated how to deploy a fully automated Amazon CloudWatch monitoring dashboard for Amazon RDS for Db2 using a single shell script. This solution works in both internet-connected and air-gapped environments. It eliminates manual console configuration and provides comprehensive visibility into your database performance. Whether you’re running in a standard VPC or a highly secure private subnet, the deployment process remains the same. When you no longer need the monitoring infrastructure, you can run a single cleanup script to remove all resources.
Acknowledgments
Thanks to Rajib Sarkar and Umair Hussain for carefully reviewing this blog post.