AWS DevOps & Developer Productivity Blog
New – How to better monitor your custom application metrics using Amazon CloudWatch Agent
This blog was contributed by Zhou Fang, Sr. Software Development Engineer for Amazon CloudWatch and Helen Lin, Sr. Product Manager for Amazon CloudWatch
Amazon CloudWatch collects monitoring and operational data from both your AWS resources and on-premises servers, providing you with a unified view of your infrastructure and application health. By default, CloudWatch automatically collects and stores many of your AWS services’ metrics and enables you to monitor and alert on metrics such as high CPU utilization of your Amazon EC2 instances. With the CloudWatch Agent that launched last year, you can also deploy the agent to collect system metrics and application logs from both your Windows and Linux environments. Using this data collected by CloudWatch, you can build operational dashboards to monitor your service and application health, set high-resolution alarms to alert and take automated actions, and troubleshoot issues using Amazon CloudWatch Logs.
We recently introduced CloudWatch Agent support for collecting custom metrics using StatsD and collectd. It’s important to collect system metrics like available memory, and you might also want to monitor custom application metrics. You can use these custom application metrics, such as request count to understand the traffic going through your application or understand latency so you can be alerted when requests take too long to process. StatsD and collectd are popular, open-source solutions that gather system statistics for a wide variety of applications. By combining the system metrics the agent already collects, with the StatsD protocol for instrumenting your own metrics and collectd’s numerous plugins, you can better monitor, analyze, alert, and troubleshoot the performance of your systems and applications.
Let’s dive into an example that demonstrates how to monitor your applications using the CloudWatch Agent. I am operating a RESTful service that performs simple text encoding. I want to use CloudWatch to help monitor a few key metrics:
- How many requests are coming into my service?
- How many of these requests are unique?
- What is the typical size of a request?
- How long does it take to process a job?
These metrics help me understand my application performance and throughput, in addition to setting alarms on critical metrics that could indicate service degradation, such as request latency.
Step 1. Collecting StatsD metrics
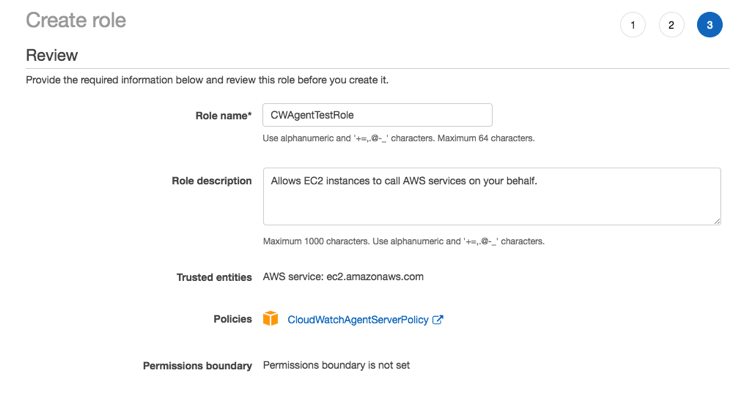
My service is running on an EC2 instance, using Amazon Linux AMI 2018.03.0. Make sure to attach the CloudWatchAgentServerPolicy AWS managed policy so that the CloudWatch agent can collect and publish metrics from this instance:
Here is the service structure:
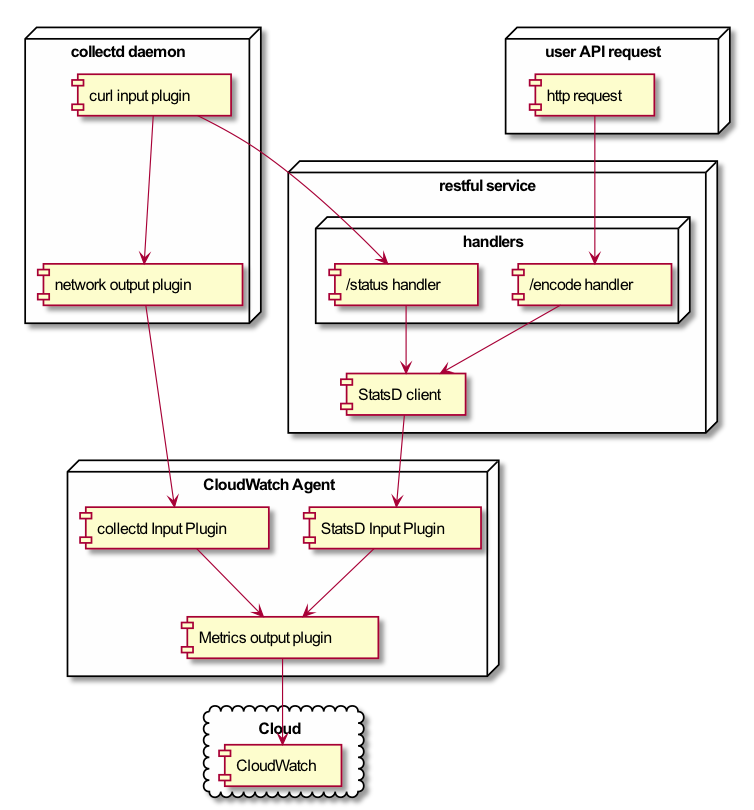
The “/encode” handler simply returns the base64 encoded string of an input text. To monitor key metrics, such as total and unique request count as well as request size and method response time, I used StatsD to define these custom metrics.
Note that I need to first choose a StatsD client from here.
The “/status” handler responds with a health check ping. Here I am monitoring my available JVM memory:
Step 2. Emit custom metrics using collectd (optional)
collectd is another popular, open-source daemon for collecting application metrics. If I want to use the hundreds of available collectd plugins to gather application metrics, I can also use the CloudWatch Agent to publish collectd metrics to CloudWatch for 15-months retention. In practice, I might choose to use either StatsD or collectd to collect custom metrics, or I have the option to use both. All of these use cases are supported by the CloudWatch agent.
Using the same demo RESTful service, I’ll show you how to monitor my service health using the collectd cURL plugin, which passes the collectd metrics to CloudWatch Agent via the network plugin.
For my RESTful service, the “/status” handler returns HTTP code 200 to signify that it’s up and running. This is important to monitor the health of my service and trigger an alert when the application does not respond with a HTTP 200 success code. Additionally, I want to monitor the lapsed time for each health check request.
To collect these metrics using collectd, I have a collectd daemon installed on the EC2 instance, running version 5.8.0. Here is my collectd config:
For the cURL plugin, I configured it to measure response time (latency) and response code (HTTP status code) from the RESTful service.
Note that for the network plugin, I used Encrypt mode which requires an authentication file for the CloudWatch Agent to authenticate incoming collectd requests. Click here for full details on the collectd installation script.
Step 3. Configure the CloudWatch agent
So far, I have shown you how to:
A. Use StatsD to emit custom metrics to monitor my service health
B. Optionally use collectd to collect metrics using plugins
Next, I will install and configure the CloudWatch agent to accept metrics from both the StatsD client and collectd plugins.
I installed the CloudWatch Agent following the instructions in the user guide, but here are the detailed steps:
Install CloudWatch Agent:
Configure CloudWatch Agent to receive metrics from StatsD and collectd:
Pass the above config (config.json) to the CloudWatch Agent:
In case you want to skip these steps and just execute my sample agent install script, you can find it here.
Step 4. Generate and monitor application traffic in CloudWatch
Now that I have the CloudWatch agent installed and configured to receive StatsD and collect metrics, I’m going to generate traffic through the service:
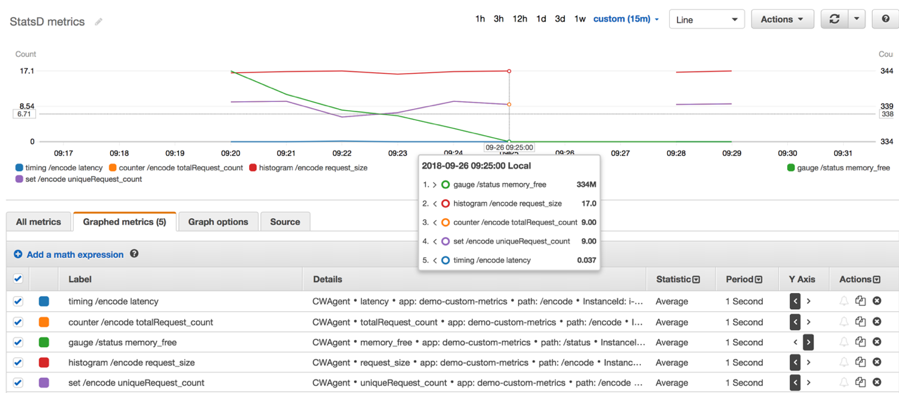
Next, I log in to the CloudWatch console and check that the service is up and running. Here’s a graph of the StatsD metrics:
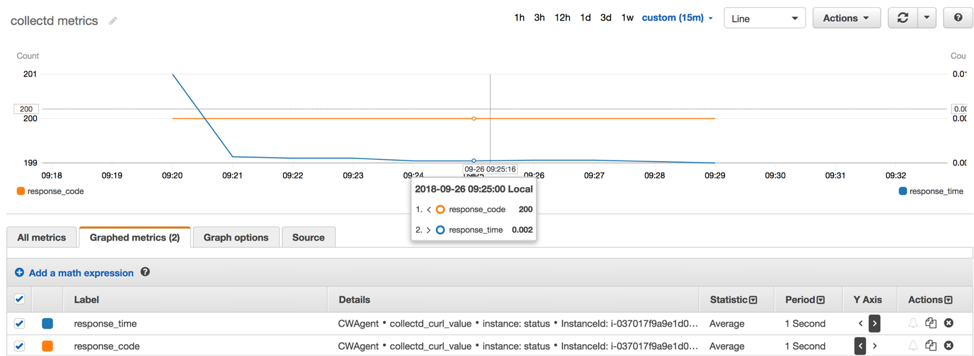
Here is a graph of the collectd metrics:
Conclusion
With StatsD and collectd support, you can now use the CloudWatch Agent to collect and monitor your custom applications in addition to the system metrics and application logs it already collects. Furthermore, you can create operational dashboards with these metrics, set alarms to take automated actions when free memory is low, and troubleshoot issues by diving into the application logs. Note that StatsD supports both Windows and Linux operating systems while collectd is Linux only. For Windows, you can also continue to use Windows Performance Counters to collect custom metrics instead.
The CloudWatch Agent with custom metrics support (version 1.203420.0 or later) is available in all public AWS Regions, AWS GovCloud (US), with AWS China (Beijing) and AWS China (Ningxia) coming soon.
The agent is free to use; you pay the usual CloudWatch prices for logs and custom metrics.
For more details, head over to the CloudWatch user guide for StatsD and collectd.