IBM & Red Hat on AWS
Stream Amazon CloudWatch metrics to IBM Instana with Amazon Data Firehose
Organizations running large-scale AWS workloads across hundreds of accounts, need an efficient way to analyze and visualize Amazon CloudWatch metrics without increasing operational costs or adding latency. While traditional API polling methods work well for many use cases, organizations need to optimize performance and cost when handling thousands of metrics at high frequency.
IBM Instana Observability (Instana) uses Amazon CloudWatch Metric Streams with Amazon Data Firehose to deliver near-real-time metrics directly from Amazon CloudWatch. This integration reduces operational overhead and provides predictable costs compared to traditional polling methods.
This post shows you how to connect Amazon CloudWatch Metric Streams to Instana via Amazon Data Firehose. You will also learn about the cost and performance advantages of this approach compared to traditional API polling methods.
Why Metric Streams?
With Amazon CloudWatch Metric Streams, you can continuously push metrics to a downstream destination (such as Amazon Data Firehose) instead of having a monitoring tool repeatedly poll for them.
Key benefits:
- Low latency: Metric updates flow to Instana within approximately 2–3 minutes instead of approximately 10 minutes with standard polling.
- Broad coverage: Automatically includes all CloudWatch namespaces and future metrics; no need to maintain polling logic.
- Operational efficiency: Amazon Data Firehose manages batching, retries, and delivery to Instana’s HTTPS ingestion endpoint.
- Cost predictability: Pricing based on the number of metric updates rather than per-call polling.
Cost benefits of metric streams
Using Amazon CloudWatch Metric Streams instead of API polling can significantly reduce your operational costs while improving data freshness. With metric streams, you pay only for the actual metric updates transmitted, rather than for API calls that might retrieve duplicate or unchanged data. This approach is particularly cost-effective for large-scale deployments where traditional polling methods would require frequent API calls to maintain current data.
For example, when monitoring thousands of resources across multiple AWS accounts, metric streams eliminate the need for repeated GetMetricData API calls, which can become costly at higher polling frequencies. Additionally, metric streams deliver updates within 2-3 minutes compared to the standard 10-minute delay with polling, providing better value through improved data timeliness and reduced API costs.
Architecture Overview
The architecture for streaming Amazon CloudWatch metrics to Instana using Amazon Data Firehose is shown in Figure 1:
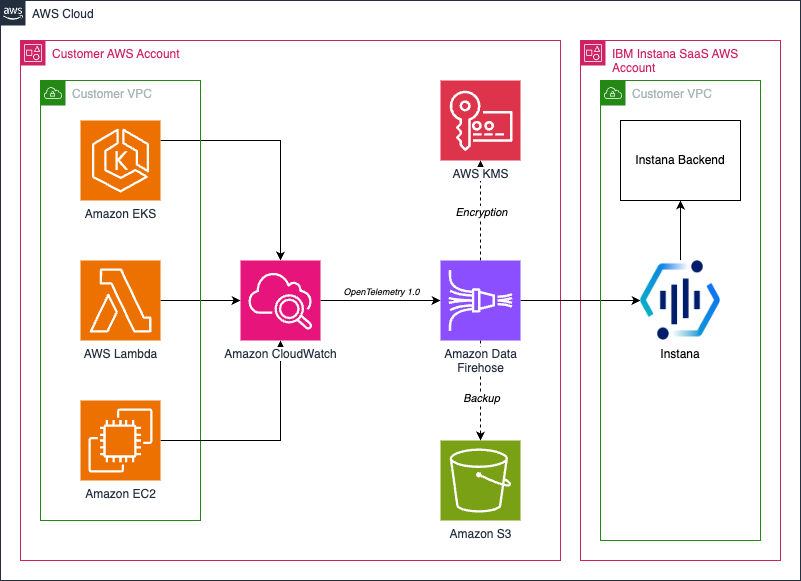
Figure 1. Reference architecture for streaming Amazon CloudWatch metrics to Instana via Amazon Data Firehose.
Here is how this works:
- Amazon CloudWatch Metric Streams publishes metric updates in near-real-time.
- Amazon Data Firehose buffers and delivers data to Instana’s HTTPS endpoint in OpenTelemetry 1.0.0 format.
- Instana automatically parses, normalizes, and visualizes metrics alongside traces and logs.
This configuration is designed to eliminate the need for frequent API polling or polling schedulers, simplifying ingestion at scale.
For production use cases, you can configure your Amazon Data Firehose metric streams to be backed up in Amazon Simple Storage Service (Amazon S3) by following the AWS documentation.
Costs
You are responsible for the cost of the AWS services used when deploying the resources mentioned in this blog in your AWS account. For cost estimates, see the pricing pages for each AWS service you use.
Implementation Steps
Prerequisites
This post assumes that you have the following prerequisites:
- AWS Account with permissions to create Amazon CloudWatch Metric Streams, Amazon Data Firehose delivery streams, and AWS Identity and Access Management (IAM) roles.
- Active Instana subscription with administrative access. You can start with an Instana 14-day free trial from AWS Marketplace
- Instana Agent Key for authentication
- Instana Ingestion Endpoint URL, available in your Instana workspace settings.
- Network access for outbound HTTPS connections from Amazon Data Firehose to Instana.
Create an Amazon Data Firehose delivery stream
- Log in to the AWS Management Console, navigate to Amazon Data Firehose, and choose Create Firehose stream.
- As shown in Figure 2, on the Create Firehose stream page, for Source, choose Direct PUT. For Destination, choose HTTP Endpoint. For Firehose stream name, enter a descriptive name for your stream. This will be used in step 7.
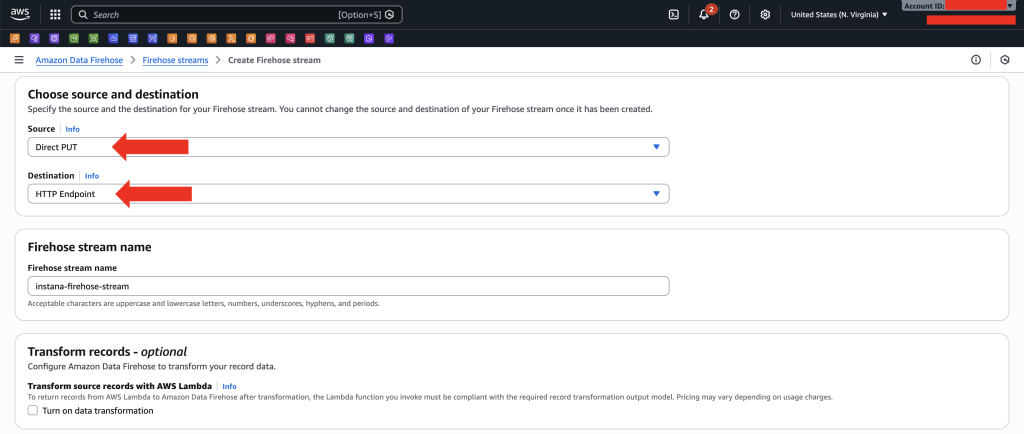
Figure 2. Amazon Data Firehose source and destination configuration showing Direct PUT source and HTTP Endpoint destination.
- In the Destination settings section, for HTTP endpoint URL, enter your Instana OpenTelemety endpoint URL with your Instana region:
https://otlp-<your-instana-region>-saas.instana.io/v1/metrics/cloudwatch
- Add your Instana API Key for authentication, set Content Encoding to GZIP, and configure a Retry Duration of 60 seconds. Figure 3 shows the destination settings configuration.
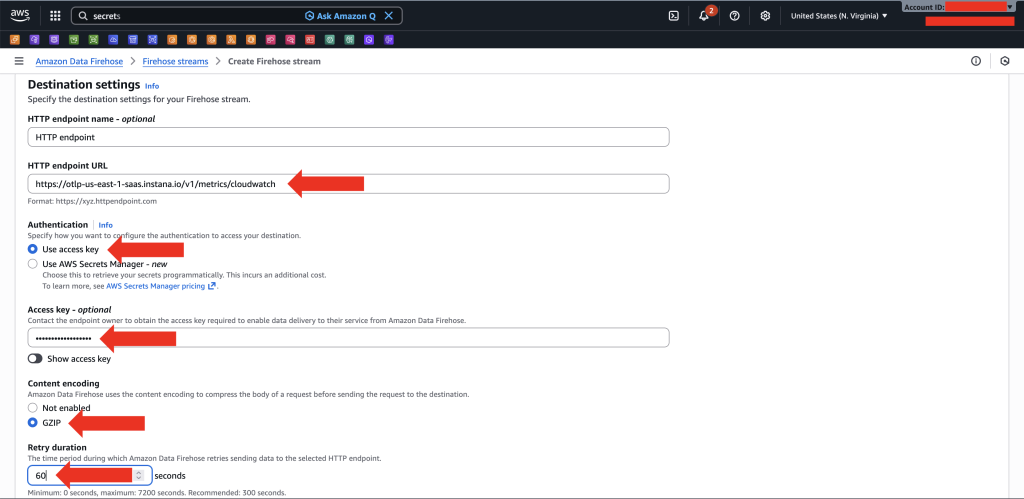
Figure 3. Amazon Data Firehose destination settings showing HTTP endpoint URL, API key, content encoding, and retry duration fields.
- In the Buffer hints, compression and encryption section, configure the buffer settings. Buffer settings determine the trade-off between cost, latency, and delivery frequency:
- Higher buffer values result in lower cost but higher latency
- Lower buffer values result in faster delivery but higher cost
- To achieve near-real-time metric delivery, keep buffer values low. For Buffer size, enter 1 MiB. For Buffer interval, enter 60 seconds. Figure 4 shows the buffer configuration settings:
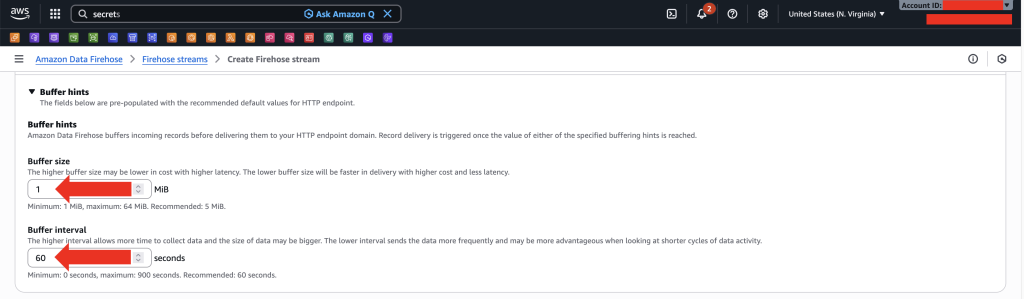
Figure 4. Amazon Data Firehose buffer configuration showing buffer size set to 1 MiB and buffer interval set to 60 seconds.
Create an Amazon CloudWatch Metric Stream
- Navigate to the Amazon CloudWatch console, choose Metrics, choose Streams, and then choose Create metric stream as shown in Figure 5.
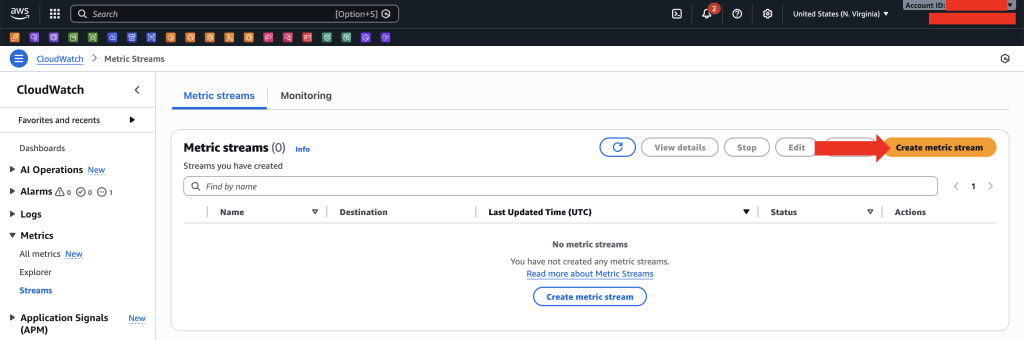
Figure 5. Amazon CloudWatch console showing the Metric Streams page with Create metric stream button highlighted.
- For Destination, choose Custom setup with Firehose.
- Choose the Data Firehose stream created in step 2. Expand the Change output format (optional) section and choose OpenTelemetry 1.0. Figure 6 shows the destination and output format configuration:
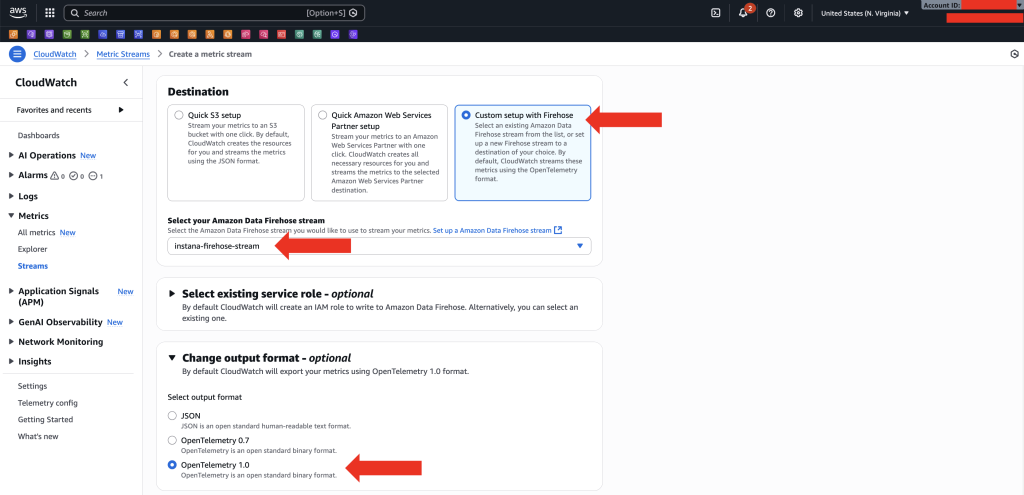
Figure 6. Amazon CloudWatch Metric Stream destination configuration showing Custom setup with Firehose selected and OpenTelemetry 1.0 format.
Note: Instana supports OpenTelemetry 1.0 format.
- In the Metrics to be streamed section, choose All metrics to ensure comprehensive metric coverage. For Metric stream name enter a descriptive name for your stream. Figure 7 shows the metrics selection and stream name:
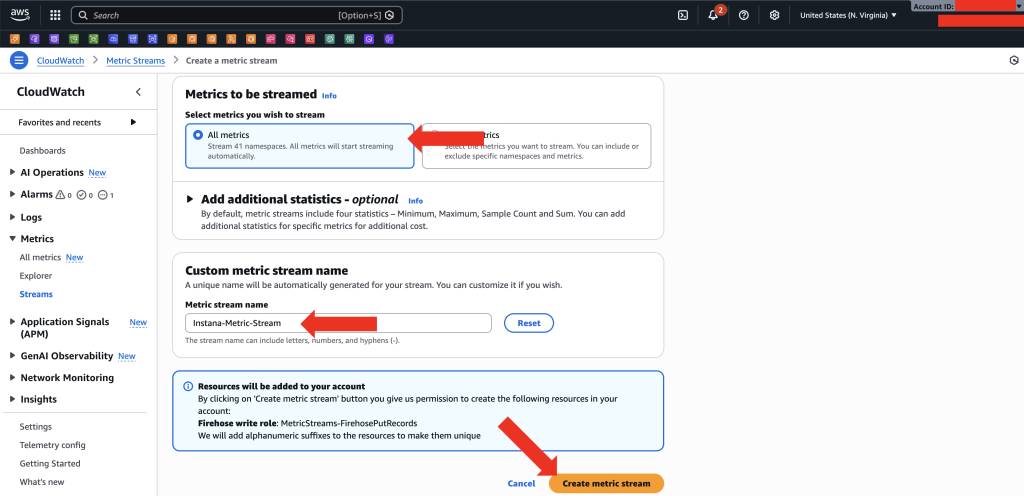
Figure 7. Amazon CloudWatch Metric Stream configuration showing All metrics selected and metric stream name field.
- Review your configuration and choose Create metric stream to complete the setup.
How to use and visualize AWS Metric Streams in Instana
After the Amazon CloudWatch metric stream is created, metrics flow from Amazon CloudWatch to Instana in approximately 2–3 minutes.
View AWS Metric Streams entity in Instana
- Log into the Instana console. Navigate to Infrastructure and locate the AWS MetricStreams entity.
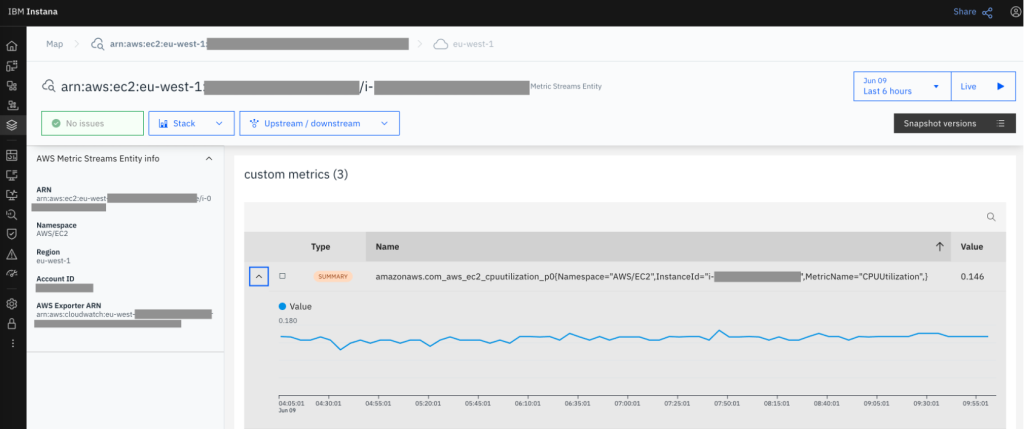
Figure 8. Instana infrastructure dashboard displaying an AWS Metric Streams entity.
Figure 8 shows an AWS Metric Streams withe the following infrastructure metric:
amazonaws.com_aws_ec2_cpuutilization_p0{Namespace=”AWS/EC2″, InstanceId=”<<your-instana-id>>”, MetricName=”CPUUtilization”}
Each metric is composed of:
- Metric name:
- com_aws_ec2_cpuutilization_p0
- Metric dimensions:
- Namespace=”AWS/EC2″
- InstanceId=”<<your-instana-id>>”
- MetricName=”CPUUtilization”
The metric name follows a base pattern with a suffix defining the statistical aggregation. For example:
- p0 = minimum
- p1 = maximum
- sum = summary value
- count = number of data points within the aggregation period
Metric dimensions define the context of each metric using the following Amazon CloudWatch attributes:
- Namespace: aligns with the Amazon CloudWatch metric namespace
- MetricName: corresponds to the Amazon CloudWatch metric name
- InstanceId: identifies the monitored Amazon Elastic Compute Cloud (Amazon EC2) instance
Create a custom dashboard in Instana
- In the Instana console, navigate to Custom Dashboards, and choose Create Dashboard.
- Enter the name of your Custom Dashboard and choose Create as shown in Figure 9.
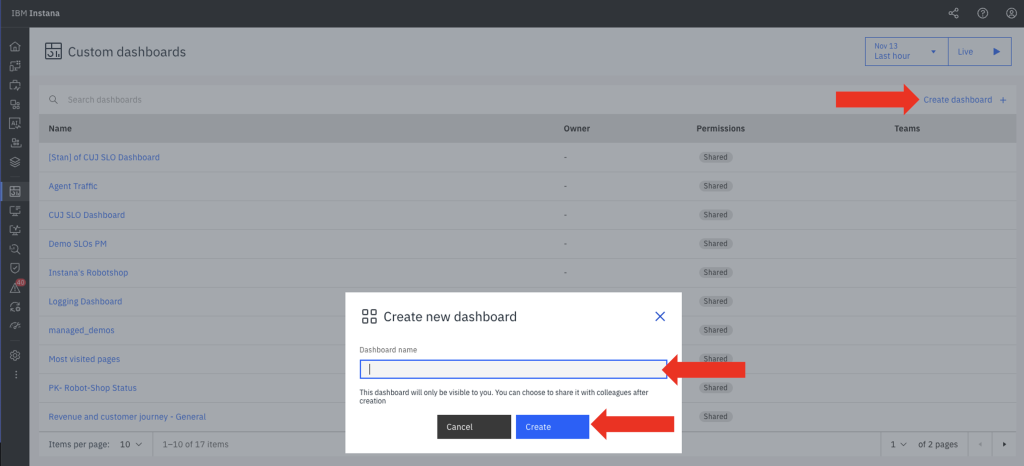
Figure 9. Creating a new Custom Dashboard in Instana
- As shown in Figure 10, Choose Add widget and select Chart: time series and choose Next.

Figure 10. Choosing the Chart Type for a Dashboard in Instana.
- Select following options and choose Create as shown in Figure 11:
-
- Data source: Infrastructure & platforms.
- Metrics: select one of the EC2 metrics.
- Aggregation: mean
- Group: Other->metric.tag.InstanceID
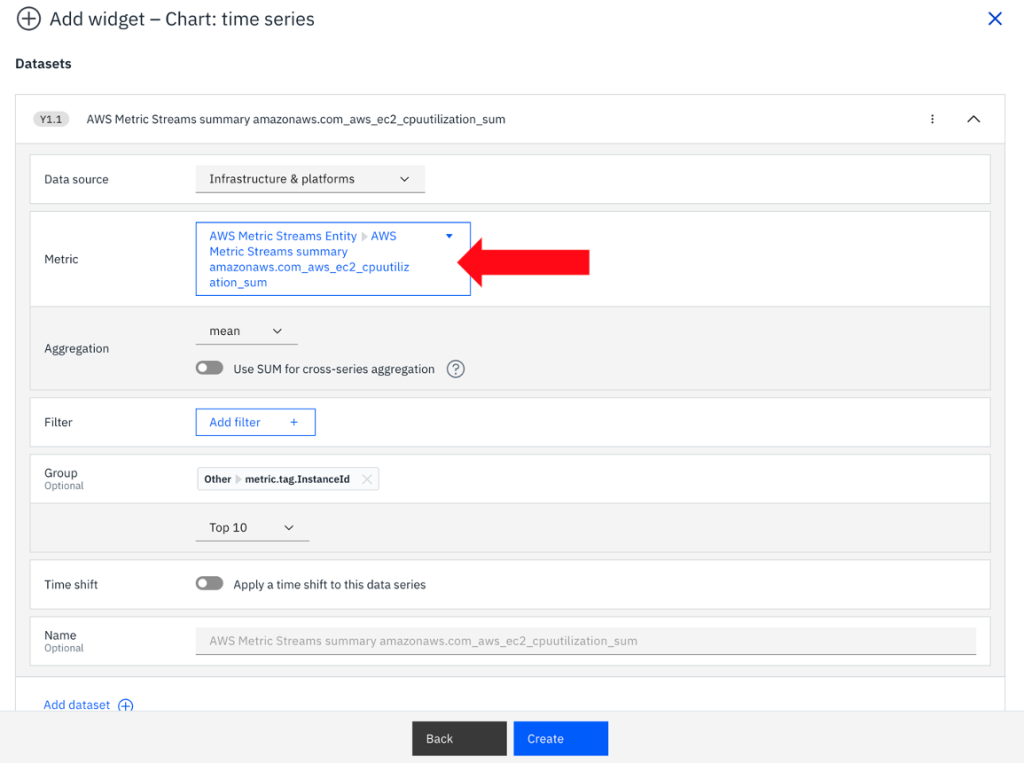
Figure 11. Custom dashboard configuration for CPU utilization across multiple Amazon EC2 instances.
Now you have an Instana custom dashboard configuration designed to monitor CPU utilization for the top 10 Amazon EC2 instances. CPU utilization is derived from the amazonaws.com_aws_ec2_cpuutilization_sum metric, with results grouped by the InstanceId metric dimension.
- After configuring your dashboard, choose Save. The dashboard displays real-time metrics from Amazon CloudWatch. It presents the time-series graph of CPU utilization for the top 10 Amazon EC2 instances, as defined in the Instana custom dashboard configuration. Figure 12 shows the resulting time-series visualization:

Figure 12. Instana dashboard displaying CPU utilization time-series graph for top 10 Amazon EC2 instances.
Proactive Monitoring with Custom Events
Once AWS CloudWatch metrics are ingested into Instana through Metric Streams, users can go beyond visualization by defining custom event conditions that automatically detect performance anomalies. These events enable proactive alerting and automation, ensuring that issues like resource saturation or service degradation are caught early; before they impact end users.
As shown in Figure 13, Navigate to Settings -> Events and choose New Event:
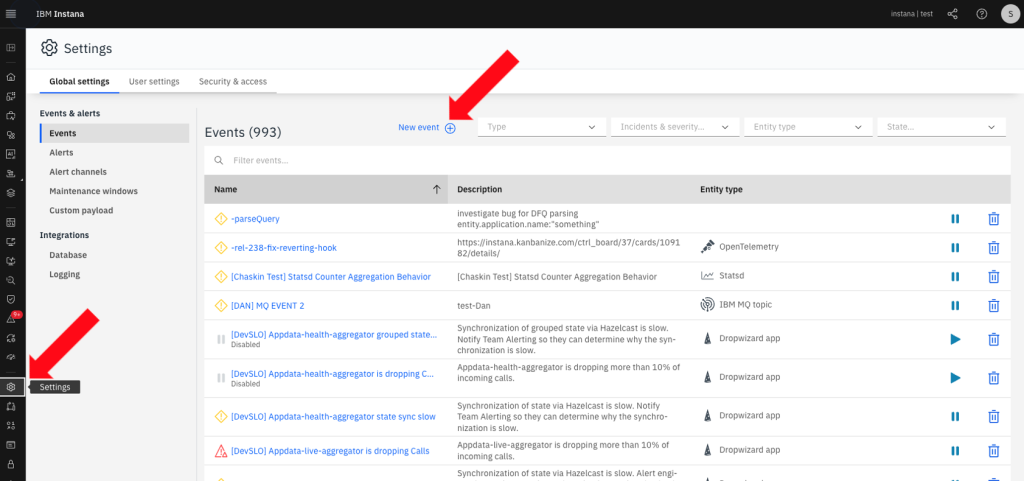
Figure 13. New Event creation in Settings in Instana.
As shown in Figure 14, in the New Event details configure the following:
- Event Name: “CPU utilization too high”
- Source: Custom metrics from the AWS Metric Streams entity
- Aggregation: Average CPU utilization over a 60-second window
- Threshold Condition: Trigger if the average CPU utilization exceeds 1.5
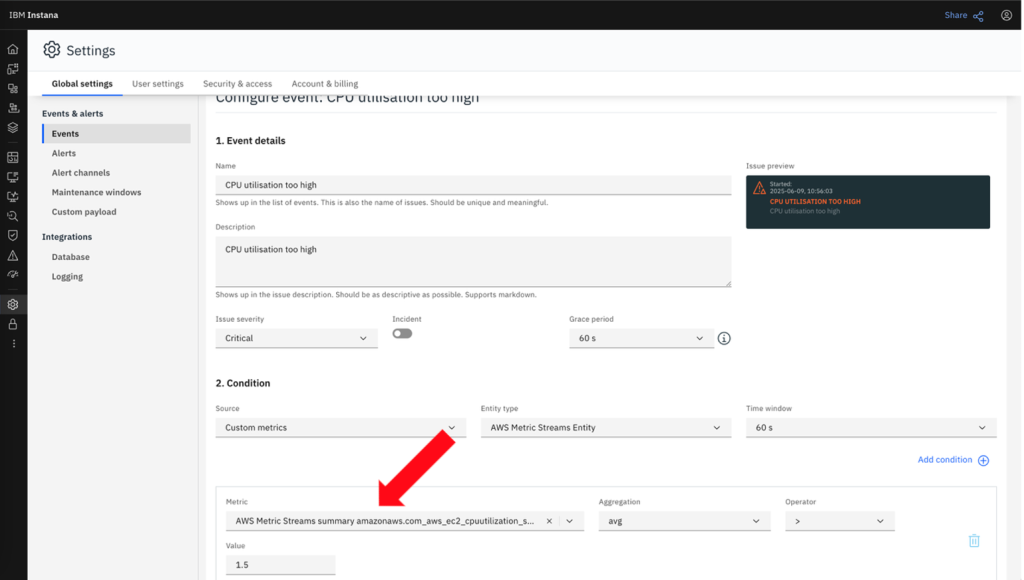
Figure 14. Configure a Custom Event in Instana.
You have configured a custom event in Instana, where the metric amazonaws.com_aws_ec2_cpuutilization_sum is used to monitor CPU utilization for EC2 instances streamed via AWS Metric Streams.
By setting this condition, the user ensures that Instana continuously evaluates incoming CloudWatch metrics in real time, automatically raising an alert when the threshold is breached.
When the Event conditions are met, an Issue is going to be triggered. To find the Issue, as shown in Figure 15, navigate to Events on the left-hand side and under Issues you will find the Event.

Figure 15. Alert for Custom Event in Instana displaying a triggered alert for high CPU utilization.
Choose Triggered Event to see the details as shown in Figure 16.
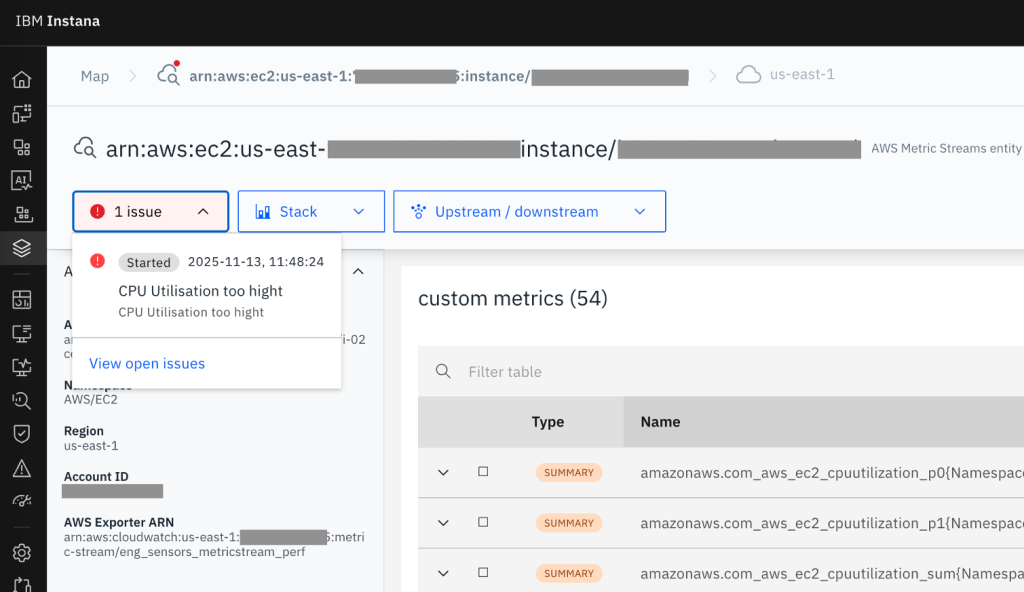
Figure 16. Information about alert start time and link to view open issues related to the Amazon EC2 instance with active alert for high CPU utilization. Displayed metrics include Amazon CloudWatch CPU utilization metrics streamed via Metric Streams.
When the defined CPU threshold is exceeded, Instana automatically generates a critical alert attached to the affected EC2 instance entity. This provides immediate visibility into both the symptom (high CPU utilization) and the context (affected service, namespace, and region).
Creating custom events allows teams to align their monitoring strategy with operational priorities – turning raw CloudWatch data into actionable alerts. By leveraging AWS Metric Streams with Instana’s AI-driven event framework, DevOps and SRE teams gain:
- Real-time detection of performance issues
- Automated correlation of metrics to specific AWS entities
- Reduced MTTR (Mean Time To Repair) through immediate contextual awareness
- Consistent alerting across multi-account and multi-region AWS deployments
This proactive approach ensures AWS workloads remain reliable, performant, and fully observable; powered by continuous metric streaming and intelligent event automation in Instana.
Clean up Instructions
After validating the integration and confirming that metrics are successfully flowing from Amazon CloudWatch Metric Streams to Instana, you can remove the resources in your AWS account to avoid incurring ongoing costs.
Follow these steps to clean up your environment:
- Delete the CloudWatch Metric Stream: This stops CloudWatch from continuously publishing metrics to the delivery stream.
- Delete the Amazon Data Firehose Delivery Stream: Deleting the Firehose stream prevents additional data delivery charges.
- Remove IAM Roles or Policies (if created manually): This ensures that temporary permissions used for testing are revoked.
Optional: If you configured Amazon S3 backup for your Amazon Data Firehose stream, delete the S3 bucket and its contents.
After cleanup, all associated AWS resources and data pipelines will be removed, ensuring that no additional costs accrue.
Your Instana workspace will retain historical metric data for analysis and reporting, allowing you to revisit the integration anytime by redeploying the Firehose and Metric Stream configuration.
Conclusion
By streaming Amazon CloudWatch metrics to IBM Instana using Amazon Data Firehose and CloudWatch Metric Streams, you move from reactive, sample-based monitoring to a continuous, near real-time observability pipeline that scales with your AWS footprint. This architecture removes the operational burden of managing custom polling jobs, reduces the risk of throttling, and ensures that new services and accounts are automatically covered without additional engineering effort.
From a financial perspective, adopting Metric Streams can deliver a significant cost advantage; often around a 3× reduction in ingestion cost compared to aggressive 1-minute GetMetricData polling—while also improving data freshness from roughly 10 minutes down to 2–3 minutes. Because charges are based on metric updates instead of API calls, costs remain predictable and linear as you expand.
When combined with Instana’s full-stack visibility, dynamic service graph, Golden Signals, AI-driven root-cause analysis, and custom events, these streamed metrics become actionable intelligence rather than raw data. Teams can detect issues earlier, understand impact faster, and consistently reduce MTTR across multi-account, multi-region, and hybrid environments.
As a next step, start by enabling Metric Streams for a high-value workload on Amazon EC2, Amazon Elastic Kubernetes Service (Amazon EKS), or AWS Lambda, wire it through Amazon Data Firehose into Instana, and validate the insights and cost profile. From there, you can confidently roll out this pattern across your AWS organization as a standard, scalable, and cost-efficient observability foundation.
Additional Content:
- Monitor and Optimize Amazon EKS Costs with Instana and Kubecost
- Monitoring Amazon Bedrock Large Language Models with Instana
- Automate Observability for AWS with Instana self-hosted
- Realtime monitoring of microservices and cloud-native applications with Instana SaaS on AWS
- Automatically Visualize and Monitor Applications on Amazon EKS with Instana
- What is Instana
- Using Instana for full stack observability on AWS
- AWS Partner IBM