AWS Cloud Operations Blog
Automating Amazon CloudWatch Alarms with AWS Systems Manager
Amazon CloudWatch is a monitoring and observability service built for DevOps engineers, developers, Site Reliability Engineers (SRE), and IT managers. CloudWatch provides you with data and actionable insights to monitor your applications, respond to system-wide performance changes, optimize resource utilization, and get a unified view of operational health.
Are you looking for an automated way of setting up CloudWatch Alarms for EC2 instances? Are you looking to decrease alarm fatigue using composite alarms and improve your mean-time-to-detection (MTTD) of operational issues?
In this blog post, we demonstrate how to automate the setup and configuration of CloudWatch alarms on Amazon EC2 in addition to collecting more system level metrics with the Amazon CloudWatch agent.
Using Amazon CloudWatch Alarms
CloudWatch has two types of alarms, metric alarms and composite alarms. Metric alarms include a single CloudWatch metric or the result of a math expression based on CloudWatch metrics. Composite alarms include a rule expression that combines the alarm state of other alarms that you have created.
Using composite alarms can reduce alarm noise. You can create multiple metric alarms, and also create a composite alarm and set up alerts only for the composite alarm. For example, a composite might go into ALARM state only when all of the underlying metric alarms are in ALARM state.
When you create an alarm, you specify three settings to enable CloudWatch to evaluate when to change the alarm state:
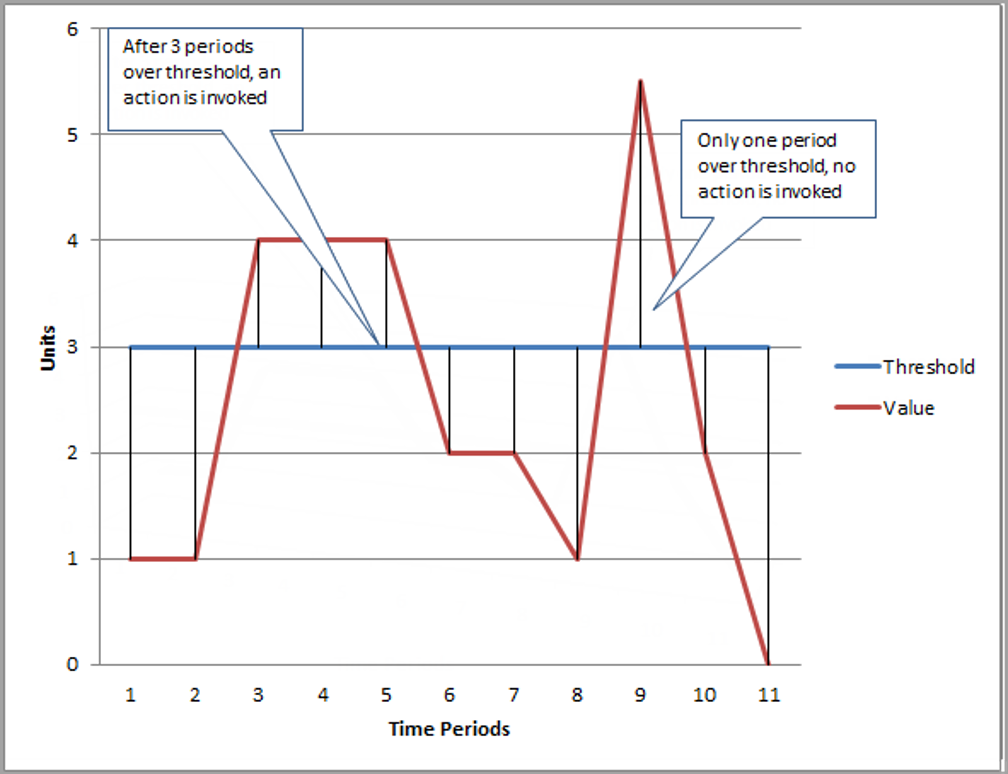
- Period is the length of time to evaluate the metric or expression to create each individual data point for an alarm. It is expressed in seconds. If you choose one minute as the period, there is one data point every minute.
- Evaluation Period is the number of the most recent periods, or data points, to evaluate when determining alarm state.
- Datapoints to alarm are the number of data points within the evaluation period that must be breaching to cause the alarm to go to the ALARM state. The breaching data points don’t have to be consecutive. They must all be within the last number of data points equal to evaluation period.

Figure: N periods over threshold trigger CloudWatch Alarm
In this blog post, the following AWS services are discussed:
Prerequisites
The solution has the following prerequisites:
1. The necessary controls, processes, event rules, and infrastructure have to be set up in every Region where EC2 instances are using CloudWatch logging and monitoring. Amazon CloudWatch and AWS Lambda are also regional services.
2. Systems Manager agent must be installed on all EC2 instances to use Systems Manager automation. It comes installed by default on all latest AWS provided Windows and Linux instances. However, if the instance image is older, manual installation of Systems Manager agents must be done in order to use automation. Check the following links for details on how to install and configure Systems Manager agents.
- Installing and configuring Systems Manager agent on Linux instances
- Installing and configuring Systems Manager agent on Windows instances
3. On an Amazon EC2 instance, it is required that the Amazon CloudWatch agent has the version 2.2.93.0 or later. Before you install the CloudWatch agent, update or install Systems Manager agent on the instance if you haven’t already done so.
4. All accounts and Regions using this solution must have Systems Manager and Amazon S3 endpoints enabled in order to allow Systems Manager to download CloudWatch agent from Amazon S3 onto each individual EC2 instance.
5. The Lambda function is per account, per Region, and creates resources required for the alarm setup. These resources include Amazon SNS topic, Systems Manager Automation document, CloudWatch Events, and rules.
6. All EC2 instances must have default EC2 role for Systems Manager that allows them to communicate to Systems Manager service. Make sure to attach the default IAM role to your provisioned EC2 instance: AWSEC2DefaultRole. Role must have the following policies:
- “CloudWatchAgentServerPolicy” to be able to send its logs to CloudWatch log groups
- Systems Manager role – AmazonEC2RoleforSSM, AmazonSSMManagedInstanceCore
Note: Any instance without this role is not eligible to use this solution. It is not able to send its application, system, or security logs to CloudWatch Logs.
Solution overview

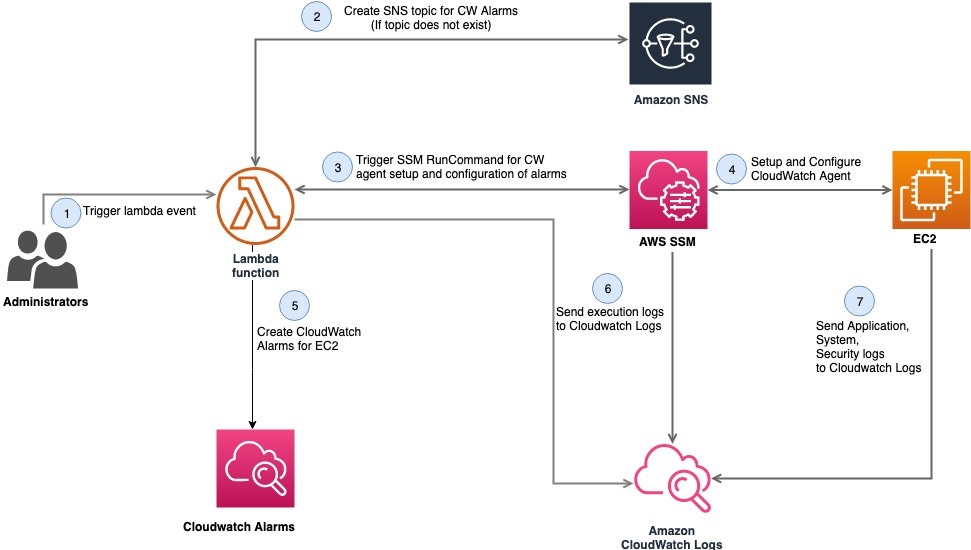
Figure: Set up CloudWatch Alarms with AWS Systems Manager
As shown in the diagram, the steps are as follows:
- A Lambda function is triggered either by administrators going into AWS Management Console, or by sending an event to AWS Lambda. An event is comprised of an InstanceId and SNS topic name (optional).
- AWS Lambda then checks for the existence of the SNS topic in the account. If the SNS topic does not exist, the AWS Lambda function creates the SNS topic with the name passed in the event. If no name is passed, it creates an SNS topic with a default name. If the SNS topic exists, it uses that topic to send an alarm notification for CloudWatch alarms.
- The AWS Lambda function takes the instance ID passed in the event to send commands using Systems Manager to an Amazon EC2 instance to install and configure CloudWatch agents. If no instance ID is passed in the event, AWS Lambda assumes it should install and configure Amazon CloudWatch agents on all running Amazon EC2 instances.
- AWS Lambda invokes the Systems Manager send command and sends automation request to Systems Manager agents residing on individual servers for the following tasks:
- Installation of Amazon CloudWatch agents.
- Checks for Amazon CloudWatch agent installation.
- If already installed, configures Amazon CloudWatch agent based on OS flavor.
- After receiving confirmation that Amazon CloudWatch agents have been installed and configured on all Amazon EC2 instances, the AWS Lambda function will then provision Amazon CloudWatch alarms, including composite CloudWatch alarms, for each Amazon EC2 instance.
- After monitoring and logging control mechanisms are set up, EC2 instances send their logs to CloudWatch. These mechanisms should be put in place in order to be alerted of events and incidents.
- Because the Amazon CloudWatch agents are installed on each EC2 instance, the additional system-level metrics can be collected from the instances. These additional metrics are categorized into namespaces like application, system, and security. This is part of the configuration files (for Linux and Windows) uploaded in Systems Manager, so alarms are created for these metrics.
Deploying the solution
We have provided the AWS CloudFormation template that deploys this solution in your AWS account. Ensure that you deploy this template in the Region where your Amazon EC2 instances reside. The template assumes that you have the EC2 instances running in your account and it requires inputs such as email address for the SNS topic in the target AWS Region. Hence, you can deploy this template individually for each of your AWS account.
Deployment steps:
- Ensure that all the prerequisites previously mentioned are met.
- Launch the AWS CloudFormation template.
- In the AWS CloudFormation console, select the following Launch Stack button that launches the template in the US east (N. Virginia) Region in your account.

- Selecting the “Launch Stack” button opens the following console:

Figure: Create CloudFormation Stack
- Click Next, and confirm stack details.

Figure: Specify details
- Click Next, and review the stack. Click on the acknowledgment for resource creation in the capabilities section.

Figure: Review CloudFormation Stack details

Figure: Acknowledge capabilities
- Please confirm that the template creation succeeded in the AWS CloudFormation console. Verify that the resources are provisioned from the template.

Figure: Confirm Stack Execution
- Resources section shows the provisioned resources by the AWS CloudFormation template.

Figure: Resources Provisioned
Resources
This section shows the provisioned resources by the AWS CloudFormation template. The AWS CloudFormation template creates all the required resources for setting up Lambda functions for creation and deletion of CloudWatch alarms.
- Two Lambda functions – one for creating CloudWatch alarms for EC2 instances and one for stopping CloudWatch alarms for EC2 instances.
- An IAM policy and role for the Lambda function. This role is being used by the Lambda functions to communicate to services such as Amazon SNS, Systems Manager.
- CloudWatch Events. These events get triggered anytime an EC2 instance gets created, to automatically trigger a Lambda function. The Lambda function either creates these alarms when EC2 instances are provisioned or cleans up the alarms based on that EC2 instance state.
- CloudWatch alarm for Lambda failures. This alarm is provisioned so that anytime the Lambda function fails to execute, this alarm sends notifications using Amazon SNS to administrators monitoring the status of Lambda execution.
- CloudWatch composite alarm. This MemCPU alarm is triggered when both CPU and memory of giving instance is higher than 90%.
- Systems Manager parameters for Linux and Windows operating systems. As CloudWatch agent setup is automated, we need a configuration file per OS as Systems Manager parameters, to be able to set up CloudWatch agent using Lambda functions. Using AWS CloudFormation to create these Systems Manager parameters validate that all required resources are provisioned as a part of single template for implementing this fully automated setup.
More details on Systems Manager parameters
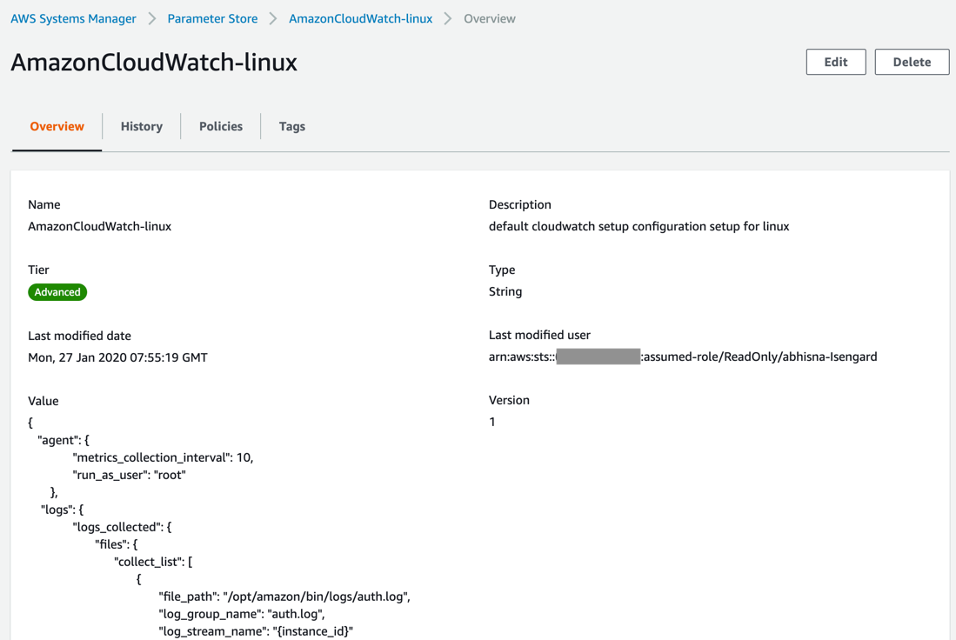
As previously mentioned, the AWS CloudFormation template creates the Systems Manager parameters for adding CloudWatch agent configuration file on the basis of OS. The CloudWatch agent configuration file is a JSON file with three sections called agent, metrics, and logs as follows.
The following screenshot shows one such example for Linux.

Figure: CloudWatch Linux Configuration
- Agent: This section includes overall configuration of the agent. If you use the wizard, it doesn’t create an agent section.
- Metrics: This section specifies the custom metrics for collection and publishing to CloudWatch. If you’re using the agent only to collect logs, you can omit the metrics section from the file.
- Logs: This section specifies what log files are published to CloudWatch Logs. This can include events from the Windows Event Log if the server runs Windows Server.
For more information about CloudWatch agent configuration, check the links as follows:
- Configuration file to be used with Linux for Amazon CloudWatch
- Configuration file to be used with Windows for Amazon CloudWatch
Similarly, for Windows create Systems Manager parameter with name “AmazonCloudWatch-windows” using the configuration files.
More details on event for triggering Lambda function
Find the following event setup required for the AWS Lambda function in case the Lambda functions are triggered from the AWS Management Console.
The Lambda function created by the template performs the following:
- creates the SNS topic,
- installs and configures CloudWatch agents on the EC2 instances,
- and then creates the alarms for the EC2 instances
This Lambda function takes the following event in JSON format –
{ "detail": { "instance-id": "<instance-id>", "sns-topic": "<sns-topic-name>" } }More details on Composite Alarms
Customers often encounter alarm fatigue during an operational event as multiple alarms go off in quick succession and generate individual alerts but the event is often defined by the combination of multiple alerts occurring at the same time. CloudWatch recently released composite alarms to solve the problem of alarm fatigue.
Composite alarms are alarms that determine their alarm state by watching the alarm states of other alarms. Using composite alarms help you reduce alarm noise. If you set up a composite alarm to notify you of state changes, but set up the underlying metric alarms to not send notifications themselves, you are notified only when the alarm state of the composite alarm changes. For example, you could create metric alarms based on both CPU utilization and disk read operations, and specify for these alarms to never take actions. You could then create a composite alarm that goes into ALARM state and notifies you only when both of those metric alarms are in ALARM state.
Find the details of the composite alarm MemCPU the AWS CloudFormation template deployed:
MemCPU alarm is triggered when both CPU and memory of given instance is higher than 90%

Figure: MemCPU Composite Alarm
The timeline view shows the state change for the composite alarm. This view showcases the times when the state was “In Alarm” in the historical period selectable by pre-defined time ranges.

Figure: Timeline of Composite Alarm
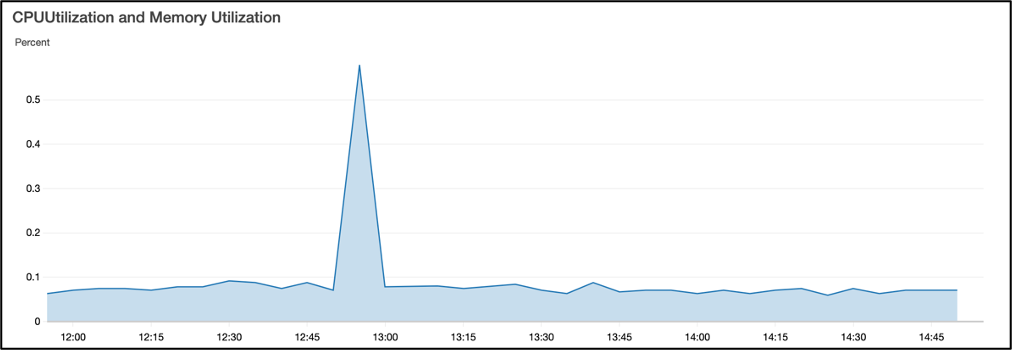
The graph metric visualization feature of CloudWatch enables you to view metrics in form of graphs and optionally create dashboards out of them to keep a track of changes.

Figure: CloudWatch Visualization of the Alarm
Clean up the deployment
Deleting the CloudFormation stack cleans up all the deployed resources.
Summary
In this blog, we presented a solution for automating the setup and configuration of Amazon CloudWatch alarms for Amazon EC2 instances in an AWS account. We reduced the alarm fatigue using composite alarms and improve your MTTD (mean-time-to-detection). The solution demonstrated uses AWS Systems Manager to automatically install and configure CloudWatch agents on EC2 instances. The Lambda function created a composite alarm for memory and CPU utilization. The solution is deployed using AWS CloudFormation template. For more details, check out how to create composite CloudWatch alarms.