AWS Cloud Operations Blog
Integrate Amazon CloudWatch metrics with ServiceNow using Amazon Managed Grafana
ServiceNow ITSM is a cloud-based platform designed to improve IT services, increase user satisfaction, and boost IT flexibility and agility. With ServiceNow IT Service Management, you can consolidate your legacy on-premise systems and IT tools into our single data model to transform the service experience, automate workflows, gain real-time visibility, and improve IT productivity.
Amazon Managed Grafana is a fully managed and secure data visualization service that lets customers complete their own observability picture, reaching across logs, metrics, traces, and other applications with enterprise data sources that are available out of the box. Amazon Managed Grafana leverages the open source Grafana project, a widely deployed data visualization tool that is popular for its extensible data source support. Jointly developed with Grafana Labs, Amazon Managed Grafana helps our customers achieve success with their operations observability strategy. Moreover, Amazon Managed Grafana is a fully-managed service that manages the service provisioning, setup, upgrades, scaling, and maintenance of Grafana. This is done by eliminating the need for customers to have additional management overhead.
This post describes how Amazon Managed Grafana helps customers visualize their existing Amazon CloudWatch metrics in a single pane of glass and then generates an alert that creates an IT Incident in their ServiceNow based ITSM platform. You generate the alert and create the IT incident in ServiceNow using ServiceNow Scripted Rest API’s, Amazon Simple Notification Service (SNS), and AWS Lambda.
Architecture Overview
The following architecture diagram depicts your AWS application being monitored via Amazon CloudWatch while Amazon Managed Grafana provides dashboarding and alerting and the IT incident is generated in ServiceNow using SNS and Lambda.

Prerequisites
- AWS Command Line Interface (CLI) 2
- A ServiceNow instance for your cloud operations team to create incidents for them. For this post, we have provisioned a ServiceNow Developer instance. Access the developer ServiceNow instance from the ServiceNow Developer link.
- Amazon Grafana workspace. For information, and steps for creating the Amazon Managed Grafana workspace, see Creating a Workspace.
- For user authentication and authorization, Amazon Managed Grafana can integrate with identity providers (IdPs) that support SAML 2.0 and also can integrate with AWS Single Sign-On. For more information, review the Amazon Managed Grafana supports direct SAML integration with identity providers
- To use AWS data source configuration, first use the Amazon Managed Grafana console to enable service-managed Identity and Access Management(IAM) roles that grant the workspace with IAM policies necessary to read CloudWatch resources in your account or in your entire organizational unit. Then, use the Amazon Managed Grafana workspace console to add CloudWatch as a data source. See Use AWS data source configuration to add CloudWatch as a data source.
- An SNS Topic
Use the following command to create an SNS topic named grafana-ITSM-notification, and subscribe an email address.
You should see the following output:
For more information about the creating an SNS Topic, refer to create an SNS topic with a unique name.
- AWS Lambda Execution Role
Create an IAM execution role that gives your function permission to access AWS resources. To create an execution role with the AWS CLI, use the create-role command.
You should see the output with the IAM role ARN: arn:aws:iam:: 123456789012:role/service-role/ServiceNowIncident-role-lambda-ex
For more information about creating a Lambda Execution role, refer to AWS Lambda execution role.
Once we have all of the prerequisites in place, follow the following set of instructions for our solution.
Configuring CloudWatch Datasource: Under Data sources, configure the CloudWatch plugin to start querying and visualizing the metrics from the AWS environment. Choose Data sources as ‘CloudWatch’ to add a data source.

While configuring the Amazon CloudWatch data source, select to import the out of the box dashboards for Amazon Elastic Compute Cloud (EC2), Amazon EBS, AWS Lambda, Amazon Cloudwatch Logs, and Amazon Relational Database Service (RDS). For this post, we will configure the Amazon EC2 dashboard.

Go to your dashboard where you can see all of your Amazon CloudWatch metrics, and the logs in Amazon EC2 single pane of glass.

Configure notification channels on Amazon Managed Grafana
In this section, you’ll configure a notification channel to send out an alert. In our example, since the integration is through Amazon SNS, we will create a notification channel type as SNS.
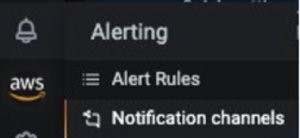
In the left pane, choose the bell icon to add a new notification channel.
Now, configure the ServiceNow-SNS-Integration notification channel. On the Edit notification channel, for Type, choose AWS SNS. For Topic, use the ARN of the SNS topic that you just created. For Auth Provider, choose the workspace IAM role.
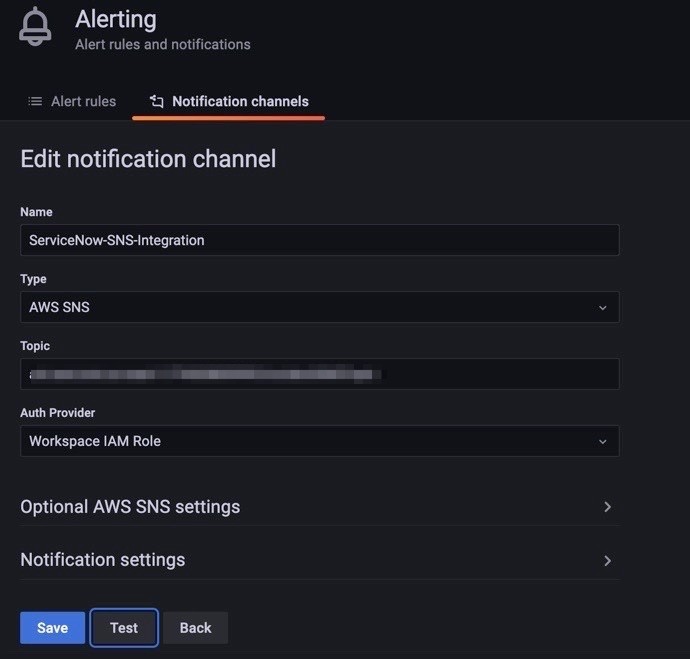
You have now set up the SNS notification channel successfully.
Configure the alert on your dashboard for defined threshold for High CPU Utilization
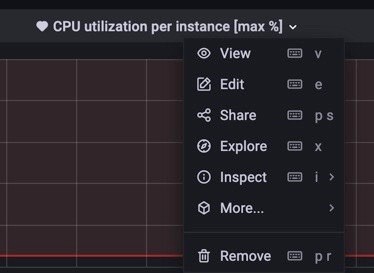
On the dashboard, select CPU utilization per Instance, and select Edit. When the utilization exceeds a threshold, configure Amazon Managed Grafana to send notifications and configure ServiceNow to create an incident for your cloud operations team.
Select the alert tab, define your threshold as 80%, and describe your Notification Message.

Save your dashboard, and you are done with configuring the Alert notification on AWS Managed Grafana.
Creating a Scripted REST API in ServiceNow:
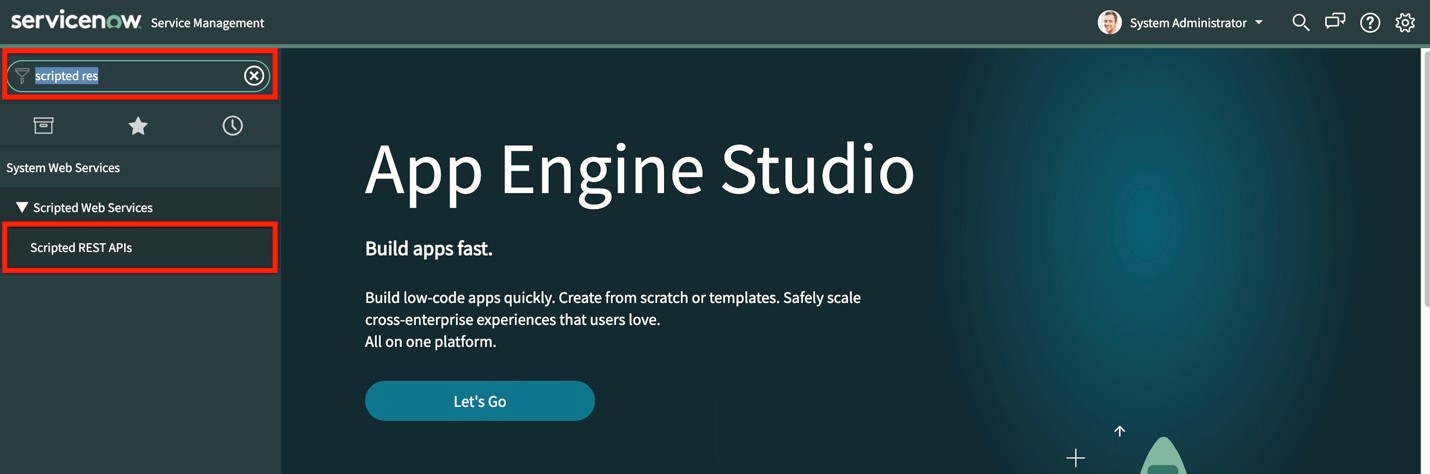
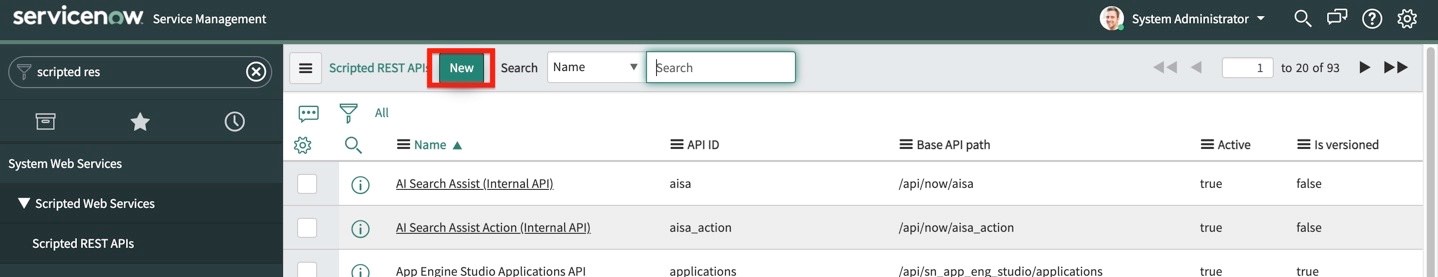
- First, log in to your ServiceNow account. On the left-hand side search box, type “Scripted REST”. Select Scripted REST APIs under System Web Services -> Scripted Web Services:
- Select New to create a new API service.
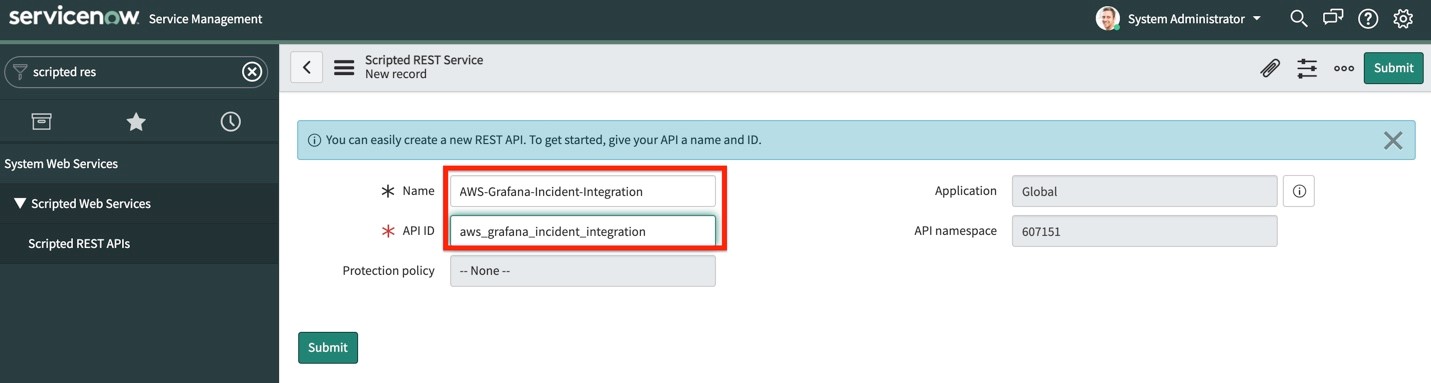
- Give your API a name, and an API ID (we’ll use “AWS-Grafana-Incident-Integration” for our example). You can leave Protection Policy as “– None –“. Then, select Submit:
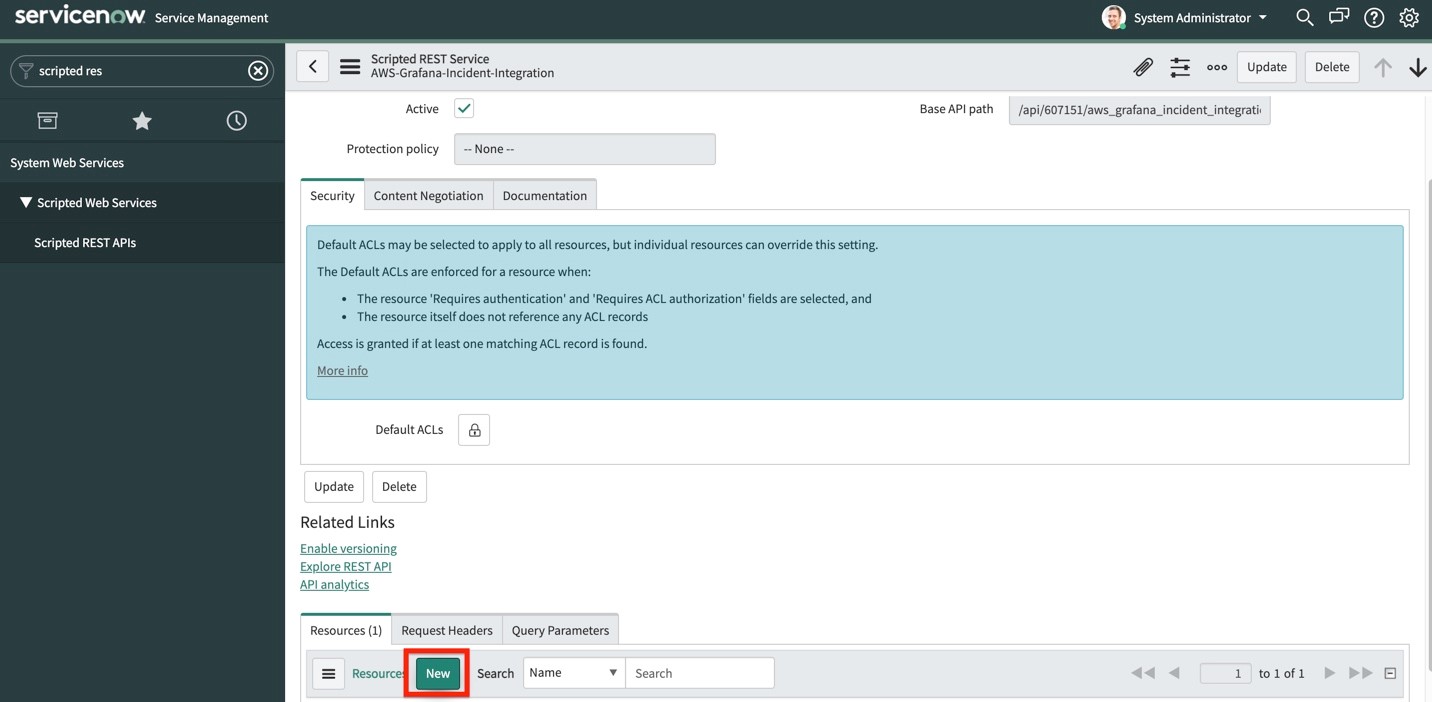
- Search for the API that we just created, and select it. Scroll down to the Resources tab, and select New.
- Give your resource a name (we’ll use “event”), and change the HTTP method to POST:

- Scroll down to the Script section, and use the following code snippet to capture the request from the AWS Lambda function:
- In the Security tab, uncheck the Requires authentication checkbox.
- Back on our Scripted API page, look for the Base API Path field for our newly created API.
- Our API endpoint is of this format:
https://.service-now.com/>?
Integrating ServiceNow Scripted API URL with AWS Lambda to receive Incidents creation request on the threshold notification
Create Lambda
For instructions on creating a Lambda function, see Getting Started with AWS Lambda. For more information, see Using AWS Lambda with Amazon SNS.
Before we create the lambda function, we must create a deployment package. Your Lambda function code must include logic to transform your SNS topic’s notification messages for the type of webhook endpoint that you’re using. For examples, see the following Python code snippets for ServiceNow Scripted API webhooks. The code is compatible with the Python 3.6 runtime. Replace https://outlook.office.com/webhook/xxxxxxx with the ServiceNow Scripted API URL created in the last step.
Copy the following snippet, and save it in your root folder as lambda_function.py
To deploy the new code to your function, upload the my-function .zip file deployment package. Use the Lambda console to upload a .zip file to the function, or use Deploy .zip file archives.
The following example uploads a file named my-function.zip. Use the fileb:// file prefix to upload the binary .zip file to Lambda.
The following create-function creates a Lambda function named my-function. Note that creating lambda execution roles is covered in the prerequisites section.
For more information on creating a Lambda function through AWS CLI, see create function.
Enable SNS to invoke your Lambda function
As a next step, add a permission that enables the SNS Topic (created in the prerequisites) to invoke your Lambda function
This will return the permission statement that’s added to the function policy.
For more information, see Lambda add permissions.
With your function subscribed to your SNS topic, messages published to the topic are forwarded to the function, and then to your ServiceNow ScriptedAPI webhook URL.
Test your Lambda function with an SNS notification
Type Hello World into a text file, and save it as message.txt. Then, run the following command:
This will return a message ID with a unique identifier, indicating that the message has been accepted by the Amazon SNS service. Then, Amazon SNS will attempt to deliver it to the topic’s subscribers.
For more information on using AWS Lambda with Amazon Simple Notification Service, look here.
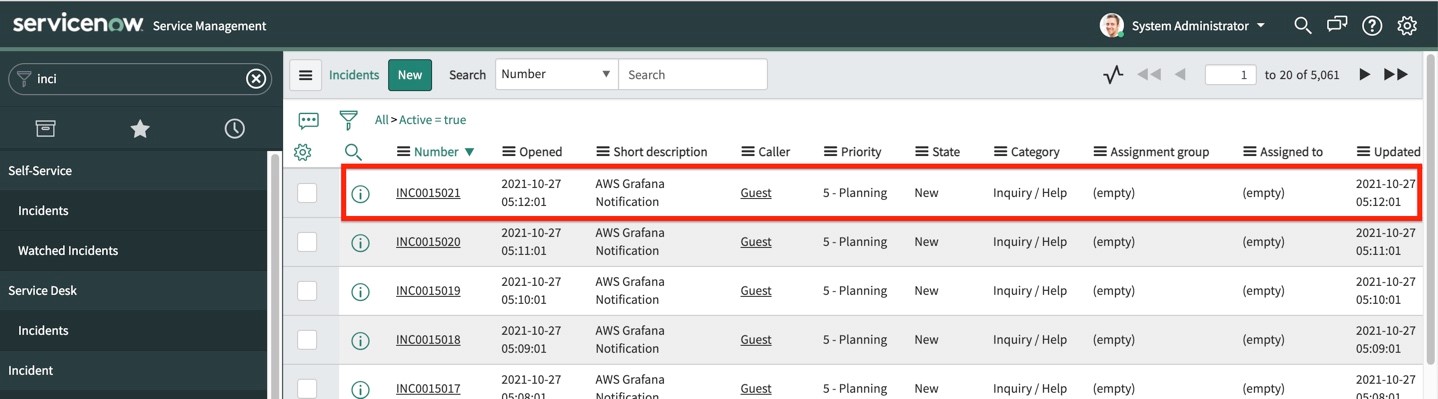
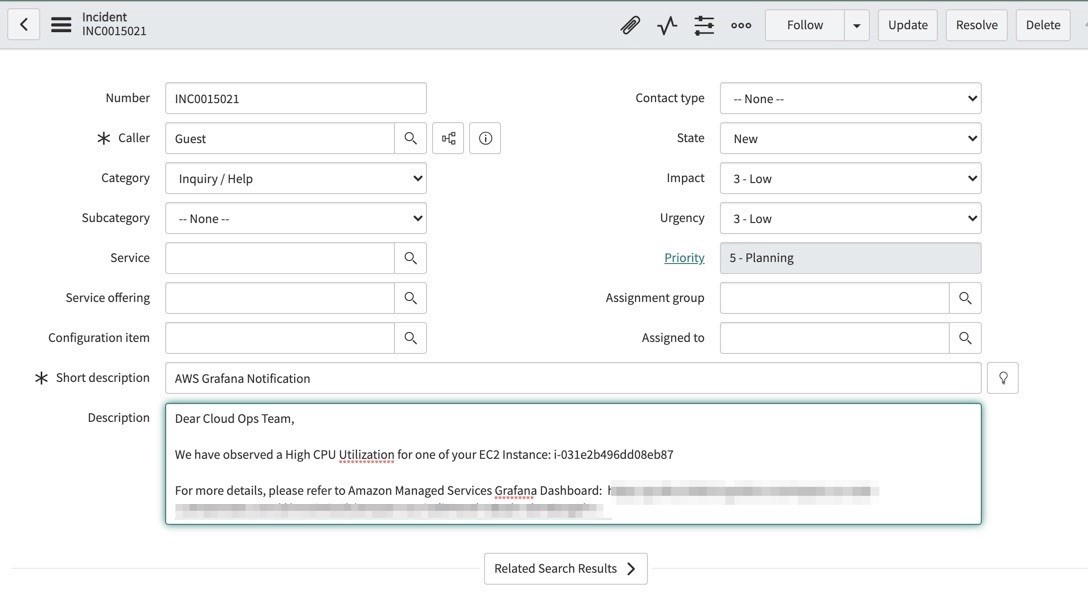
You can now test those alerts triggered by Amazon Managed Grafana are visible in ServiceNow as Incidents.
- In ServiceNow, on the left-hand side search box, type “Incidents”.
- Under the Service Desk section, select Incidents.

You should see a new incident created on the top of the list.
Cleaning up
To avoid incurring future charges, delete the resources that you have created by following these steps:
- Delete SNS Topic
- Delete Lambda Function
- Delete Lambda Execution IAM role
- Delete Amazon Managed Grafana workspace
- Release ServiceNow Personal Developer Instance
Conclusion
In this post, we explored the ease of integrating of ServiceNow with Amazon Managed Grafana for creating incidents.by showing you how to deploy an Amazon Managed Grafana workspace, configure notification channels, collect metrics from AWS CloudWatch, configure alerts on the Amazon Managed Grafana dashboard, and send out alerts to ServiceNow for incident creation using ServiceNow Scripted REST API as webhooks. We demonstrated an integration pattern using Amazon Managed Grafana and Amazon CloudWatch that enables you to automatically create incidents in ServiceNow for operational efficiency.
Further reading
- Amazon Managed Grafana preview updated with new capabilities
- Monitoring hybrid environments using Amazon Managed Grafana
- How do I use webhooks to publish Amazon SNS messages to Amazon Chime, Slack, or Microsoft Teams?