AWS Public Sector Blog
How eduroam empowers its community through real-time analytics with Amazon Quick Sight
How does eduroam, a global federated network—one that authenticated over 9.2 billion sessions in 2025 across more than 100 countries—stay healthy, responsive, and sustainable? It relies on its community and the frequent, data-rich, and collaborative communication among its participating institutions.
For the more than 2,800 administrators across approximately 1,200 participating institutions in the US, that means access to near daily provided to them through Amazon Quick Sight on Amazon Web Services (AWS) by the eduroam team at Internet2. However, this wasn’t always the case. This post walks through how the eduroam team modernized their data reporting pipeline, the architecture behind it, and the impact it’s had on institutional engagement.
The challenge of static reports in a dynamic world
eduroam (education roaming) is the secure, worldwide roaming access service developed for the international research and education community. eduroam lets students, researchers, and staff from participating institutions automatically connect to secure Wi-Fi at any participating institution worldwide—no guest accounts, captive portals, or insecure password-based networks.
Internet2, the organization overseeing the US eduroam network, captures daily data from about six million authentications per day. Since 2022, Internet2 has been sending to each participating institution a monthly summary PDF with information about eduroam usage at their institution, including number of successful authenticated sessions per day, unsuccessful attempts, and local and worldwide eduroam sites visited. In addition, each institution received 6-month and annual summaries of usage.
These static PDFs left much to be desired. They didn’t let institutions explore their own usage. Limitations in the visualization tools sometimes produced unreadable graphics. The data covered only a single usage period, with no historical context. Administrators couldn’t compare year-over-year usage, which meant they couldn’t plan to support events that might require increased investment in technology or communication to their user community (such as hosting an international conference or event drawing participants from multiple institutions). Internet2 sent these reports out monthly, not providing timely insight. These summary reports weren’t detailed enough to let administrators identify problems with their infrastructure and troubleshoot in real time.
eduroam is decentralized by design. The service runs better when local administrators actively improve their infrastructure, but with static reports, administrators lacked the visibility to do so effectively.
Democratizing access to shared data
Internet2 sits at the center of millions of eduroam transactions, and they capture data that is of shared interest to the eduroam community. Both Internet2 and eduroam participating organizations benefit from understanding the data. A broader infrastructure modernization prompted the team to ask: “If we’re scaling eduroam for millions more users, shouldn’t we also rethink how eduroam communicates value to its community?”
Sara Jeanes, director of eduroam and certificate services at Internet2, wanted to facilitate community participation and engagement with the eduroam data, not gatekeep information. Sara knew the community needed real-time, self-service access to their own data. Community members needed the ability to explore their own data dynamically and explore their own usage during different time windows (for example, compare our flagship alumni event last year to the same event this year or plan for spikes during a rivalry football game). She also knew that they wanted context for how they’re performing relative to their peers while preserving privacy—the ability to see their own data without exposing others’ data.
A federated analytics platform on Amazon Web Services
Internet2 evaluated several analytics platforms for one that met their needs for security, capabilities, licensing, and scale. During their evaluations, they realized that row-level security was a critical capability. It would let each of the 2,800 eduroam administrators sign in to the solution and see only their institution’s data, which is critical for a trust-based federation.
Internet2 selected Amazon Quick Sight as its business intelligence (BI) layer. This was a natural choice because Internet2 was already running eduroam infrastructure on AWS, which meant the team could streamline data ingestion, storage, and visualization within a single cloud environment.
The architecture works as follows. Each night, AWS Glue ingests two data sources: institution metadata from Federation Manager (including hotspot locations) and national eduroam login logs captured at second-level granularity. An AWS Glue extract, transform, and load (ETL) job aggregates those raw logs into daily totals, while an AWS Glue crawler infers schema and registers the datasets in the AWS Glue Data Catalog. The processed data lands in Amazon Redshift Serverless, which serves as the central data store holding both aggregated traffic and row-level security (RLS) rules. Amazon Quick Sight then reads from Amazon Redshift Serverless in direct query mode, so dashboards consistently reflect the latest data without requiring a separate extract.
On the identity side, Internet2’s IAM system provisions eduroam administrators into AWS IAM Identity Center, which acts as the identity provider for single sign-on. Quick Sight authenticates users through IAM Identity Center and cross-references their identity with authorized institution mappings from Federation Manager using a built-in RLS rules dataset. The result is that each institution sees only its own window into the eduroam federation.
The system consists of the following components:
- eduroam source systems – Federation Manager provides institution metadata and service locations, national eduroam login logs record authentication events as users roam across participating institutions, and Internet2 IAM supplies the administrator identities who manage the federation
- Ingestion and ETL with AWS Glue – Ingests source data nightly, the AWS Glue crawler infers schema into the AWS Glue Data Catalog, and AWS Glue ETL jobs aggregate records on a secondary daily schedule.
- Data store – Amazon Redshift Serverless stores the aggregated traffic data alongside metadata and row-level security rules that map users to institutions.
- Analytics and BI – Amazon Quick Sight reads from Amazon Redshift Serverless in direct query mode with native row-level security enforced per institution.
- Per-institution dashboards – Each institution sees only its own window into the eduroam federation through dedicated dashboard views.
- Identity and access – Internet2 IAM provisions administrators into IAM Identity Center, and Amazon Quick Sight authenticates users through single sign-on.
- Monitoring and audit – Amazon CloudWatch captures metrics and logs, and AWS CloudTrail provides API-level audit trails across the pipeline.
The following diagram shows the solution architecture.
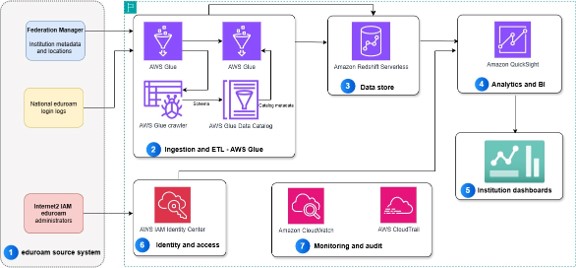
Figure 1: Internet2 eduroam analytics on AWS
Thomas Pratt, Internet2’s enterprise solutions architect, keeps the data in perspective. “We’re talking about a 400-million-row log table aggregated to a daily level,” he says. Although the number sounds large, Pratt notes the architecture handles it comfortably. What matters isn’t the volume but making it accessible to 2,800 administrators simultaneously.
The eduroam US analytics dashboards launched a pilot in November 2025 to eduroam Support Organizations (eSOs), then released to the entire US eduroam community in January 2026.
Active stewards
The eduroam analytics dashboards fuel institutional independence—administrators can make decisions without having to ask Internet2. Administrators can now dig into 4 years of data. They can compare events, track seasonal patterns, and identify issues their user community is experiencing in real time.
Mary Bull, eduroam’s technical service manager, noted that one K12 administrator discovered a counterintuitive pattern: summer usage was increasing. Digging into the data, they realized college students returning home were connecting to their local school district and library Wi-Fi, an insight they might never have seen in the static PDF reports.
Access to dynamic data has given greater insight to administrators at multiple scales. Before the availability of eduroam Quick Sight dashboards, team members counted log lines and used Microsoft Excel for statistical analysis. It was difficult to replicate the analysis, even for key troubleshooting metrics like the national average of the eduroam access request reject rate. Now Internet2 can compare the overall rate to identify institutions that need support. In the future, eduroam sites will be able to see how they stack up and can identify where they need help. This will help institutions be proactive and address sitewide errors without waiting for users to report problems. The Quick Sight platform provides a flexible portal where new analytic visuals can be added as Internet2 develops and releases them.
Institutions aren’t on their own. Internet2 uses the data to identify institutions that are struggling to complete the infrastructure configuration necessary to connect to the eduroam network. This information lets Sara and her team develop interventions tailored to the needs of specific institutions rather than sending out one-size-fits-all communications.
Community-driven philosophy
“We want to facilitate administrators to operate on their own and for us to not be the choke point.” Sara shared.
The new dashboards complement the 2026 State of the Network report. “This report is about building shared expectations across the eduroam community,” Sara explained. “This report is encouraging our community to discuss and incorporate data as it collectively establishes community best practices and norms. Now the community can define, ‘what good looks like’.”
What’s next
Amazon Quick Sight enables a platform that delivers flexible, secure data access and opens the door to future new visuals that let eduroam administrators troubleshoot and demonstrate the value of the service to their stakeholders.
The Quick Sight dashboards are only the beginning. K12 school districts, museums, and libraries across 11 states have added nearly 3,000 new deployments since 2019. With eduroam expanding rapidly beyond higher education, the Internet2 team is focused on making the analytics platform grow alongside the community it serves.
That means two things. First, meeting new community members where they are: the team is developing onboarding materials tailored to organizations that might be encountering eduroam analytics for the first time. Second, deepening the value for existing institutions by incorporating community feedback into the platform’s roadmap. Upcoming enhancements include combining eduroam data with National Center for Education Statistics (NCES) data to add demographic and institutional context, aggregated community views that let administrators benchmark against peers, and predictive insights that surface trends before they become problems. Imagine asking, “How does our eduroam usage compare to the rest of the Big Ten athletic conference?”
A stronger network through shared insight
eduroam was born from a shared need—researchers and students were increasingly mobile, and the community recognized that no single institution could solve connectivity alone. A federated approach, built on mutual trust, was the answer. Two decades later, that same collaborative DNA is driving a new chapter, one where shared data, not only shared infrastructure, strengthens the network. As Internet2 rolls out its first State of the Network report this summer, the US eduroam community is proving that when 1,200 institutions can see, understand, and act on the same data, the result is a healthier network and a model for how federated communities everywhere can scale trust through transparency.
Not yet using eduroam? Learn how to join the federation and give your community secure connectivity. Learn more about how Amazon Quick Sight enables secure, embedded analytics at scale, including row-level security for multi-tenant environments.