AWS Public Sector Blog
What does it cost to answer one question? Measuring per-request cost in agentic workloads
The cost dimensions of agentic workloads on Amazon Web Services (AWS) are invisible to many organizations beginning their agentic journey. It’s straightforward to track tokens consumed because this dimension translates directly to your bill. But most organizations can’t determine the cost per request or the cost to answer a single user question. Without understanding the cost to answer a single user question, organizations are blind to cost issues. In this post, I talk about how to gain visibility into your agentic costs, and I identify three things you can do to better control your costs.
Understanding workload costs begins with per-request observability. Tracking only monthly token totals makes it impossible to make the decisions necessary for good cost management. If you’re running agentic workloads on AWS, you need to understand the cost of each user request, the number of cycles each request took, and how input tokens grew throughout those cycles. After you understand per-request observability, then there are three things you can do to better control your AWS agentic costs:
- Think about model selection on a per-problem-solved basis not on a per-token basis.
- Limit the number of agentic cycles in your workload.
- Focus on tool design.
Unexpected ways your agentic costs increase
With a straightforward agentic workload, a user has a question, that question is sent to a model, and the model responds. The user’s question represents the number of tokens in, and the large language model (LLM) response represents the number of tokens out. You can easily calculate the price of that request.
However, the real world rarely follows the simple path. In many agentic workloads, a user has a question that is sent to a model, but the model can’t answer the question, so the model passes control back to the agent with a request to call a specific tool. The agent calls the tool, gets the results back, and returns the entire conversation history back to the model. In some cases, the LLM requests additional tool calls, and as each tool call is completed, the agent passes the entire conversation history back into the LLM until it can produce an answer for the user.
This means that as the number of tool calls increases, the size of the conversation history that is being sent to the LLM also increases. In cases where the agent requires three tool calls to answer a user’s question, your inference costs could be 5–10 times the cost of a single tool call. For example, say a user’s request is 100 tokens, the LLMs request to call a tool adds 50 tokens, and each tool call itself adds another 50 tokens. These three tool calls would add tokens as follows:
- The agent sends the user request to the LLM:
100 tokens
- The LLM requests tool use number one, which the agent passes back to the LLM:
100 original tokens + 50 tokens to call a tool + 50 tokens from tool result number one = 200 tokens
- The LLM requests tool use number two, which the agent passes back to the LLM:
200 existing tokens + 50 tokens to call a tool + 50 tokens from tool result number two = 300 tokens
- The LLM requests tool use number three, which the agent passes back to the LLM:
300 existing tokens + 50 tokens to call a tool + 50 tokens from tool result number three = 400 tokens
In this case, the input tokens across all four invocations of the LLM are:
100 + 200 + 300 + 400 = 1,000 input tokens
This is a tenfold increase of input tokens to the user’s original request.
You can’t improve what you don’t measure
As a best practice, you should regularly emit metrics from your agentic workload so you can better visualize the workload’s cost drivers. If you’re using Amazon CloudWatch, then the CloudWatch embedded metric format makes it straightforward to write out telemetry data to log files, which CloudWatch automatically turns into metrics that you can visualize and alarm on.
As an example, each time an agent requests that a tool be called as part of a user’s request, track the input and output tokens, model Id, and tool call number. This way, you can see how many tool calls are being performed and visualize the increase in input tokens as you fulfill a single user request. If you’ve built your agent using the Strands Agents SDK, then you can use its built-in mechanism for retrieving agent metrics.
Think about model selection on a per-problem-solved basis, not on a per-token basis
I built a simple Strands based agent that residents can use to find and qualify for social services, covering food assistance, housing, childcare, utilities, medical care, employment, and senior programs. By measuring the number of tool calls and total tokens required to fulfill each user’s request, I was able to identify several cost savings opportunities.
For example, I ran the workload with expected prompts using the Haiku 4.5 and Opus 4.8 models from Claude by Anthropic in Amazon Bedrock. Through this telemetry, I was able to determine that each user request cost about $0.006 with Haiku 4.5 and $0.14 with Opus 4.8, a cost that was 23 times greater for equivalent results, as illustrated in the following graphic.

Figure 1: Cost Comparison: Haiku 4.5 vs Opus 4.8 API Pricing
This means that if I’m expecting 1,000 requests per day, the workload with Opus 4.8 will cost about $4,200 a month ($0.14 per request x 1,000 requests x 30 days), whereas the same workload with Haiku 4.5 would cost about $180 a month. In my testing, both models produced equivalent results for this workload, meaning the 23x cost difference between the two models is wasted money.
Limit the number of agentic cycles in your workload
Remember that as the number of tool calls increases as part of a user request, the quantity of input tokens increases. This can result in a situation where a small number of users can drive the majority of the workload cost.
In the demo workload I built, I tracked the number of tool calls per request. I tracked p50 (the median) and p90 tool calls per request. In the following graph, you can see that most user requests require three or fewer tool calls. The p50 line stays at or below two tool calls, whereas the p90 line stays at three tool calls, indicating most requests complete within three cycles.
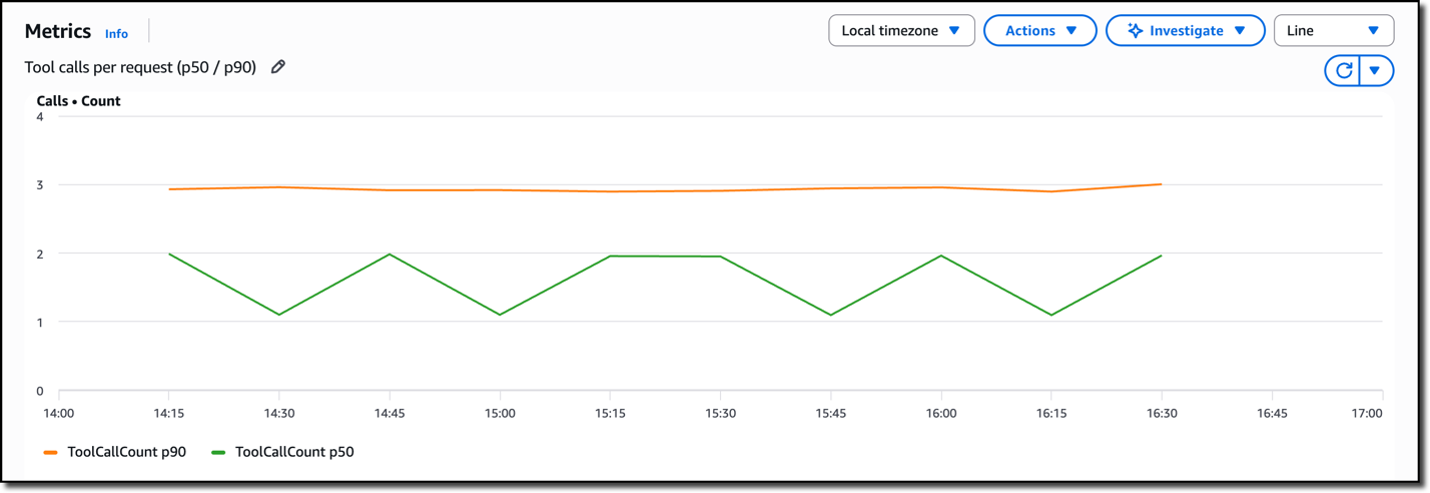
Figure 2: Tool Calls Per Request Over Time: P50 vs P90 Performance Metrics
When I graph the number of input tokens for each tool call, it’s apparent that there are some requests that make more than three tool calls. The following histogram shows the input token count for each tool call within a request. The later tool calls (calls number four and number five) consume significantly more input tokens than earlier ones, illustrating the compounding effect of resending conversation history.
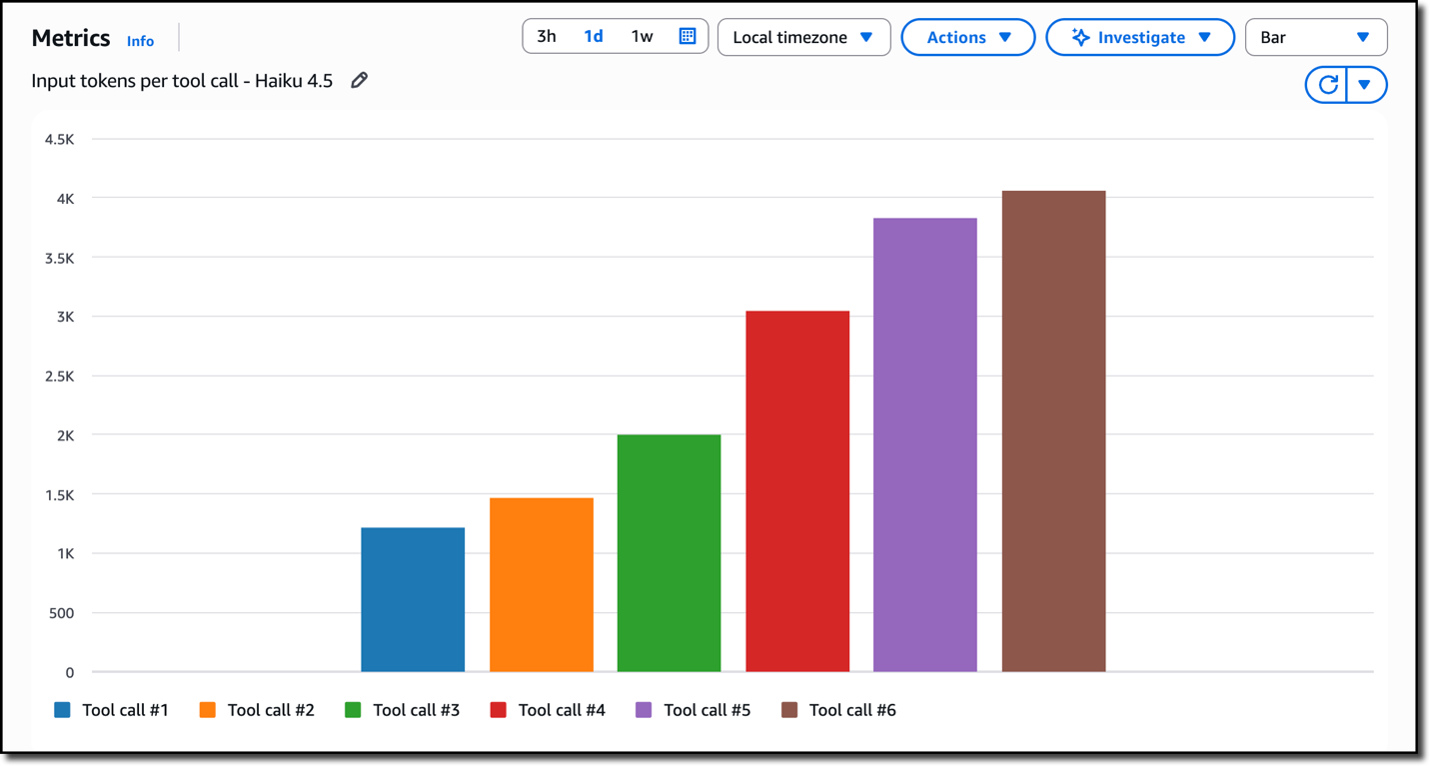
Figure 3: Input Token Usage Across Six Tool Calls in Haiku 4.5
Each progressive tool call adds more input tokens. Because over 90% of requests can be completed in three or fewer tool calls, consider limiting the number of tool calls the agent can make. The tradeoff here is that there might be some complex requests that get incomplete answers. Because each additional tool call resends the entire conversation back to the LLM, tool call number four (for example) costs more than tool calls number one and number two combined. In this case, limiting tool calls is a deliberate decision so a few complex requests don’t negatively impact the monthly agentic budget.
The Strands Agents SDK supports interventions, which you can use to enforce limits programmatically. For example, using interventions, you can stop agent execution after three tools calls and return a partial answer to the user.
Focus on tool design
Tool requests stay in the conversation history and get resent with each subsequent invocation. Because of this, verbose tool responses have a compounding effect on LLM costs. If a tool returns 200 tokens of data when only 50 tokens is needed to answer the question, then the workload is costing an additional 150 tokens. An extra 150 tokens per tool call across three tool calls means 450 wasted tokens per request. At 1,000 requests per day, that’s 13.5 million wasted tokens per month.
In my example, I have a search_programs tool that returns program names, descriptions, eligibility criteria, and contact information. But in practice, only program names and descriptions are ever used. By reducing the tool output to the minimum needed, you reduce the context that accumulates over repeated tool calls.
The other way to optimize tool design is to focus on consolidating tool chains. By enabling tracing in your agentic workload, you can follow tool chains to see if the same tools are called with each user request or if the same tool is called multiple times in the same user request. In cases where several tools are always called in order, consider creating a single tool that returns all the necessary data, instead of multiple tool calls with growing context. The tradeoff here is flexibility, in that the agent gets one tool that returns a larger payload in a single call instead of building up context across multiple tool calls. If you have a well-understood workload with predictable access patterns, it’s worth testing both approaches and comparing the per-request cost.
Conclusion
Agentic workloads cost more than standard inference because each reasoning cycle resends the full conversation history to the LLM. Without per-request observability, you can’t see this happening until the bill arrives. By tracking cost per request, you can make informed decisions about model selection, tool call limits, and tool design before it becomes a problem.
To get started, emit metrics for your agent (consider using the CloudWatch embedded metric format) so you can begin tracking input tokens, output tokens, and tool call count per request. Then run your agent against 20–30 representative prompts and record the per-request token count and number of tool calls for each request. This data will indicate your cost distribution, which will help you determine which of the cost controls in this post will have the greatest impact on your workload.
To learn more, explore the CloudWatch embedded metric format to instrument your existing agents. If you’re building a new agent, consider getting started with the Strands Agents SDK. Finally, use the instrumentation and review Amazon Bedrock pricing to estimate your own per-request costs.