AWS Storage Blog
Finding Amazon S3 cost savings with natural language using AWS Quick and S3 Tables
Most of us have a few buckets we’d rather not think about: one from a project that finished two years ago, another full of logs kept “just in case.” That data still costs money every month, often at the same rate as the data our applications use every day. Moving it to a lower-cost storage tier is a quick way to save, once you know how much data you’re dealing with and when anyone last opened it. Across thousands of buckets, those answers sit in different places, and combining them by hand is the kind of job teams keep putting off.
If you use Amazon S3, two features already provide this data. Amazon S3 Storage Lens reports storage bytes, object counts, and request metrics by storage class, down to the prefix level. You can use it to size a change and decide what to move first, which may be all you need if you manage storage by prefix. Server access logs record requests to your buckets, which gives you object-level detail on what’s being read, but not the storage bytes you need to judge impact. Together, they show both the size of the opportunity and the evidence behind it. Both datasets can now land in the same place. Storage Lens exports its metrics to Amazon S3 Tables, and server access logs reach S3 Tables through Amazon CloudWatch Logs. AWS Quick can query them together.
In this post, we show you how to bring these datasets together in S3 Tables and connect them to AWS Quick. You can then find the biggest savings, such as cold data to transition and storage to clean up, by asking questions in natural language instead of writing SQL.
Solution overview
The solution uses two AWS managed table buckets and the built-in Quick chat agent:
- S3 Storage Lens exports daily storage, activity, and bucket property metrics to the
aws-s3AWS managed table bucket. - Amazon S3 delivers server access logs to a CloudWatch Logs log group. CloudWatch mirrors the logs to the
amazon_s3__server_accesstable in theaws-cloudwatchtable bucket. - AWS Quick connects to each table bucket as a data source. You chat with your datasets in AWS Quick to ask questions and get insights from your data using natural language.
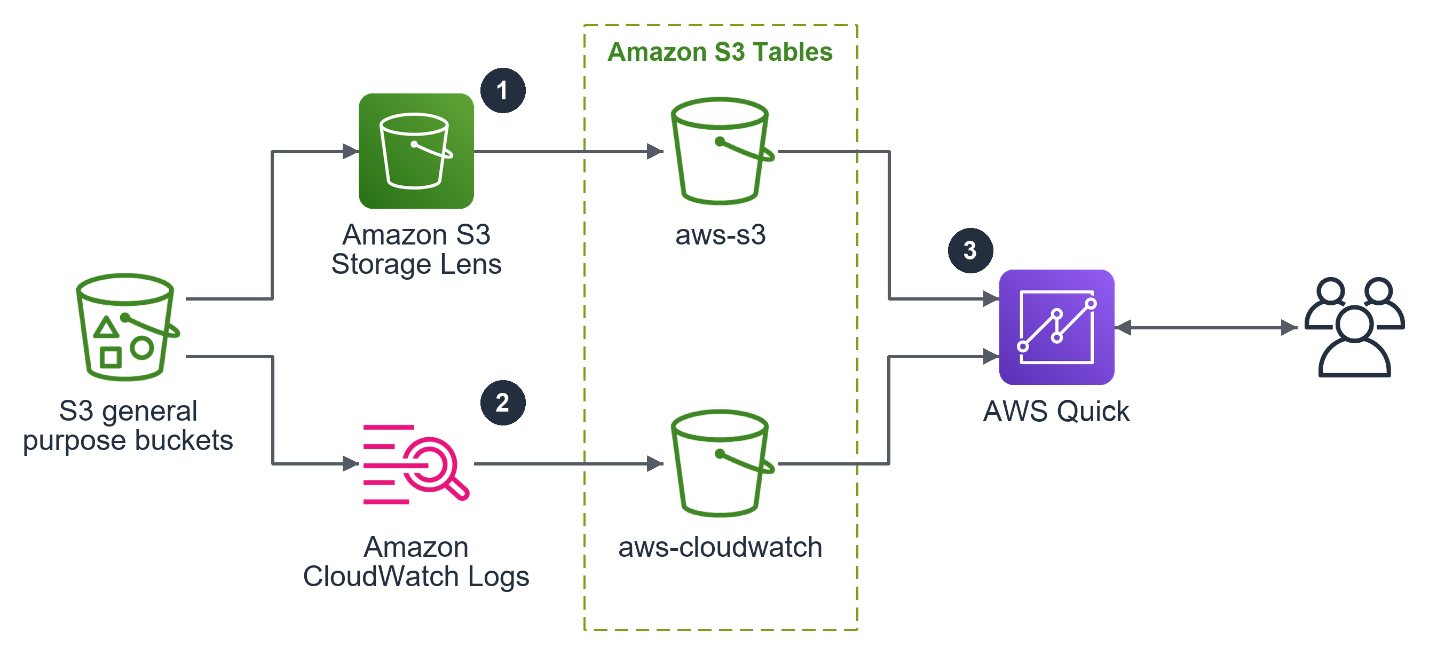
Figure 1: Architecture of the unified S3 observability layer
You grant Quick read access to the table buckets, so its findings are recommendations for bucket owners to review before changing any configuration.
Prerequisites
To follow this walkthrough, you need the following:
- One or more S3 general purpose buckets with an active workload.
- An AWS Quick Enterprise subscription, and access to Manage account in Quick or a Quick administrator who can complete Step 3 for you.
The first S3 Storage Lens export can take up to 48 hours, and server access logs record only requests made after you turn on delivery, so plan for 1–2 days between setup and your first questions. Some examples in this post use more than 3 months of data. For pricing, see Amazon S3 pricing, Amazon CloudWatch pricing, and AWS Quick pricing.
Walkthrough
The following four steps set up the two table buckets and connect them to AWS Quick.
Step 1: Export S3 Storage Lens metrics to S3 Tables
To export metrics to S3 Tables daily, complete the following steps:
- Open the Amazon S3 console. In the navigation pane, under Storage Lens, choose Dashboards.
- Choose Create dashboard, or select an existing dashboard and choose Edit.
- Enter a dashboard name, such as
cost-lens, and choose a home Region. Then select the Regions and buckets to include. - For Metrics selection, choose Advanced tier, and then select Activity metrics, Cost optimization metrics, Data protection metrics, and Performance metrics.
- Under Additional metrics aggregation, select Prefix aggregation.
- Under Metrics export, select Default metrics report and Expanded prefixes metrics report. For each report, under Bucket type, select Table bucket.
- Choose Create dashboard.
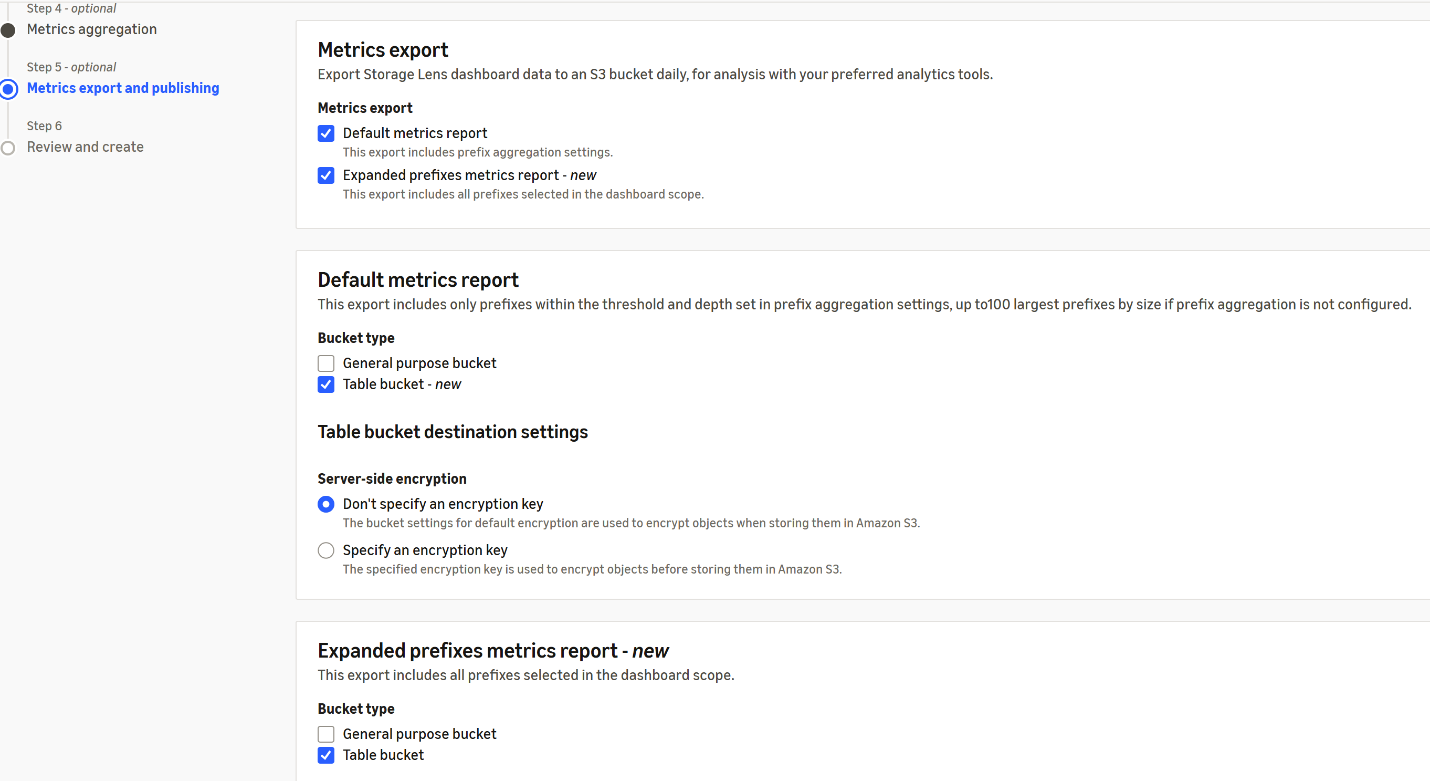
Figure 2: Configuring the S3 Storage Lens metrics export to S3 Tables
S3 Storage Lens creates tables in the aws-s3 table bucket, in a namespace named after your configuration (for example, lens_cost-lens_exp). For details, see Table naming for S3 Storage Lens export to S3 Tables.
Step 2: Deliver server access logs to CloudWatch Logs and S3 Tables
Ingestion cost grows with request volume, so start with your highest-spend buckets. For each bucket to analyze, complete the following steps:
- In the Amazon S3 console, open the bucket and choose the Properties tab.
- Under Log delivery to CloudWatch, add a delivery to Amazon CloudWatch Logs.
- In the Add delivery to Amazon CloudWatch Logs dialog, for Log type, keep S3_SERVER_ACCESS_LOGS. For Destination log group, keep the suggested
/aws/vendedlogs/log group, which is created automatically. - Select Enable S3 Tables Integration.
- Under Service access, keep Auto-create a new role with default permissions, and then choose Add.
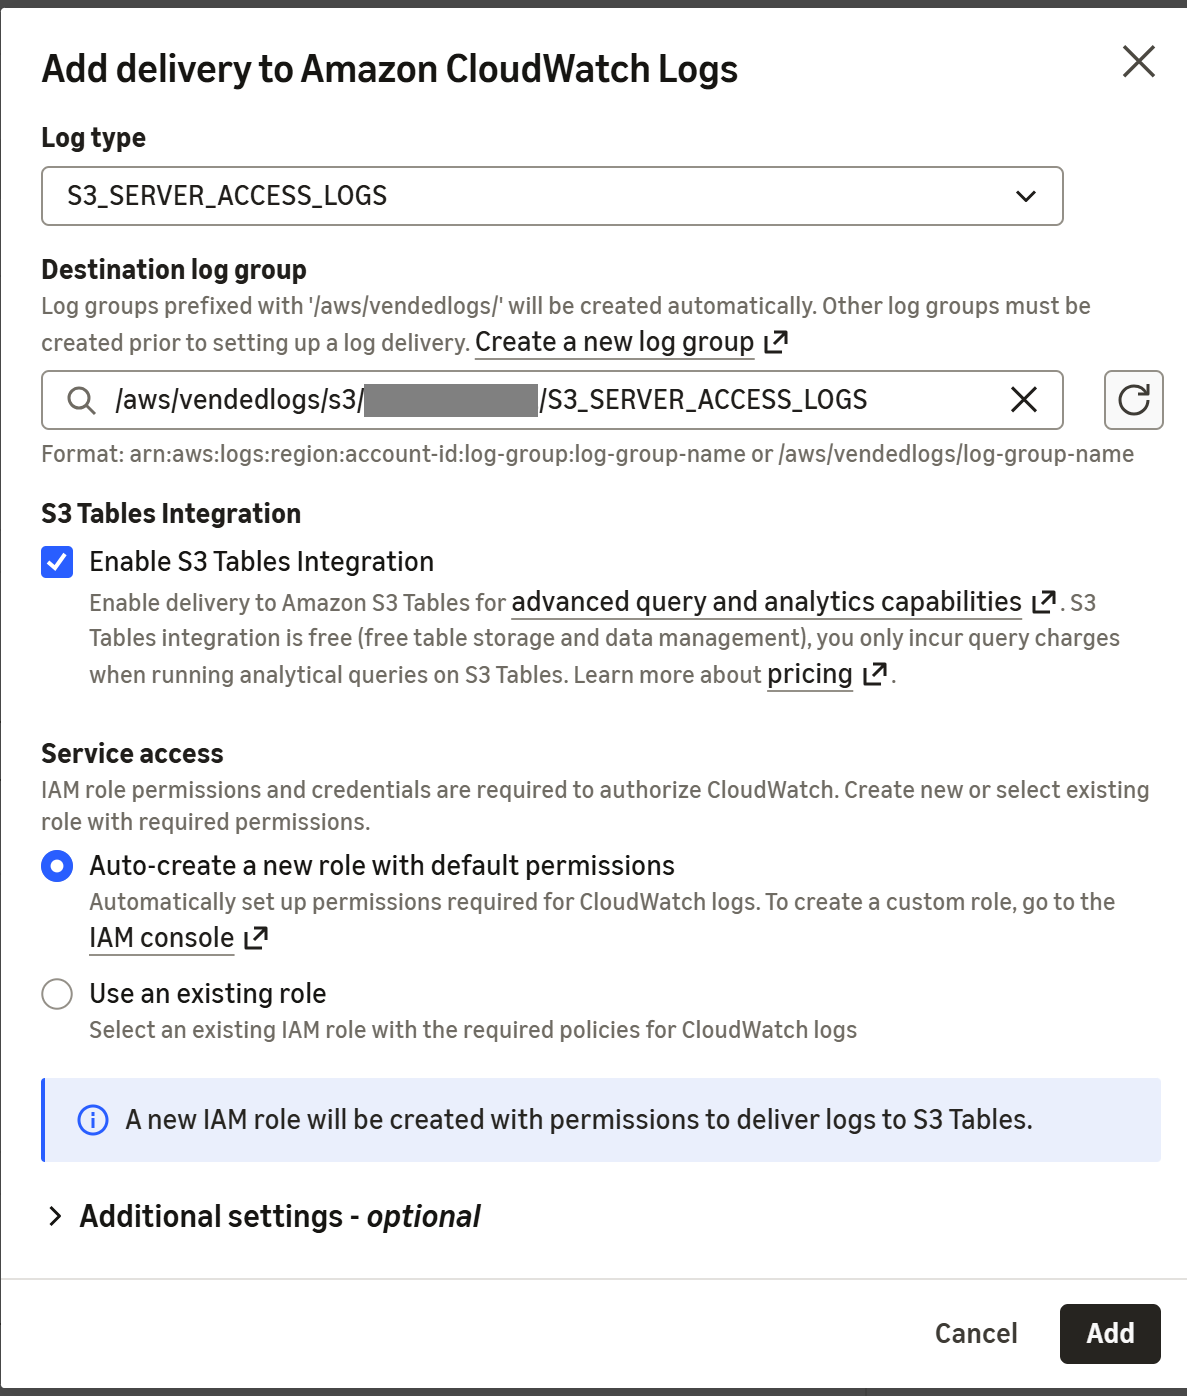
Figure 3: Delivering server access logs to CloudWatch Logs and S3 Tables
With the S3 Tables integration turned on, CloudWatch Logs delivers your server access logs to the aws-cloudwatch managed table bucket. You pay only for CloudWatch Logs ingestion and for query requests at S3 Tables pricing. Log records typically arrive within a few hours. For setup details, see Query Amazon S3 access logs instantly with CloudWatch and S3 Tables.
Step 3: Connect the table buckets to AWS Quick
To give Quick access to both table buckets:
- In the Amazon S3 console, choose Table buckets. If the integration with AWS analytics services isn’t turned on in your Region, choose Enable integration.
- In AWS Quick, from the profile menu, choose Manage account (Figure 4), and then choose AWS resources.
- Select Amazon S3 Tables, select the
aws-s3andaws-cloudwatchtable buckets, and then choose Save.
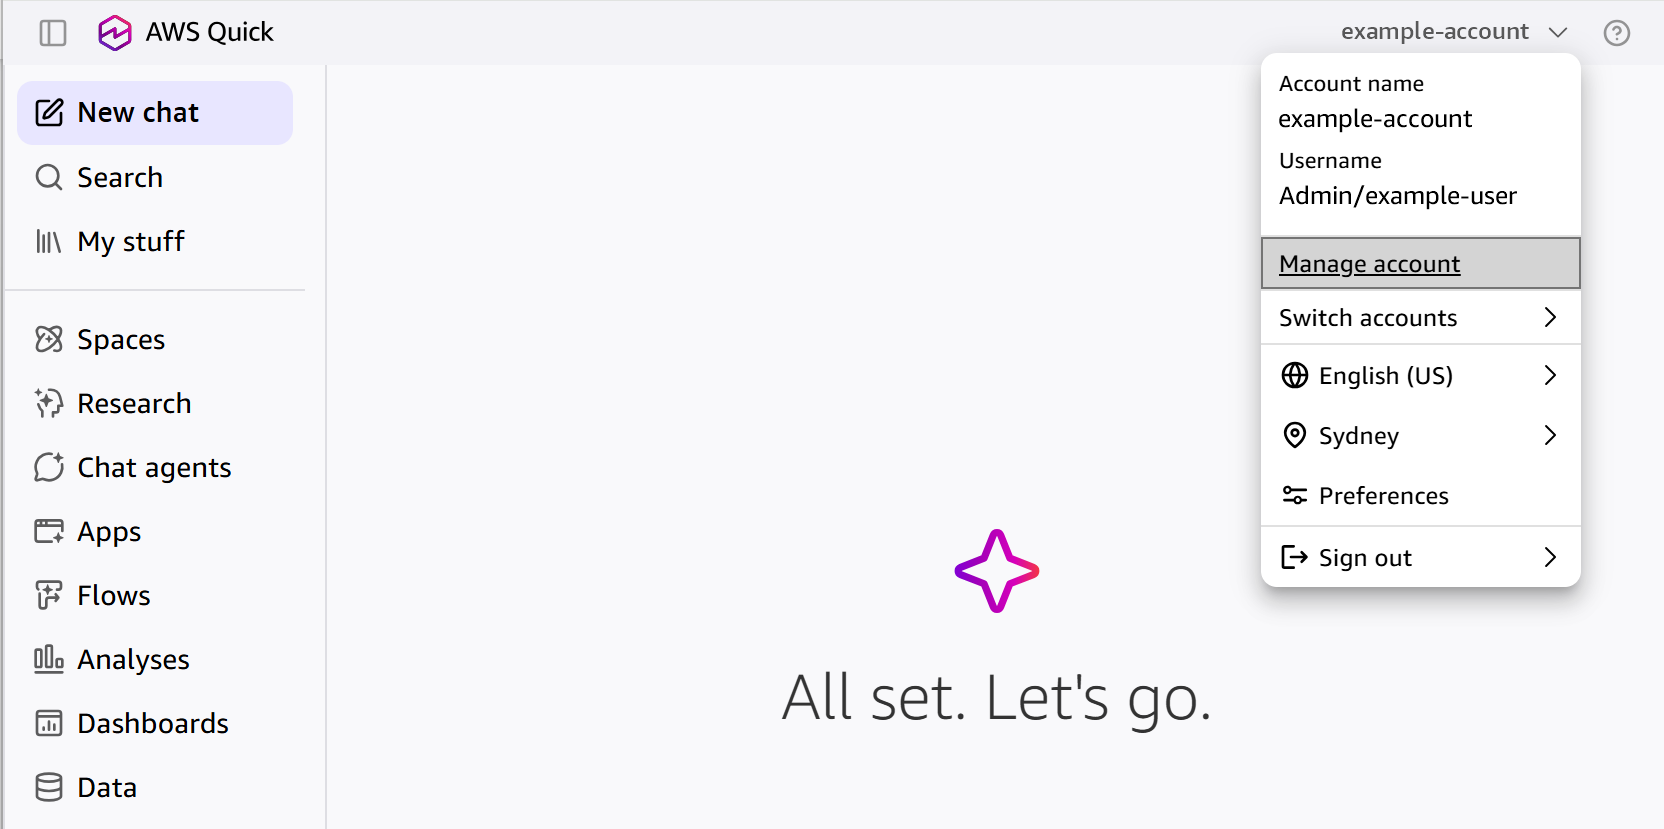
Figure 4: Opening Manage account in AWS Quick
Step 4: Create datasets
Create a data source for each table bucket and a dataset for each table:
- In AWS Quick, choose Data, choose the Data sources tab, and then choose Create data source.
- Choose Amazon S3 Tables (Apache Iceberg tables). Enter a name and the table bucket Amazon Resource Name (ARN), such as
arn:aws:s3tables:us-east-1:111122223333:bucket/aws-s3, and then choose Create data source. Repeat for theaws-cloudwatchtable bucket. - From each data source, choose Create dataset, and then select a namespace and table. Create datasets for the S3 Storage Lens tables (
default_storage_metrics,default_activity_metrics,expanded_prefixes_storage_metrics,expanded_prefixes_activity_metrics, andbucket_property_metrics) and theamazon_s3__server_accesstable.
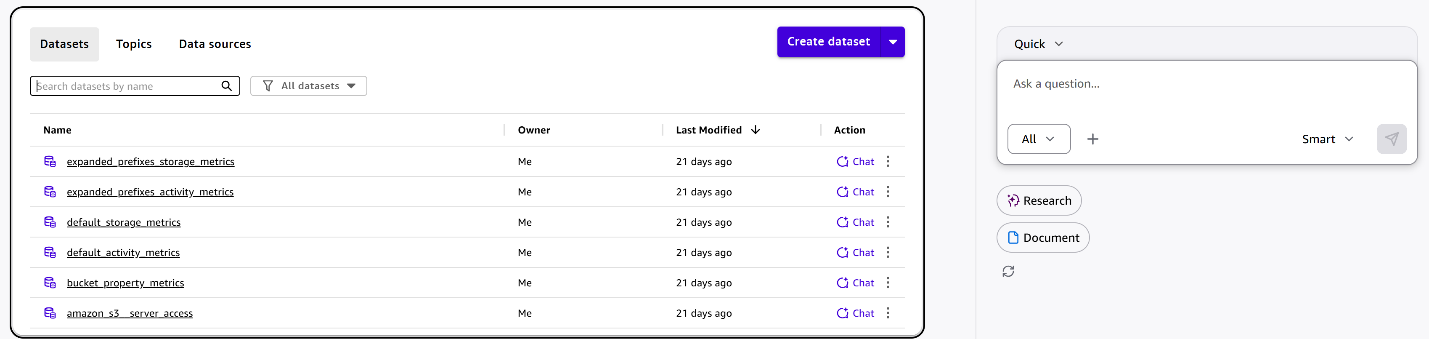
Figure 5: The six datasets and the chat panel in AWS Quick
To learn more about the setup, see Creating a dataset using Amazon S3 Tables.
Find cost savings with natural language questions
In the chat panel (Figure 5), you can ask cost questions across all your buckets. Include a time window, a threshold, and a scope (account, Region, or bucket). Follow-up questions keep the conversation context, so start broad and narrow down. The following scenarios cover cold data, storage waste from incomplete uploads and old versions, replication overhead, and request growth.
Note: AI-generated answers can contain errors. Before you act on a finding, check the Explanation for the SQL behind each number, or run your own query against the tables in Amazon Athena.
Find cold data without lifecycle rules
Start with a broad question:
Which buckets have more than 10 GB in S3 Standard, no lifecycle transition rule, and no GET requests to their largest prefixes in the last 90 days?
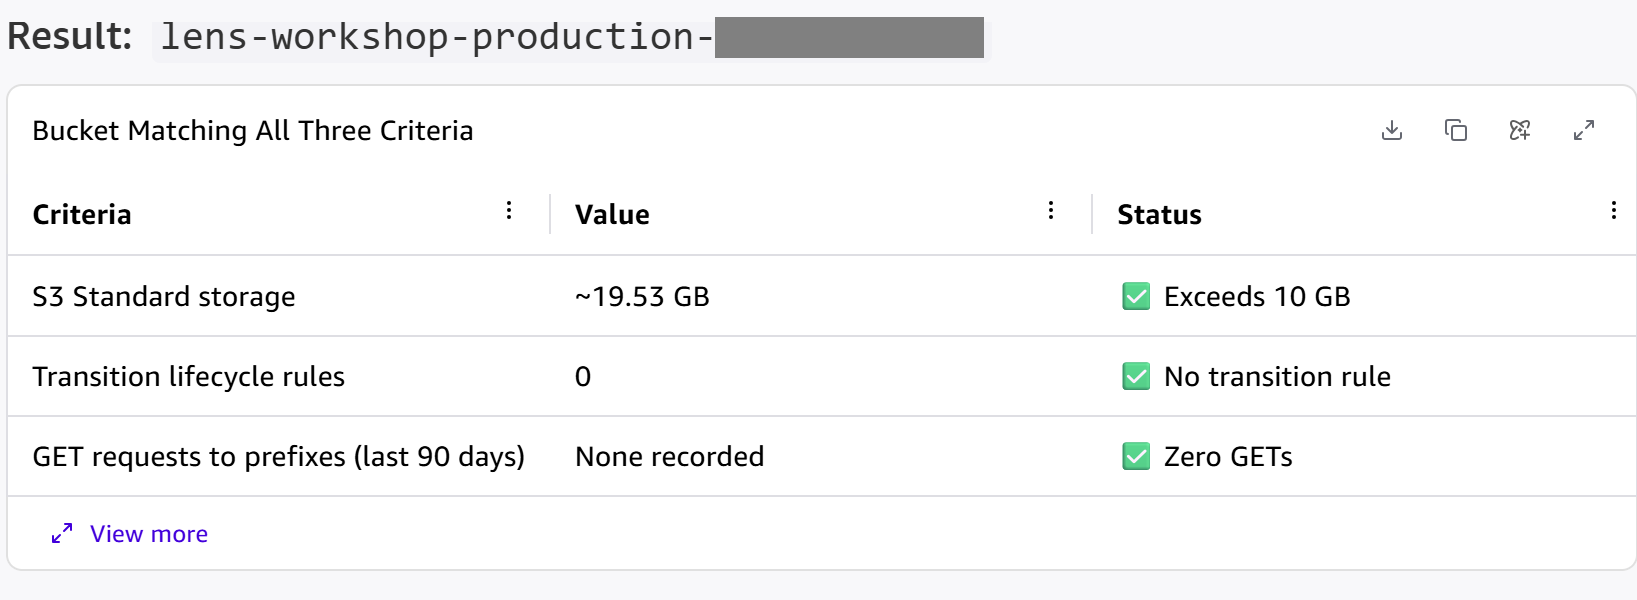
Figure 6: Example chat response for cold data candidates
The production bucket holds about 19.53 GB in S3 Standard with no read activity and no transition rule. It could be a good candidate for transitioning to a cheaper storage class to reduce costs.
Before you act, check object sizes. By default, S3 Lifecycle doesn’t transition objects smaller than 128 KB, since it’s not usually cost-effective. Ask a follow-up:
What percentage of objects are smaller than 128 KB?
All 2,000 objects in the production bucket are 8–16 MB, so the 128 KB minimum doesn’t apply.
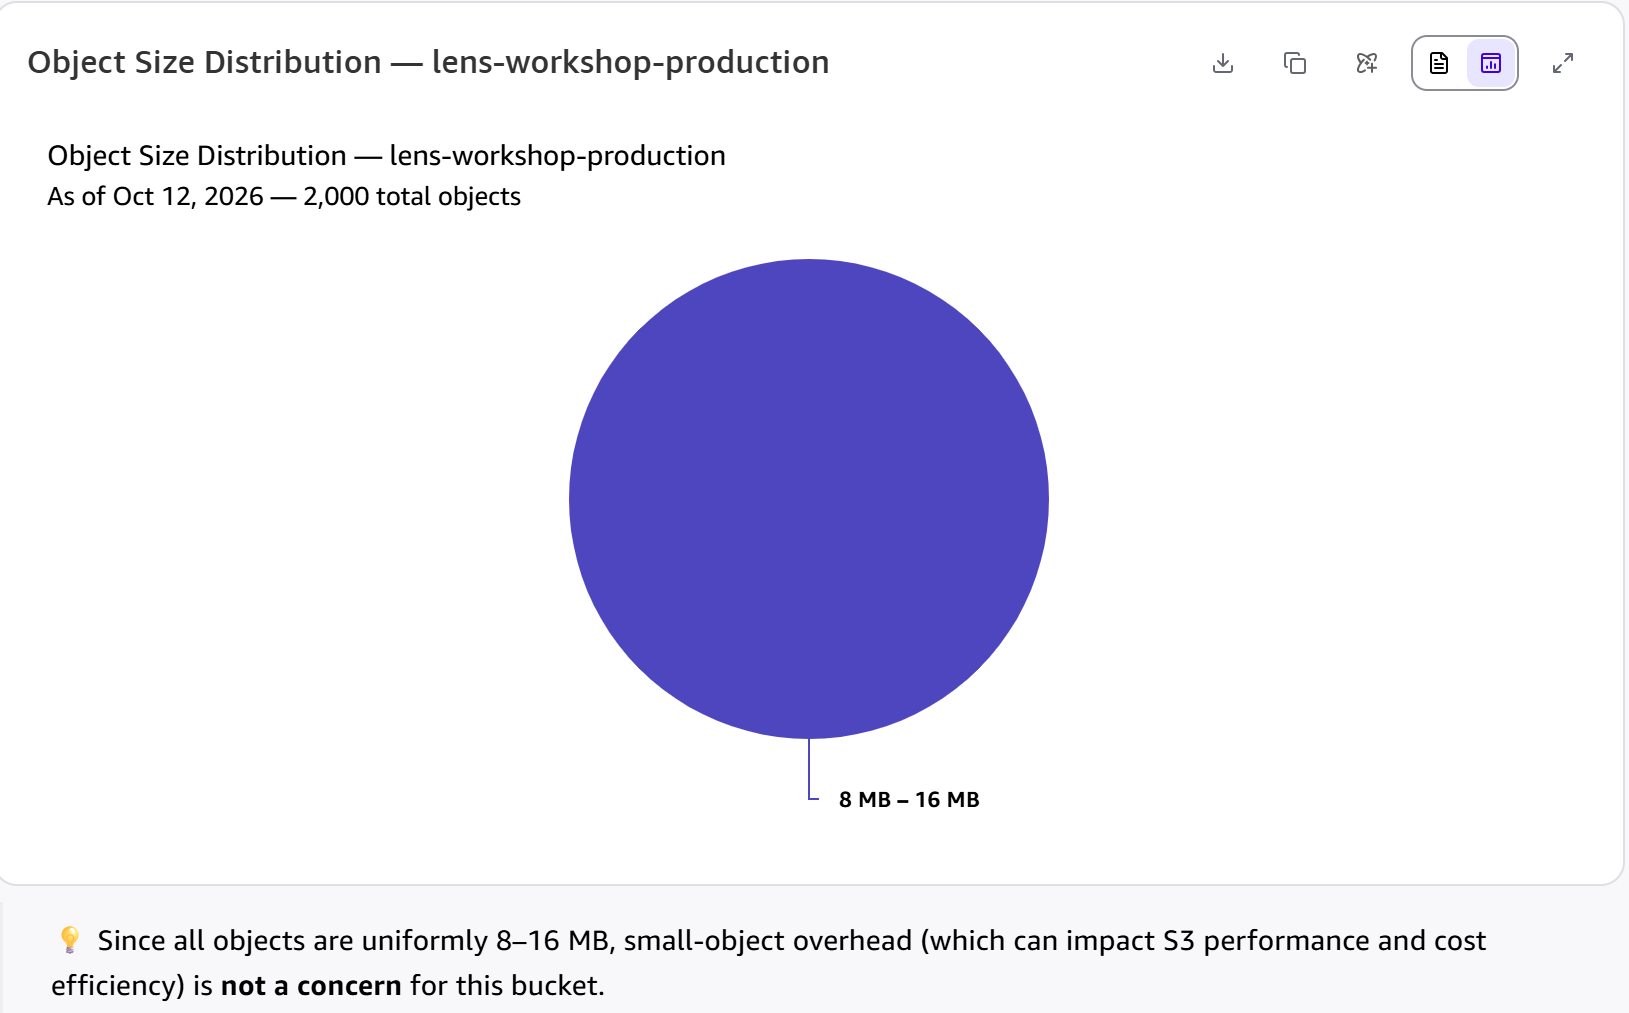
Figure 7: Example chat response for object size distribution
Prefixes with no reads are candidates for an S3 Lifecycle transition to S3 Standard-Infrequent Access (S3 Standard-IA) or Amazon S3 Glacier Instant Retrieval. If reads are light and unpredictable, S3 Intelligent-Tiering moves objects between tiers automatically with no retrieval charges.
Remove incomplete uploads and old versions
Incomplete multipart uploads are billed like any other storage but don’t appear when you list objects. Start by finding the buckets with the most:
List buckets with more than 1 GB of incomplete multipart uploads older than 7 days, and show whether each bucket has a lifecycle rule that aborts incomplete uploads.
The data lake bucket holds about 521.5 GiB of incomplete uploads older than 7 days with no rule to abort them. Three other buckets also lack this rule.
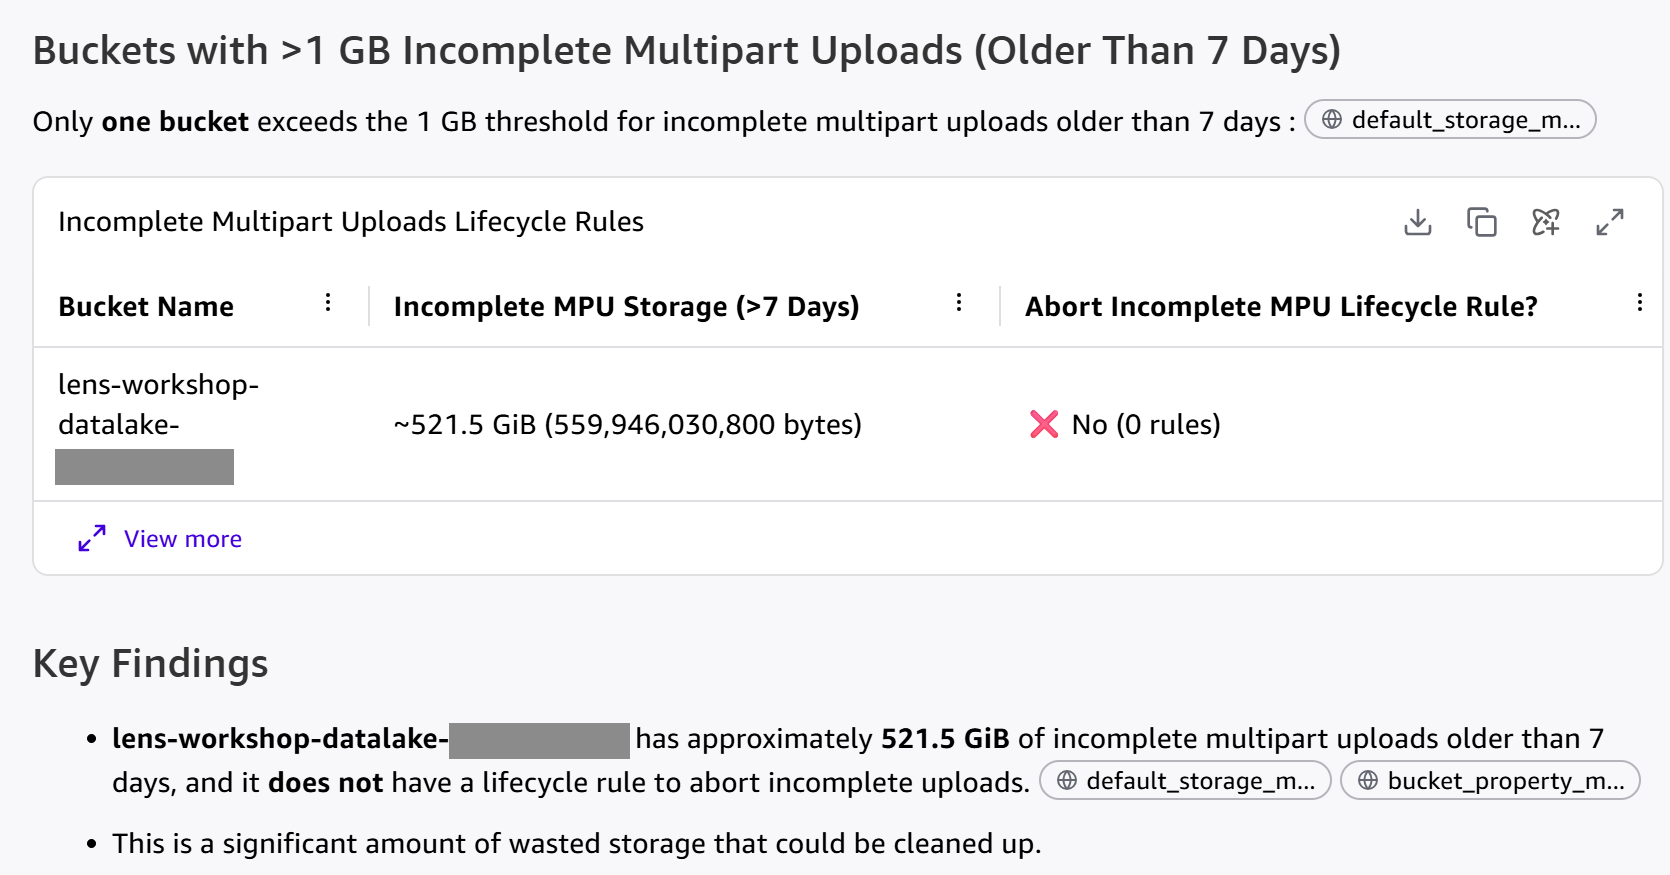
Figure 8: Example chat response for incomplete multipart uploads over 1 GB
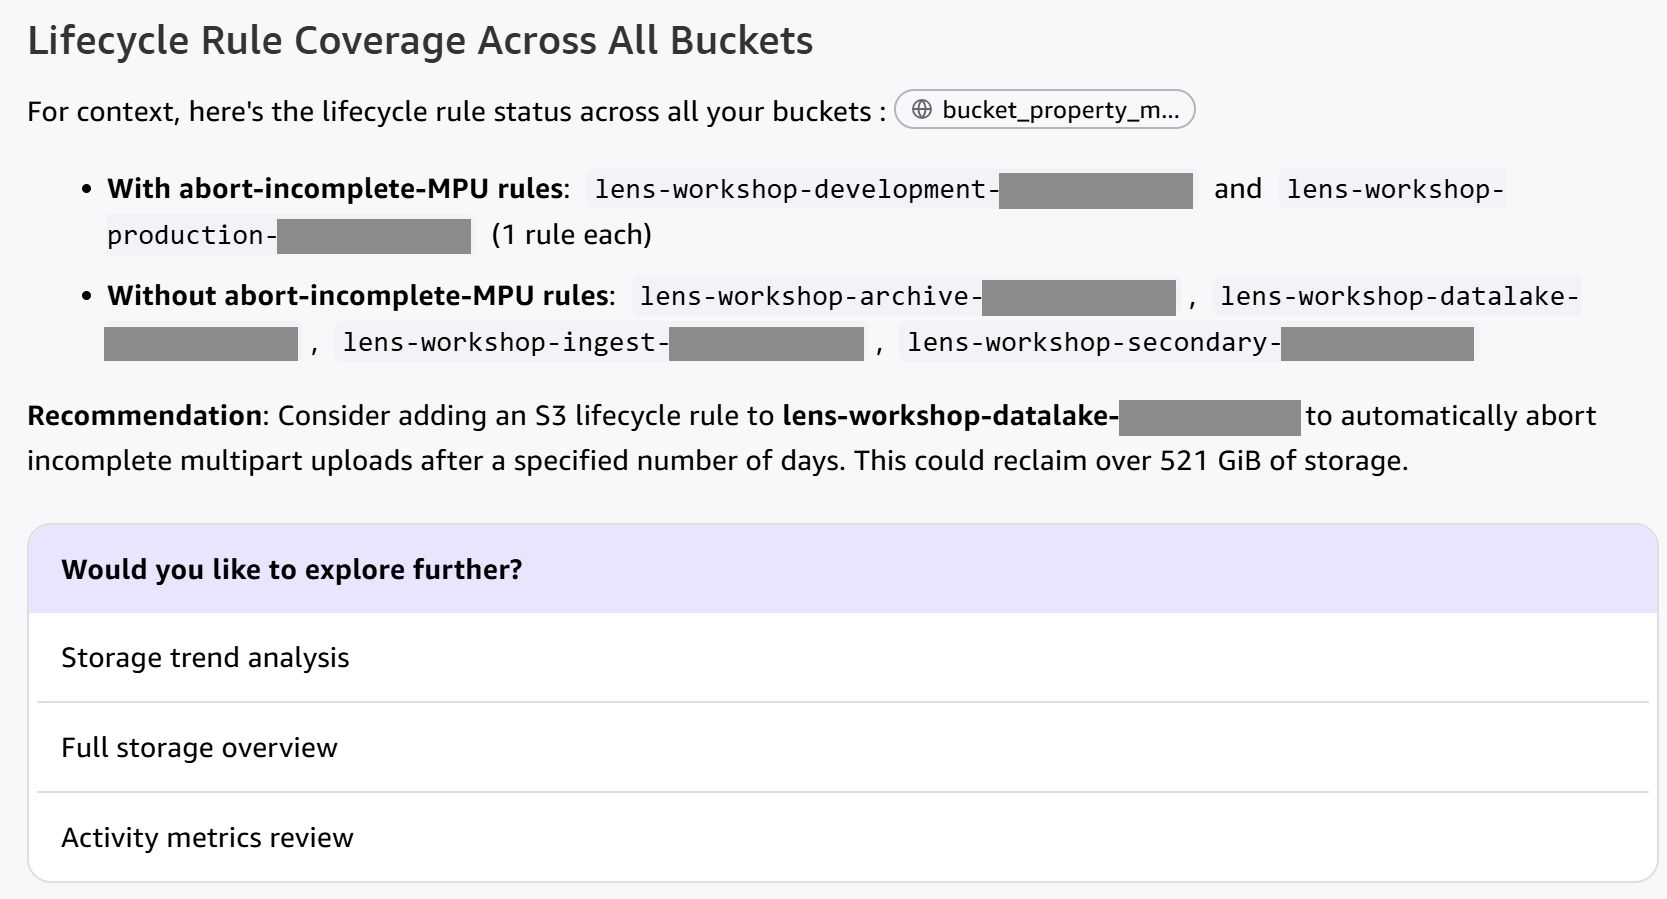
Figure 9: Lifecycle rule coverage for incomplete multipart uploads
Noncurrent object versions build up the same way in versioned buckets with no expiration rule. To find them, ask:
Which versioned buckets have more than 20 percent of their storage in noncurrent versions and no rule to expire noncurrent versions?
In the production bucket, 95 percent of storage is noncurrent.
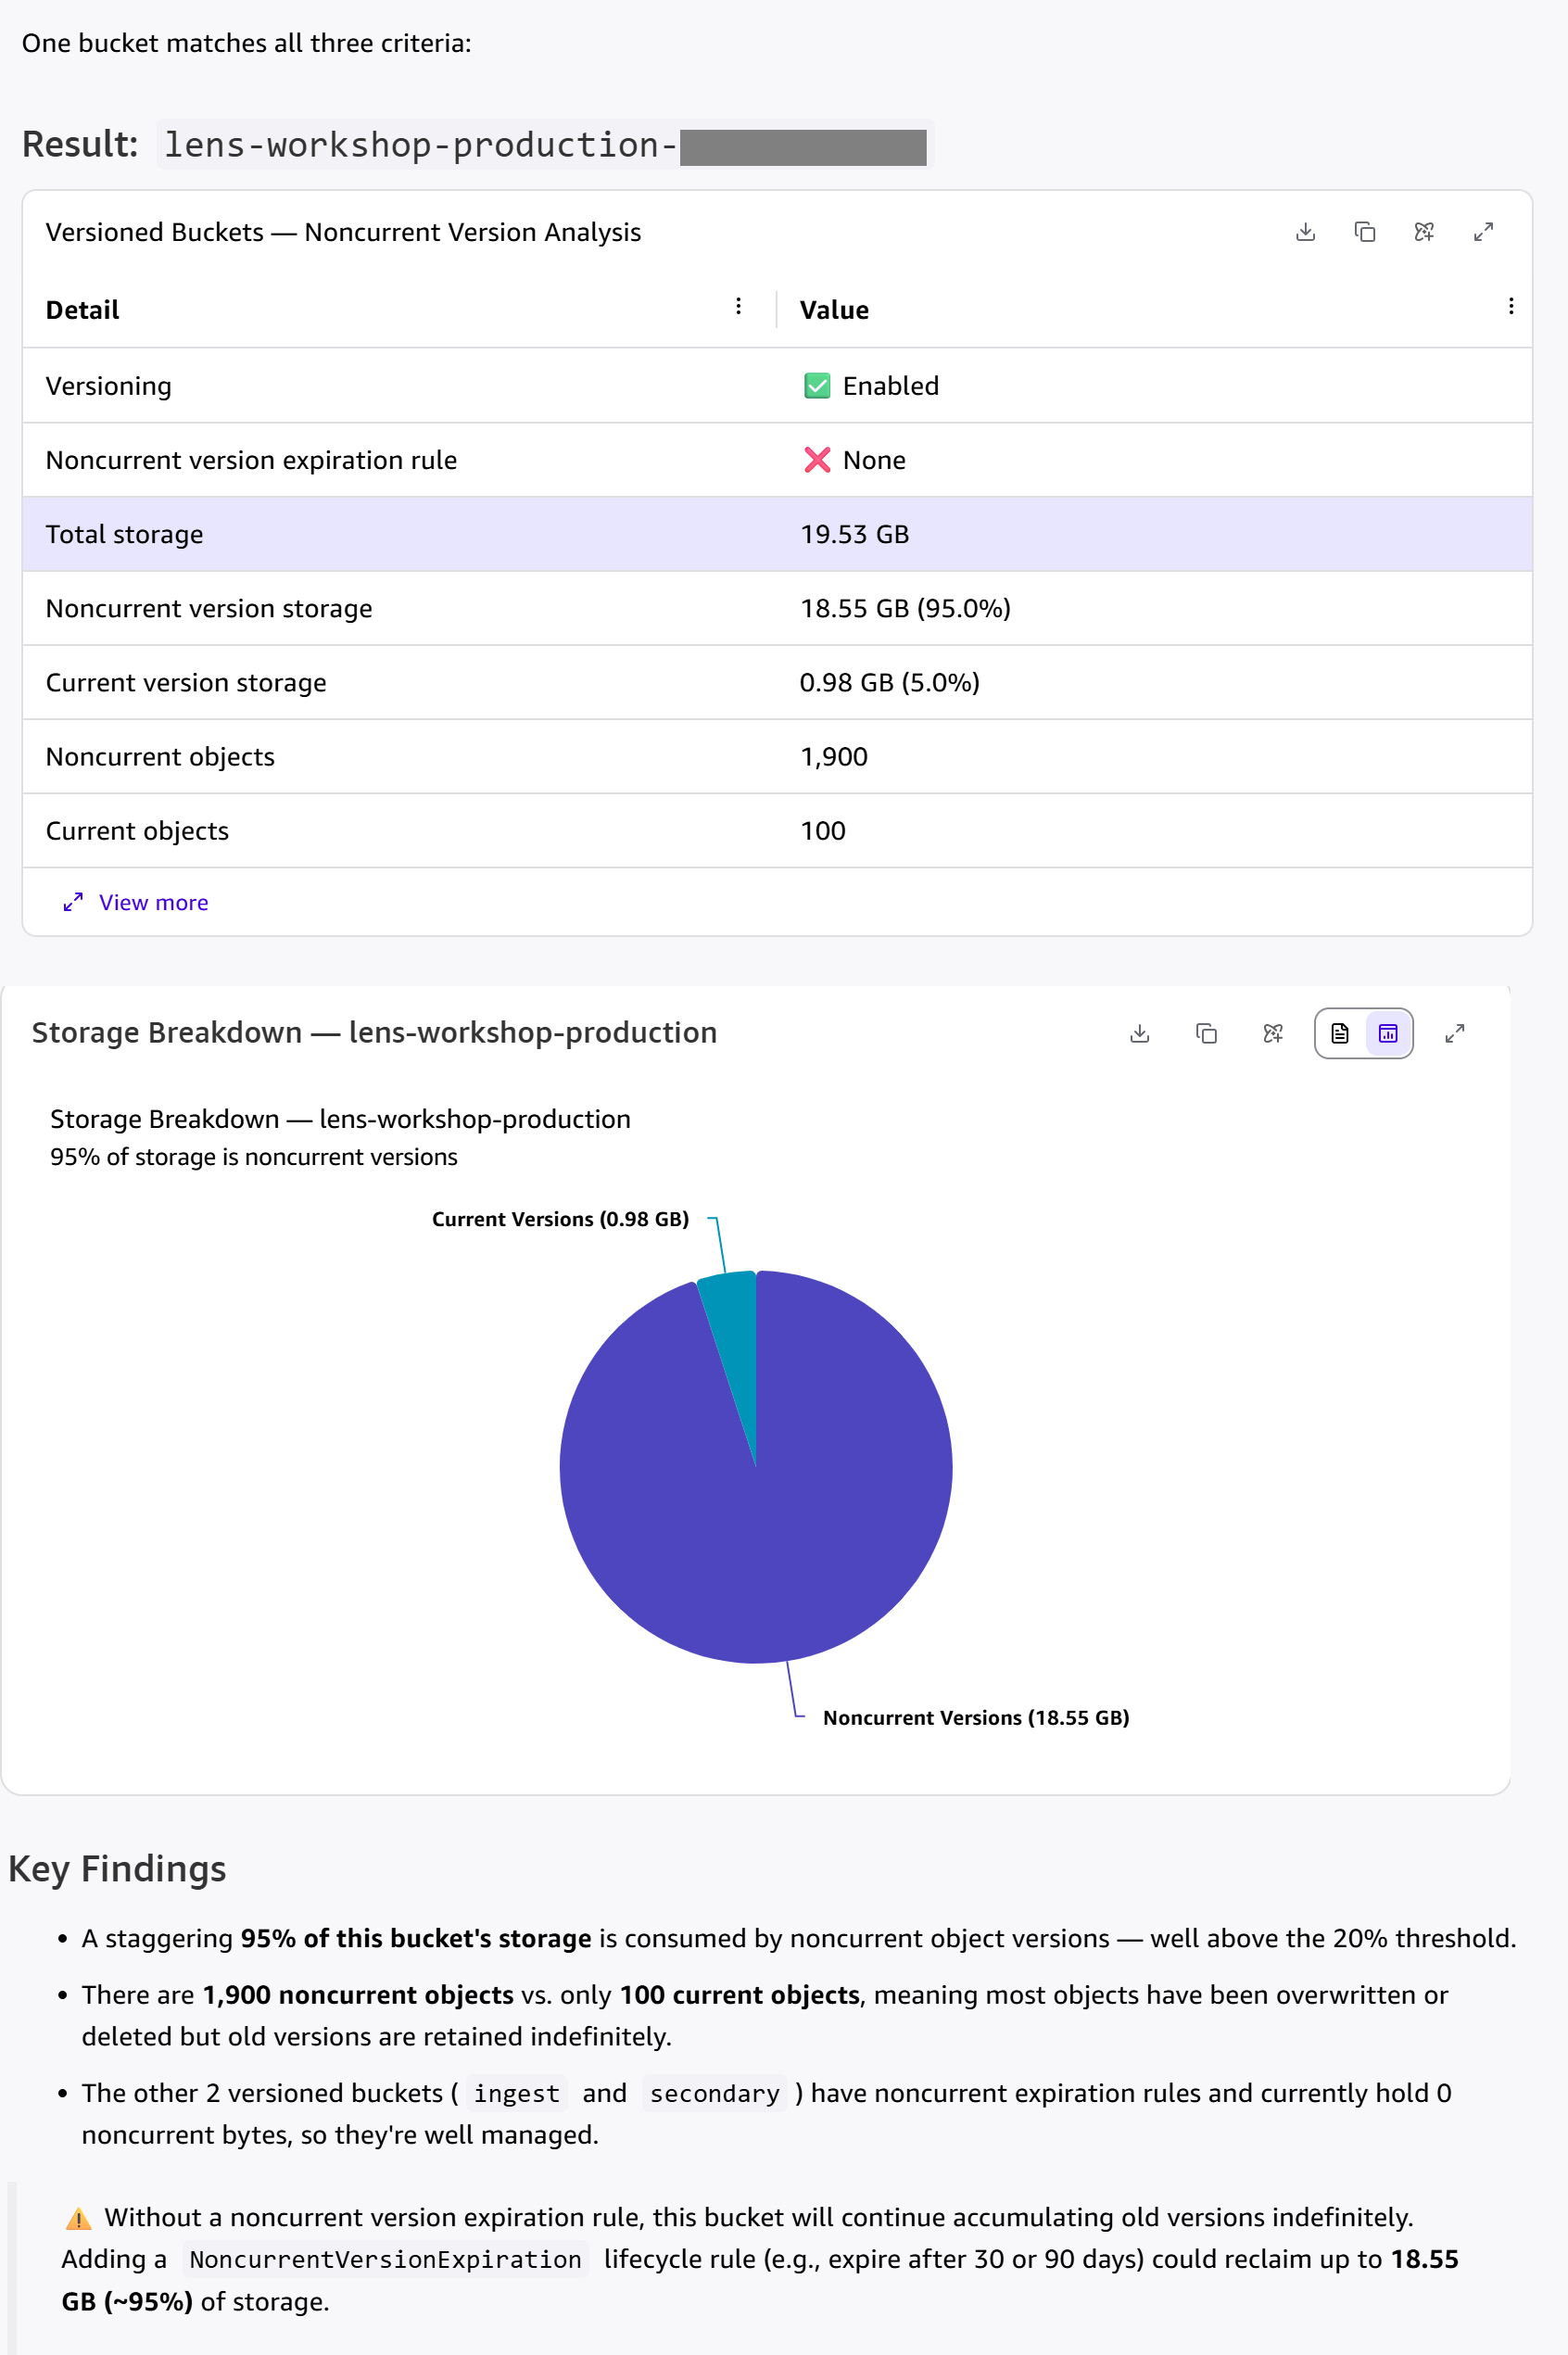
Figure 10: Example chat response for noncurrent versions
This is the cold data candidate from Figure 6. Only 0.98 GB of its 19.53 GB is current, so a noncurrent version expiration rule saves more than a transition. Check for noncurrent versions before choosing a lifecycle action.
A lifecycle rule removes existing waste, but the application that created it keeps generating more. To find the source, ask:
In those buckets, which requesters started multipart uploads last month without completing or canceling them?
Add lifecycle rules to delete incomplete multipart uploads and expire noncurrent versions after the required retention period that the bucket owner confirms.
Right-size replication and cross-Region access
Replication and cross-Region reads add data transfer charges, and replicas add storage charges. Start with the buckets that replicate to another Region:
Which buckets replicate to another Region? Show how much data each one replicates, the storage class of the replica, and how often the replicas were read in the last 90 days.
Quick identifies the replication flow from the ingest bucket to the secondary bucket and compares both sides.
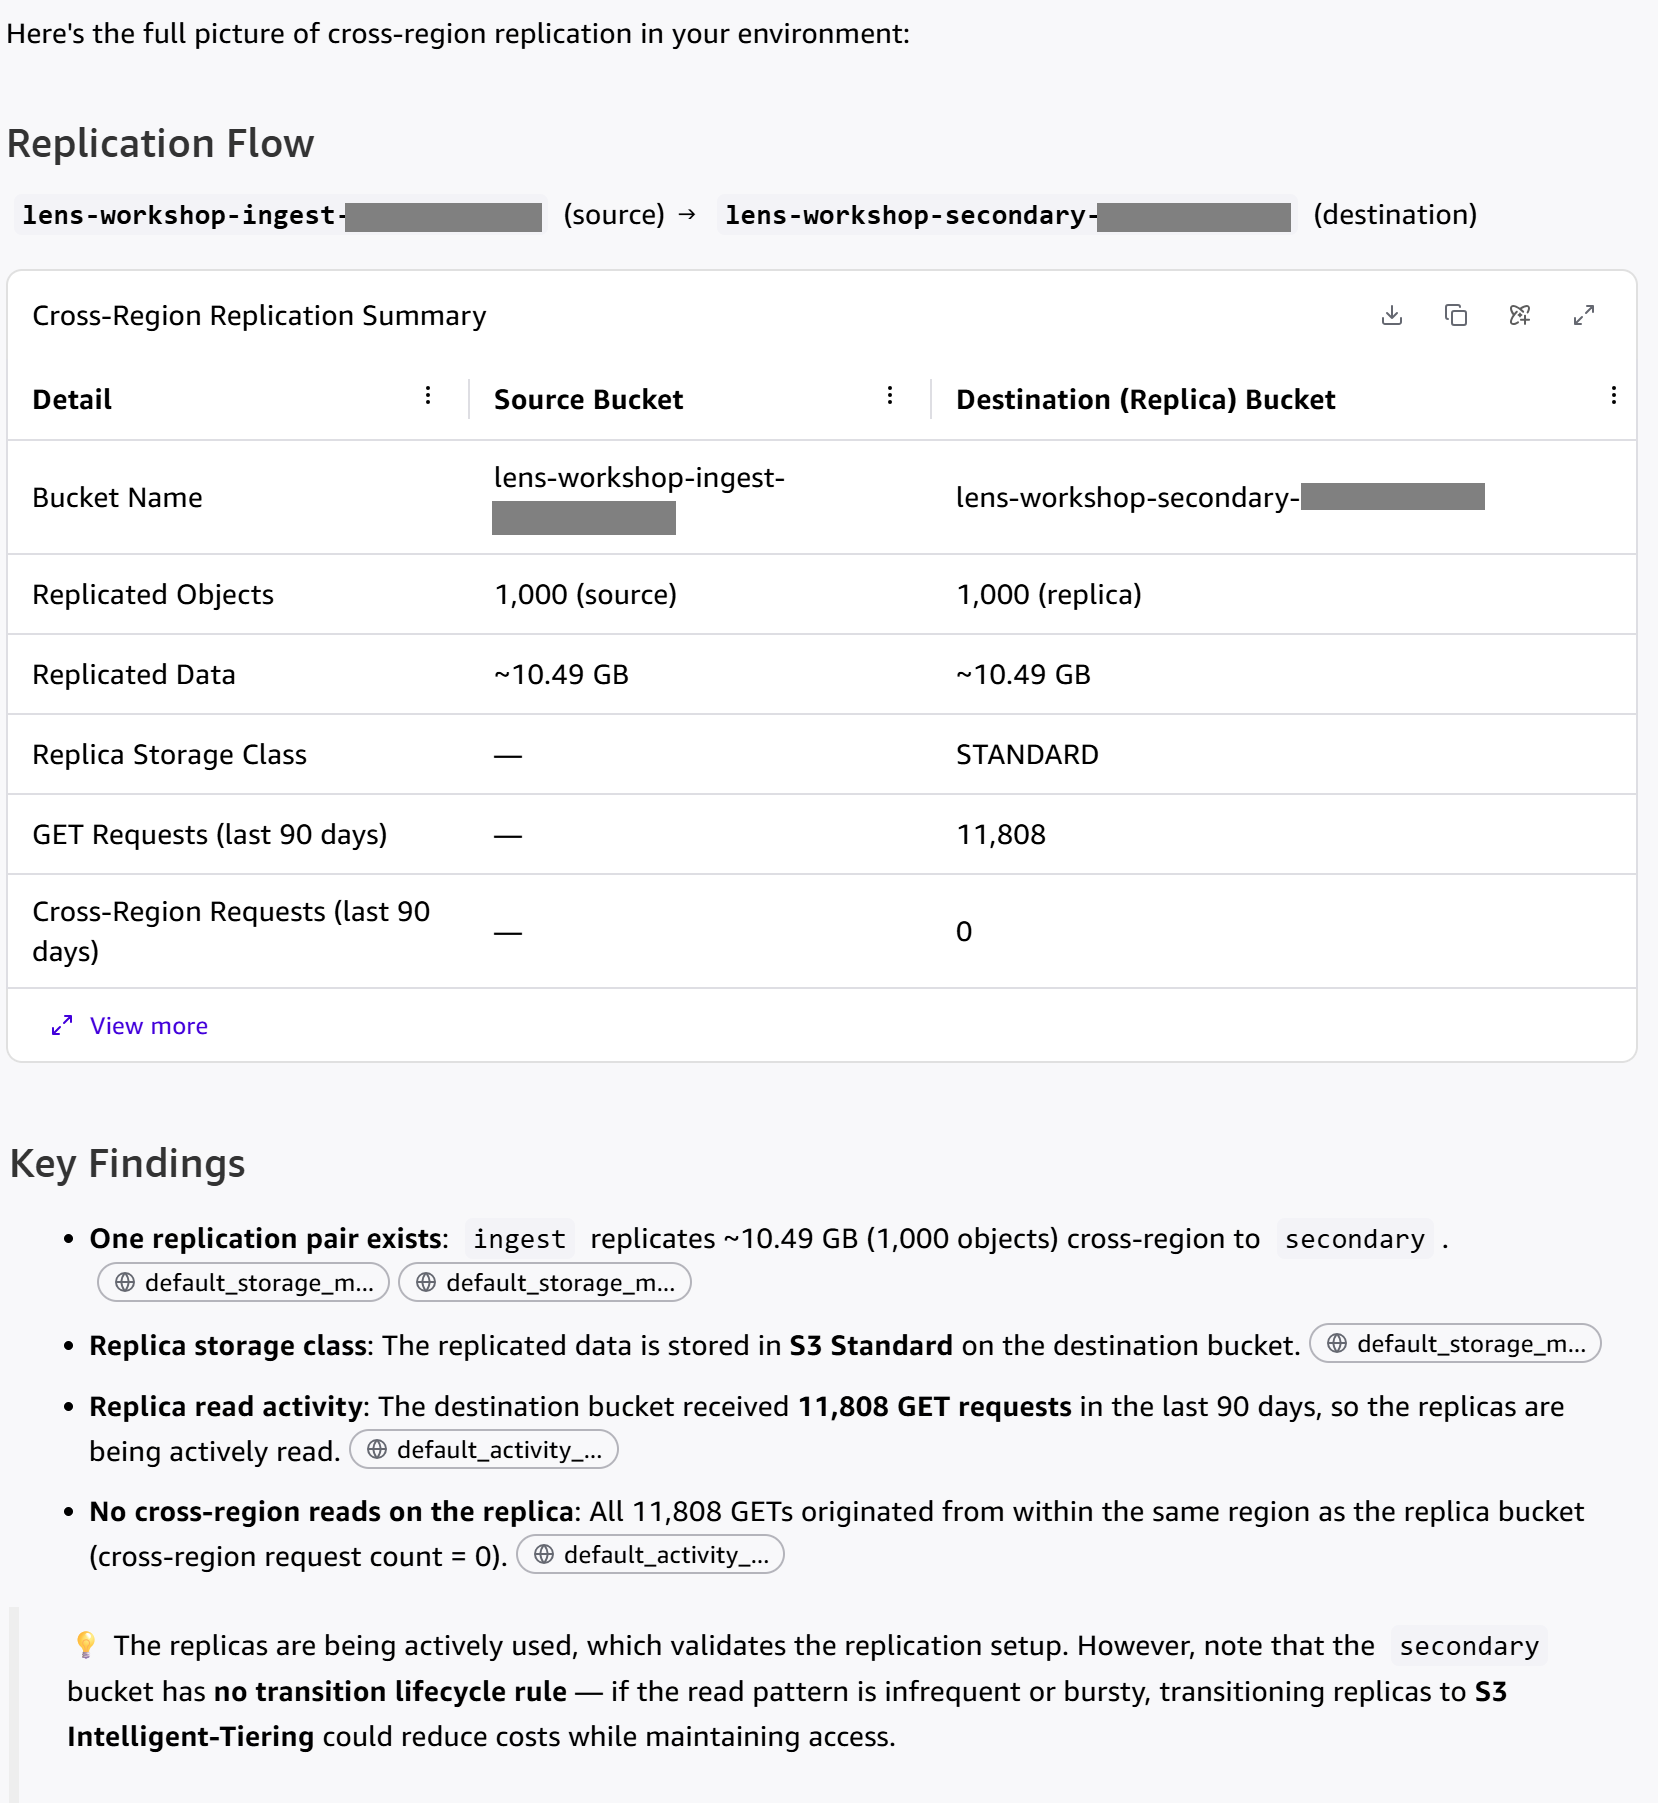
Figure 11: Example chat response for cross-Region replication
Another cost to check is an application reading across Regions daily. To find it, ask:
Which requesters read the most data from outside each bucket’s Region in the last 30 days?
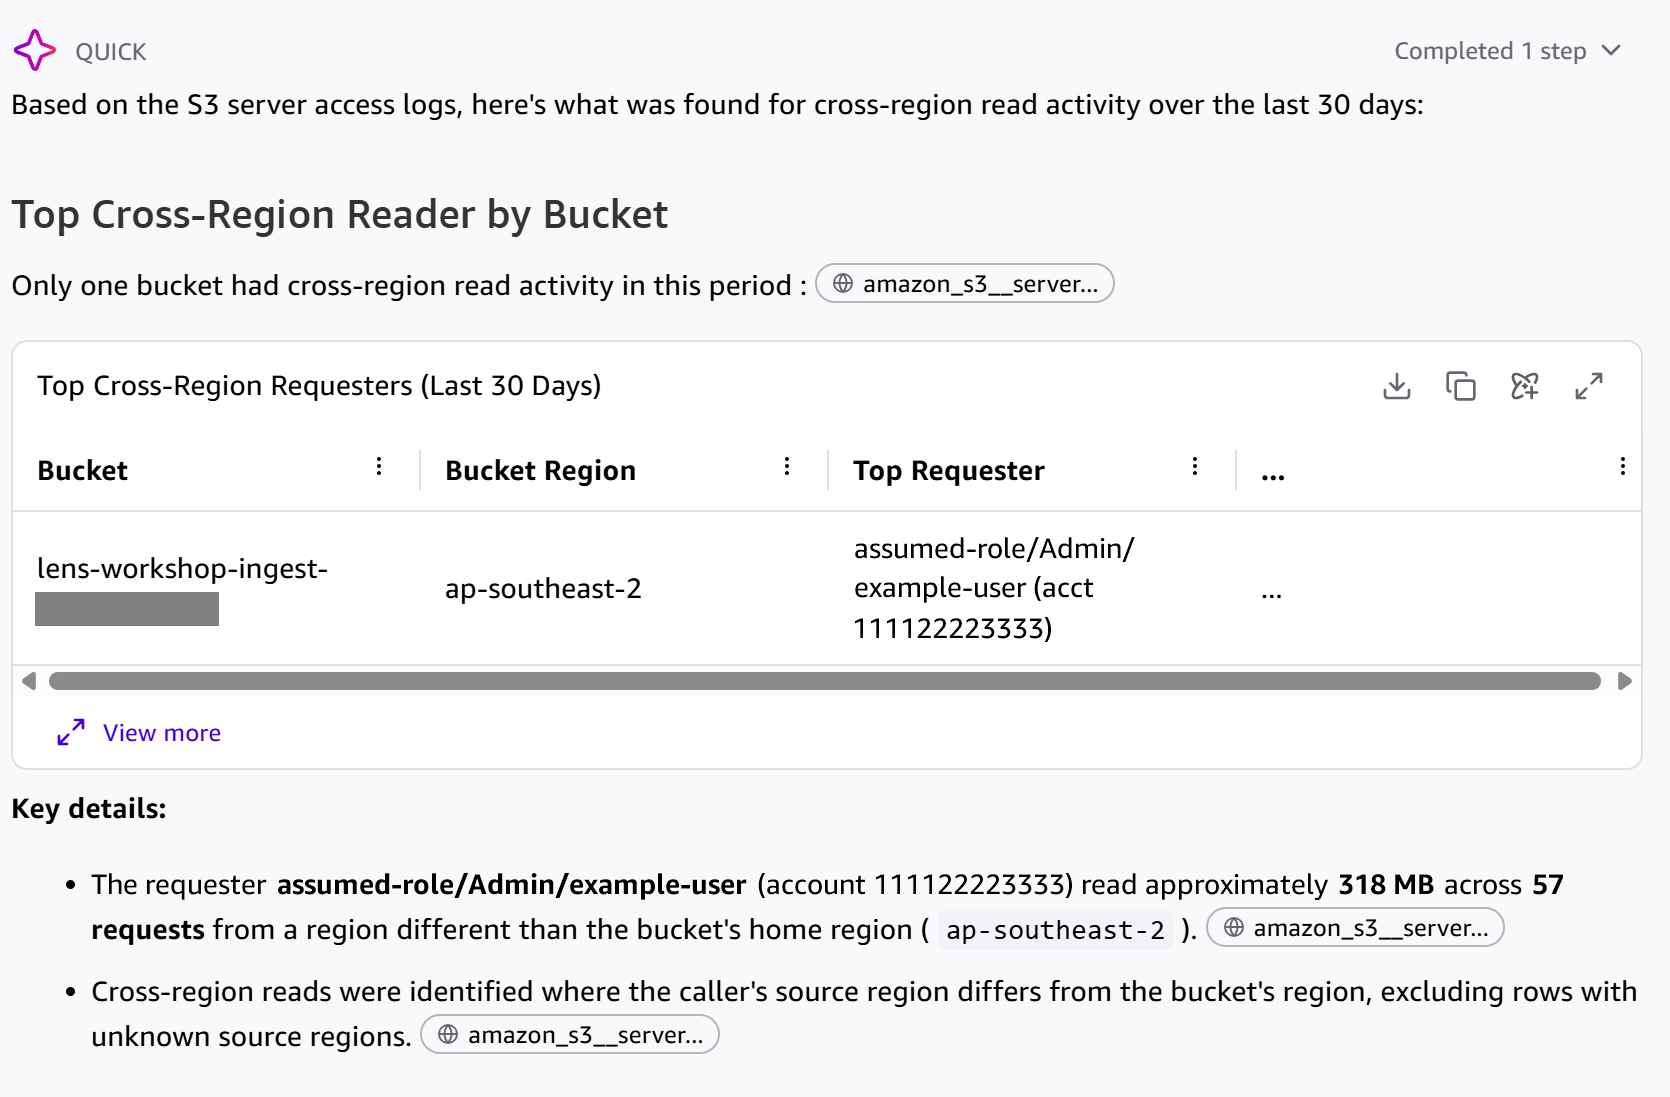
Figure 12: Example chat response for cross-Region requesters
S3 Storage Lens shows which buckets receive cross-Region requests, and the source_region field in server access logs identifies the sender (Figure 12). If one application reads the same data repeatedly, replicate it to the application’s Region or move the application to the bucket’s Region.
Spot request growth early
Request charges grow with traffic, so a sudden rise in GET requests or bytes downloaded is worth investigating. To find the bucket with the fastest growth, ask:
Which bucket had the largest week-over-week increase in GET requests or bytes downloaded?
In the week of July 27, the ingest bucket’s GET requests and downloaded bytes rose by 40 percent, about 10 times the next-largest increase.
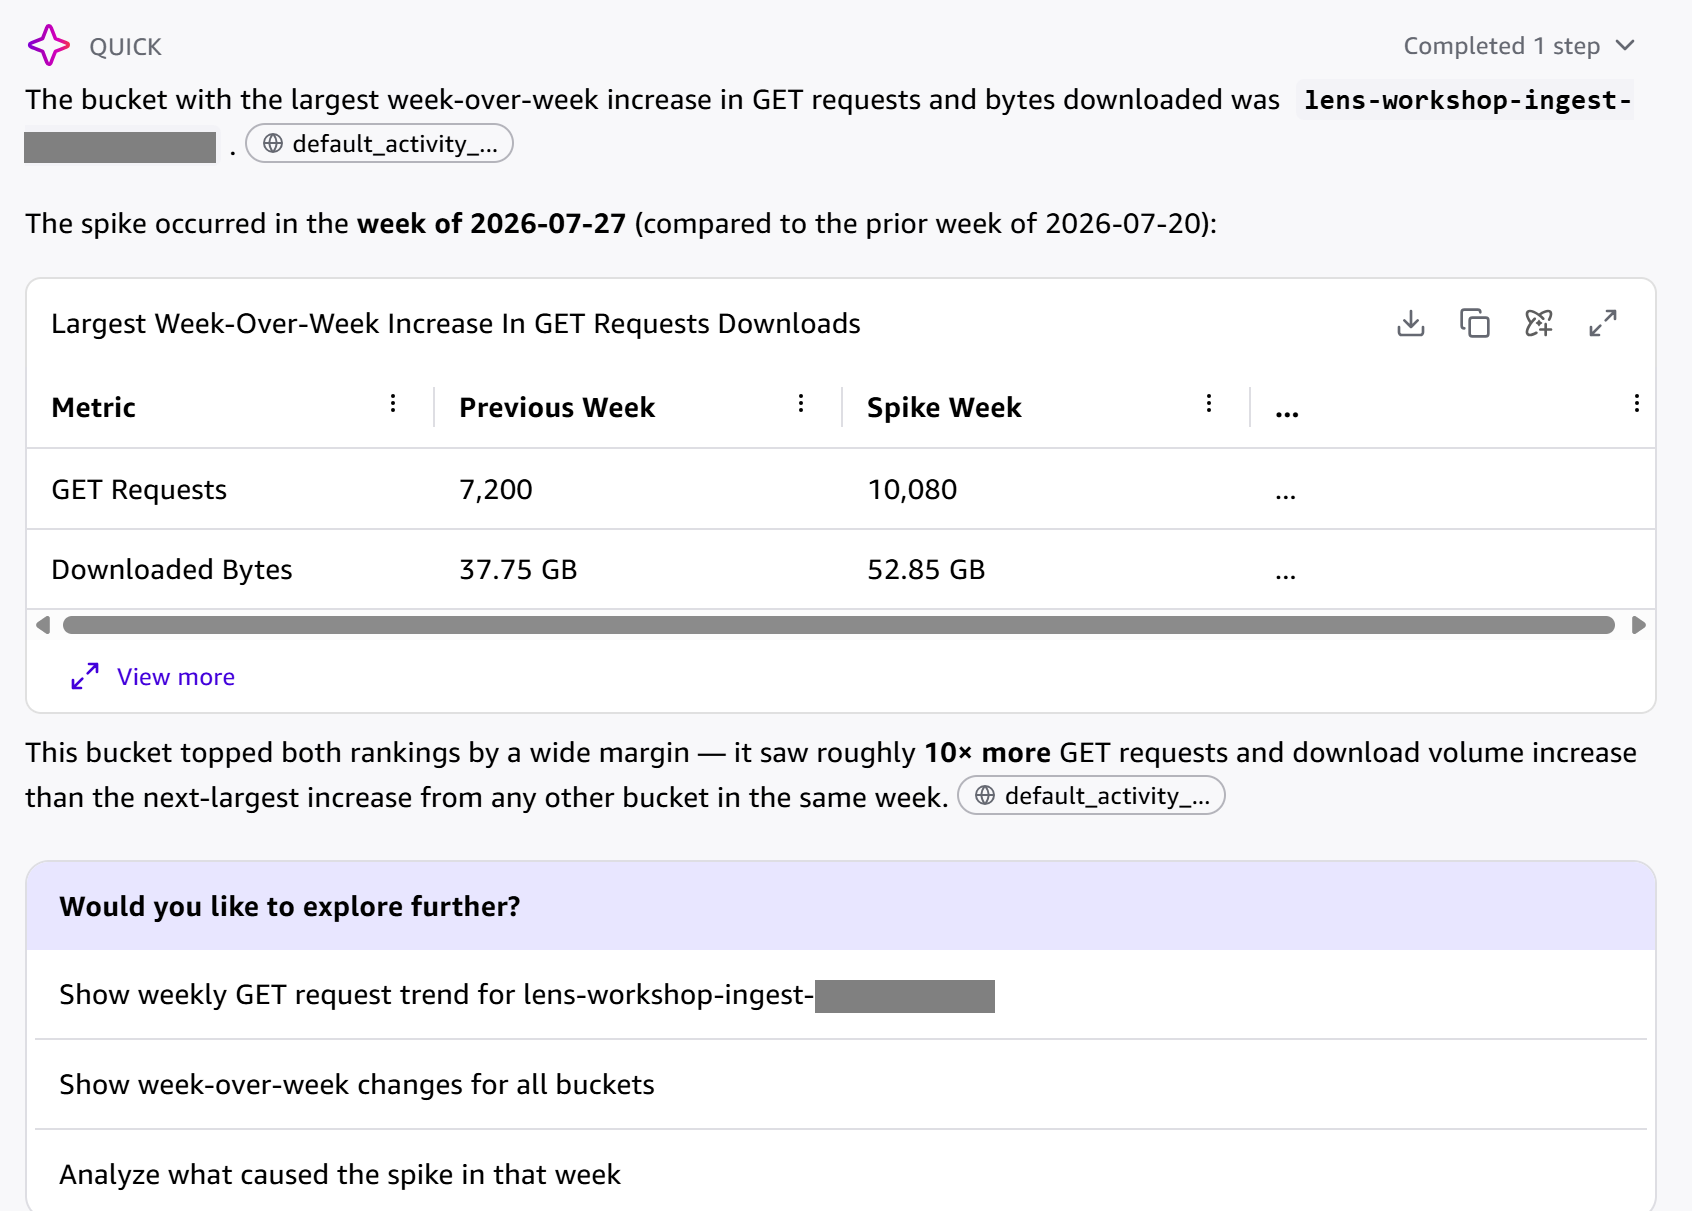
Figure 13: Example chat response for the bucket with the largest week-over-week increase
To check whether the increase lasts, choose the suggested follow-up about the bucket’s weekly GET request trend. Requests stayed elevated through mid-October, which Quick attributes to a new workload or scheduled process.
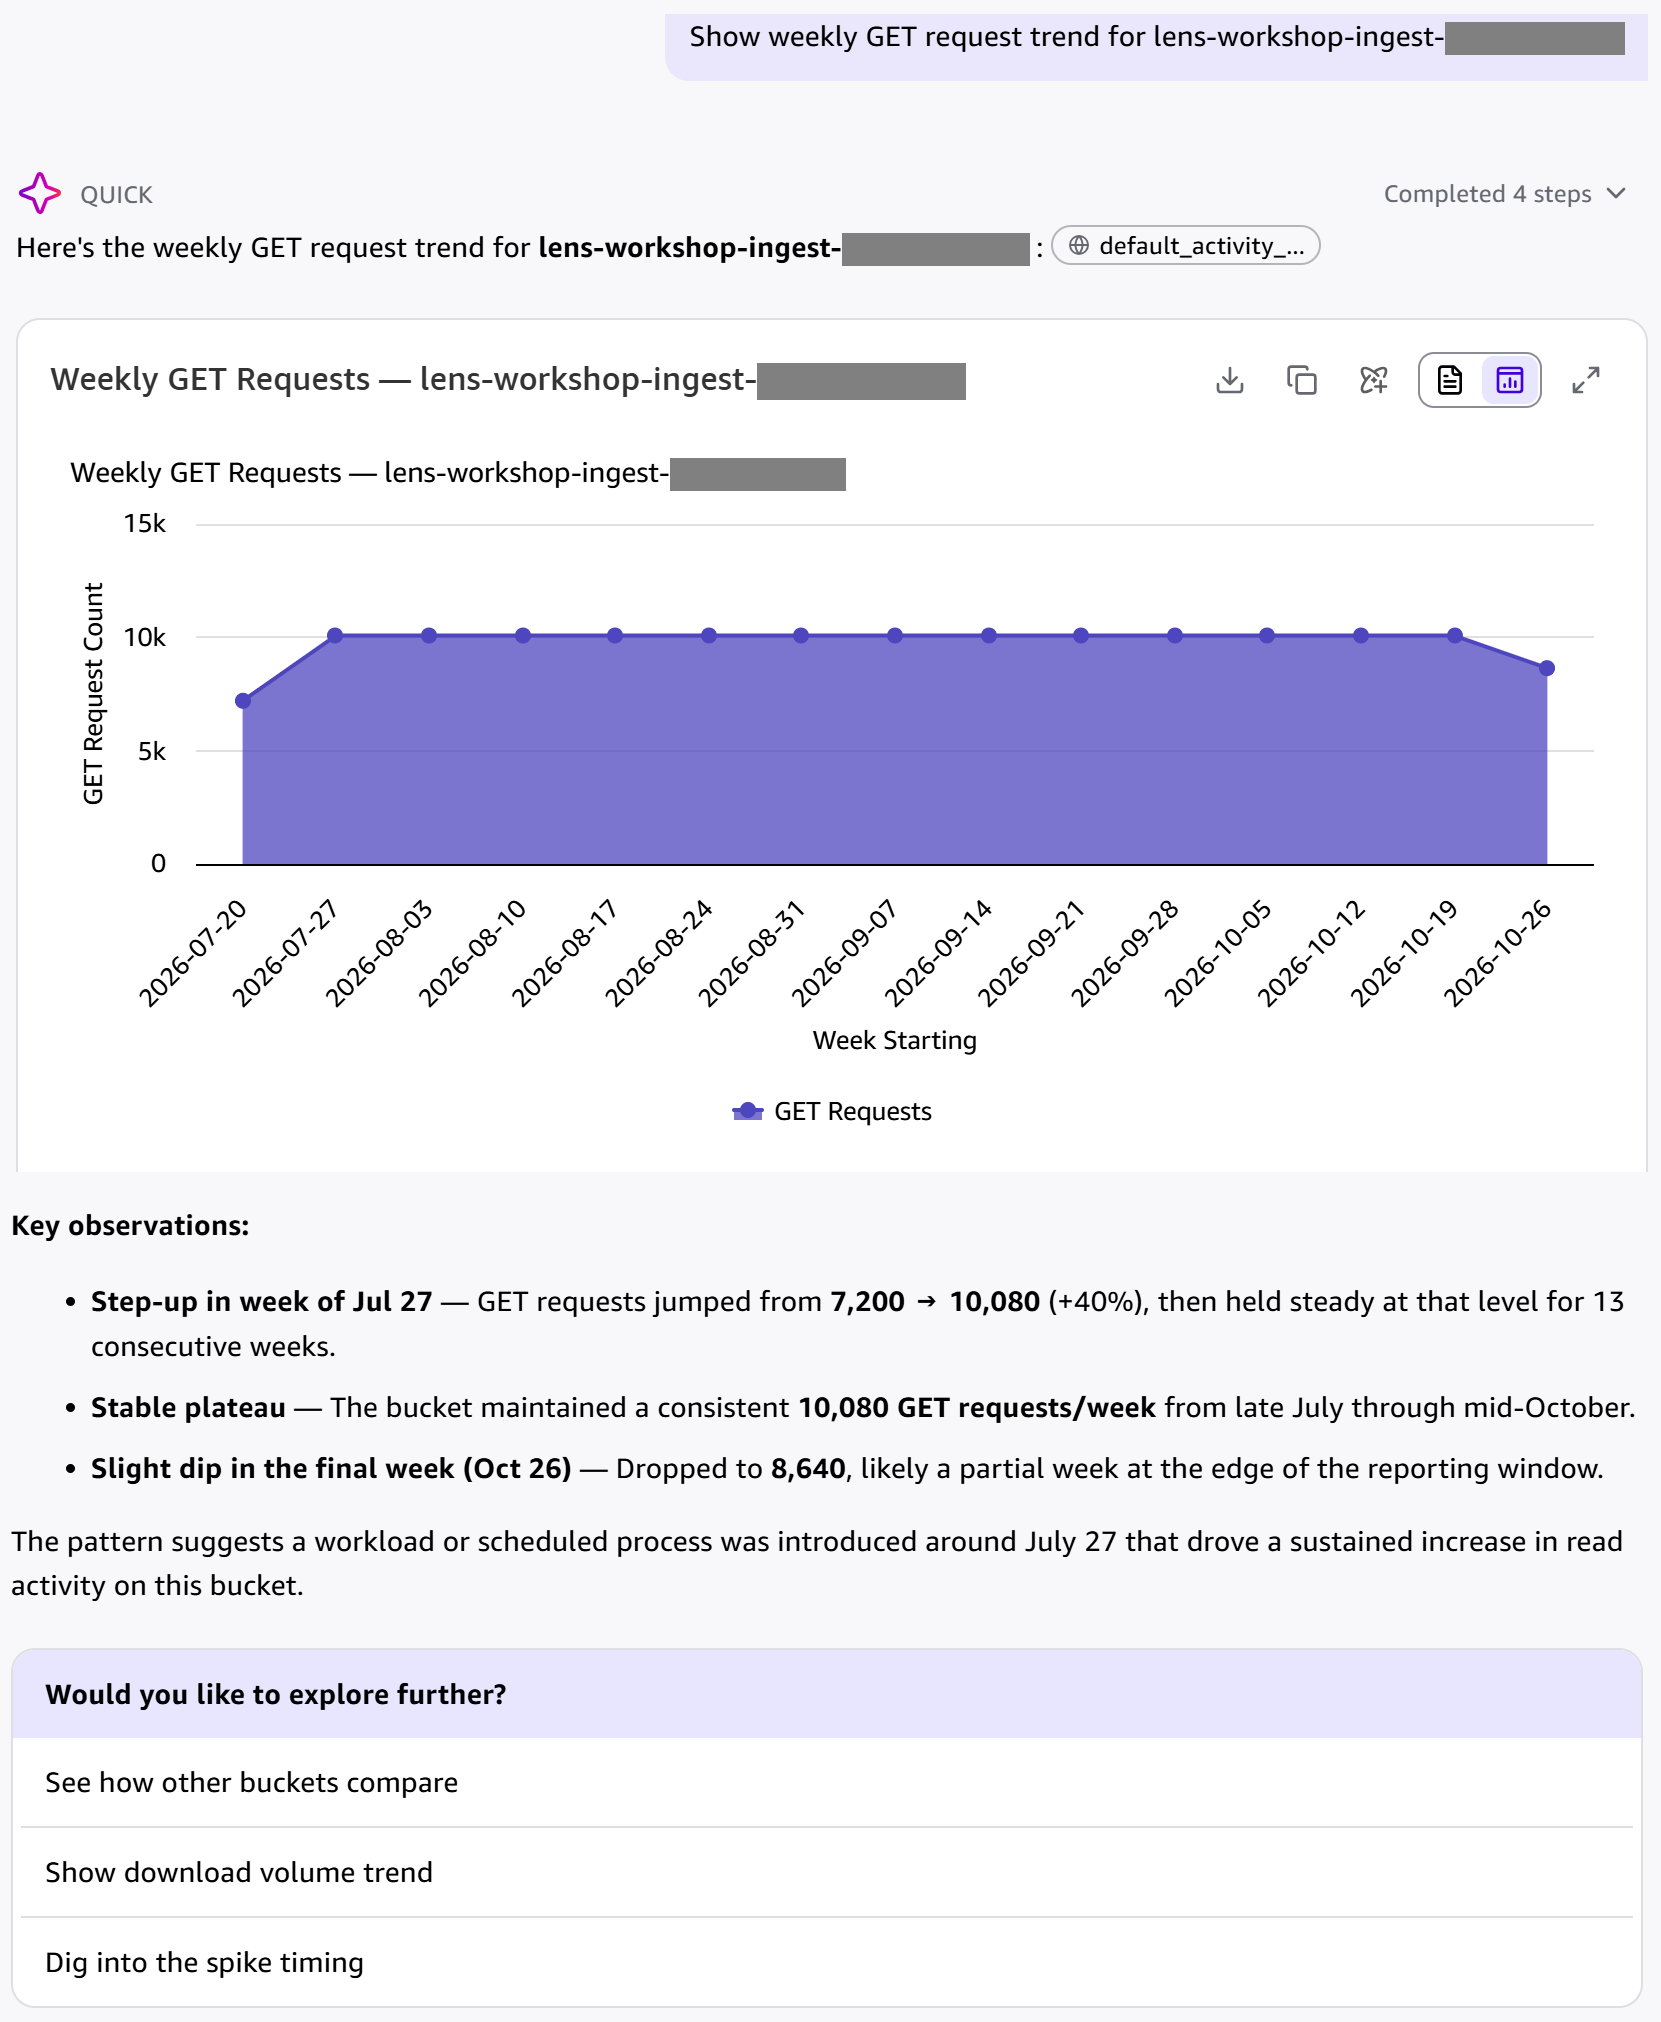
Figure 14: Weekly GET request trend for the bucket with the largest increase
More questions to try
These questions use the same datasets. Adjust thresholds and time windows to fit your buckets.
| Goal | Question |
| Find large buckets that are rarely read | Which buckets store more than 1 TB but received fewer than 10 GET requests in the last 30 days? For each one, who made those requests, and does the bucket have a lifecycle transition or expiration rule? |
| Find hot objects to keep in S3 Standard or S3 Intelligent-Tiering | Which 10 objects received the most GET requests in the last 30 days, how much data did they transfer, and which requesters read them? |
| Choose a storage class for each prefix | For the 10 largest prefixes in amzn-s3-demo-bucket, on how many of the last 90 days did each prefix receive at least one GET request? |
| Check S3 Intelligent-Tiering adoption | Which buckets store data in S3 Intelligent-Tiering, and which of my 10 largest buckets store none? |
| Track each requester’s monthly share | For each month, what share of each bucket’s total bytes downloaded came from each requester? |
| Find the fastest-growing bucket | Which bucket grew the most in total storage over the last 30 days, and does it have a lifecycle rule? |
(Optional) Share the results in a dashboard
To track savings over time, create an analysis from the same datasets, describe the visuals in natural language, and publish it as a dashboard. Share it with your team and bucket owners, and schedule weekly email reports.
Security best practices
Server access logs contain requester ARNs, source IP addresses, and object keys, which can include customer or project names. Share the server access logs dataset only with people who investigate access patterns, and use row-level security to limit bucket owners to their own buckets. Expiration rules delete data permanently, so confirm retention requirements before adding one.
Clean up
If you no longer need the resources you created, delete them to avoid future charges. If you used an existing S3 Storage Lens dashboard, keep it.
- In AWS Quick, delete the dashboards, analyses, datasets, and data sources that you created.
- In Manage account, turn off access to the table buckets.
- On each bucket’s Properties tab, remove the delivery under Log delivery to CloudWatch.
- Edit your S3 Storage Lens dashboard to turn off the export or return to the free tier, or delete the dashboard.
Conclusion
In this post, we showed how to bring S3 Storage Lens metrics and server access logs together in S3 Tables and query them in natural language with AWS Quick. You used this approach to find cold data, storage waste from incomplete uploads and old versions, replication overhead, and request growth.
To get started, turn on the S3 Storage Lens export to S3 Tables in the Amazon S3 console and add server access log delivery for your highest-spend buckets. If you try this solution, share the questions that found the most savings in the comments.