AWS Storage Blog
Query Amazon S3 access logs instantly with CloudWatch and S3 Tables
Knowing who accessed your data, when, and how is the foundation for security investigations, compliance audits, cost attribution, and performance troubleshooting. Detailed access logs capture every request: who made it, which resource was accessed, and what response was returned. In practice, though, they arrive as semi-structured records spread across different locations. Turning them into actionable answers has traditionally required custom forwarding pipelines, parsing logic, and ETL jobs before running a single query.
You can now deliver Amazon S3 server access logs directly to Amazon CloudWatch Logs, where they are parsed into structured fields and ready to query within seconds. CloudWatch Logs ingests and indexes log data, and you can then use CloudWatch Logs Analytics and Insights for on-demand queries and metric filters, and set alarms for proactive monitoring. You can also deliver them to an Amazon S3 general purpose bucket in JSON or Apache Parquet format, or mirror a CloudWatch Logs log group to S3 Tables in Apache Iceberg format for SQL analytics without additional storage and maintenance cost. These delivery paths complement the existing delivery of server access logs to S3 general purpose buckets, giving you more flexibility in how you monitor and analyze access to your data.
This post walks through the key capabilities you can expect and how to set up delivery to a CloudWatch Logs log group and S3 Tables using the S3 console or AWS CLI. It also covers alarms and dashboards, querying your logs, and pricing.
Key capabilities
S3 server access logs can be delivered to CloudWatch Logs as a vended log source, joining sources like AWS CloudTrail, Amazon VPC Flow Logs, and AWS WAF logs. Once there, your access logs work with existing CloudWatch Logs capabilities for unified log management and analytics:
- Instant querying: Logs are parsed into structured fields upon ingestion so you can query them with CloudWatch Logs Insights within seconds of delivery.
- SQL analytics: Enable the integration to query logs with standard SQL in Amazon Athena and other Iceberg-compatible engines. Iceberg table maintenance including compaction and snapshot management is handled for you. The copy of your data in S3 Tables and Iceberg management operations like compaction are included at no additional charge, and you only pay for the queries against the data.
- Cross-account and cross-Region aggregation: Query across accounts in place with CloudWatch cross-account observability, or replicate logs from multiple accounts and Regions into a central account with CloudWatch Logs centralization.
- Organization-wide enablement: Standardize delivery across your AWS Organization with telemetry enablement rules. From your organization’s management or delegated administrator account, define a rule that automatically turns on S3 server access log delivery to CloudWatch Logs for buckets across accounts and Regions, or by tags, so both new and existing buckets get consistent monitoring coverage without per-bucket setup.
- KMS encryption: Encrypt your access logs with your own AWS KMS keys by configuring encryption on the log group. If you also enable the S3 Tables integration on a KMS-encrypted log group, grant the
systemtables.cloudwatch.amazonaws.comandmaintenance.s3tables.amazonaws.comservice principals access to the key. - Unified retention: Set a retention period on the CloudWatch Logs log group and the S3 Tables integration applies the same retention to your Iceberg data. Because they are coupled, the S3 Tables copy is not an independent archive. It expires with the log group and deleting the log group (or a log stream) removes the Iceberg data too.
- No infrastructure to manage: No AWS Glue crawlers, no Athena table definitions, no ETL jobs. Delivery, parsing, and table maintenance are fully managed.
The vended delivery framework also supports delivery to an S3 general purpose bucket (JSON or Parquet) and Amazon Data Firehose as independent destination choices. The existing text-format S3 server access log delivery path remains available. This post focuses on the CloudWatch Logs destination; for the others, see enable logging from AWS services in the CloudWatch Logs User Guide.
Getting started
Setting up delivery takes a few steps in the S3 console, or a few API calls with the AWS CLI.
Prerequisites
- An S3 general purpose bucket (the source bucket you want to log).
- A CloudWatch Logs log group in the same Region as the source bucket. In the console, log groups prefixed with
/aws/vendedlogs/are created automatically; any other name must be created first, as must any log group you reference from the CLI. A log group’s class is fixed at creation: the Standard class supports metric-filter alarms shown later in this post, while the Infrequent Access class supports Logs Insights and the S3 Tables integration at lower ingestion cost but does not support metric filters. - AWS IAM permissions to create CloudWatch Logs deliveries and allow vended log delivery on the source bucket. For the optional S3 Tables integration, additional observability admin and S3 Tables permissions are required. See Delivering server access logs to CloudWatch Logs for the full prerequisites and permission list.
Option 1: Amazon S3 console
If you prefer a guided setup without using the command line, the S3 console walks you through delivery configuration in a few clicks and can auto-create the destination log group for you.
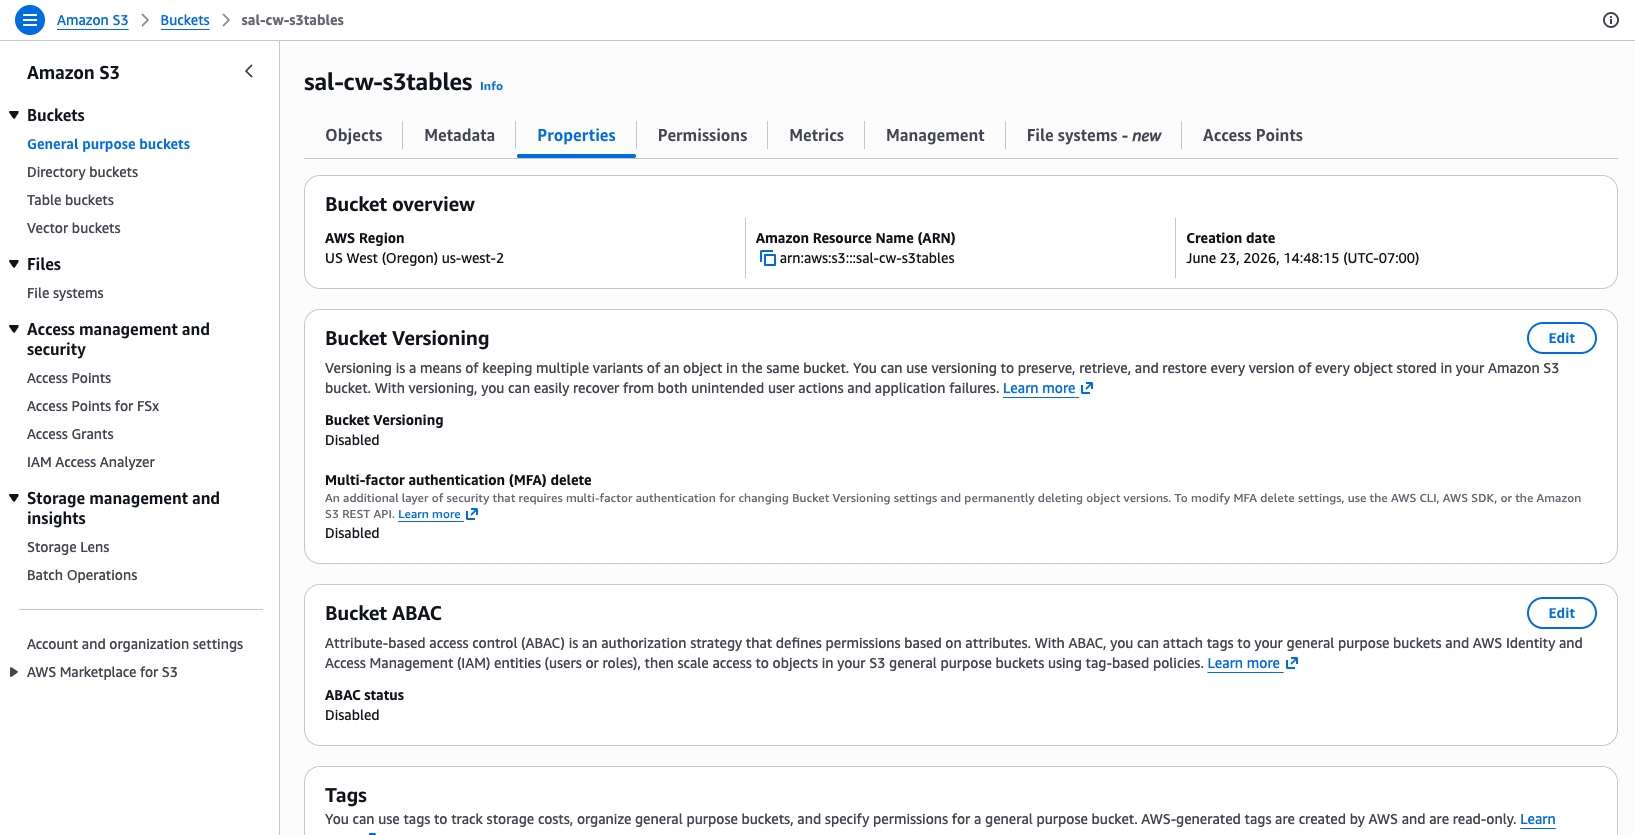
Step 1: Open the bucket properties
Open the Amazon S3 console, navigate to your bucket, and choose the Properties tab.
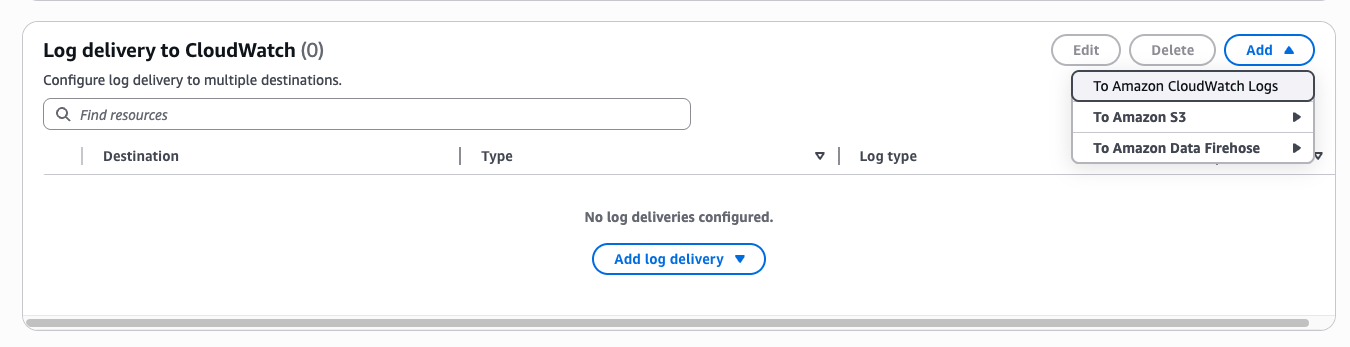
Step 2: Add delivery to CloudWatch Logs
In the Log delivery to CloudWatch section, choose Add – To Amazon CloudWatch Logs. The same menu also offers delivery to Amazon S3 and Amazon Data Firehose. For the S3 and Firehose destinations, see enable logging from AWS services in the CloudWatch Logs User Guide.
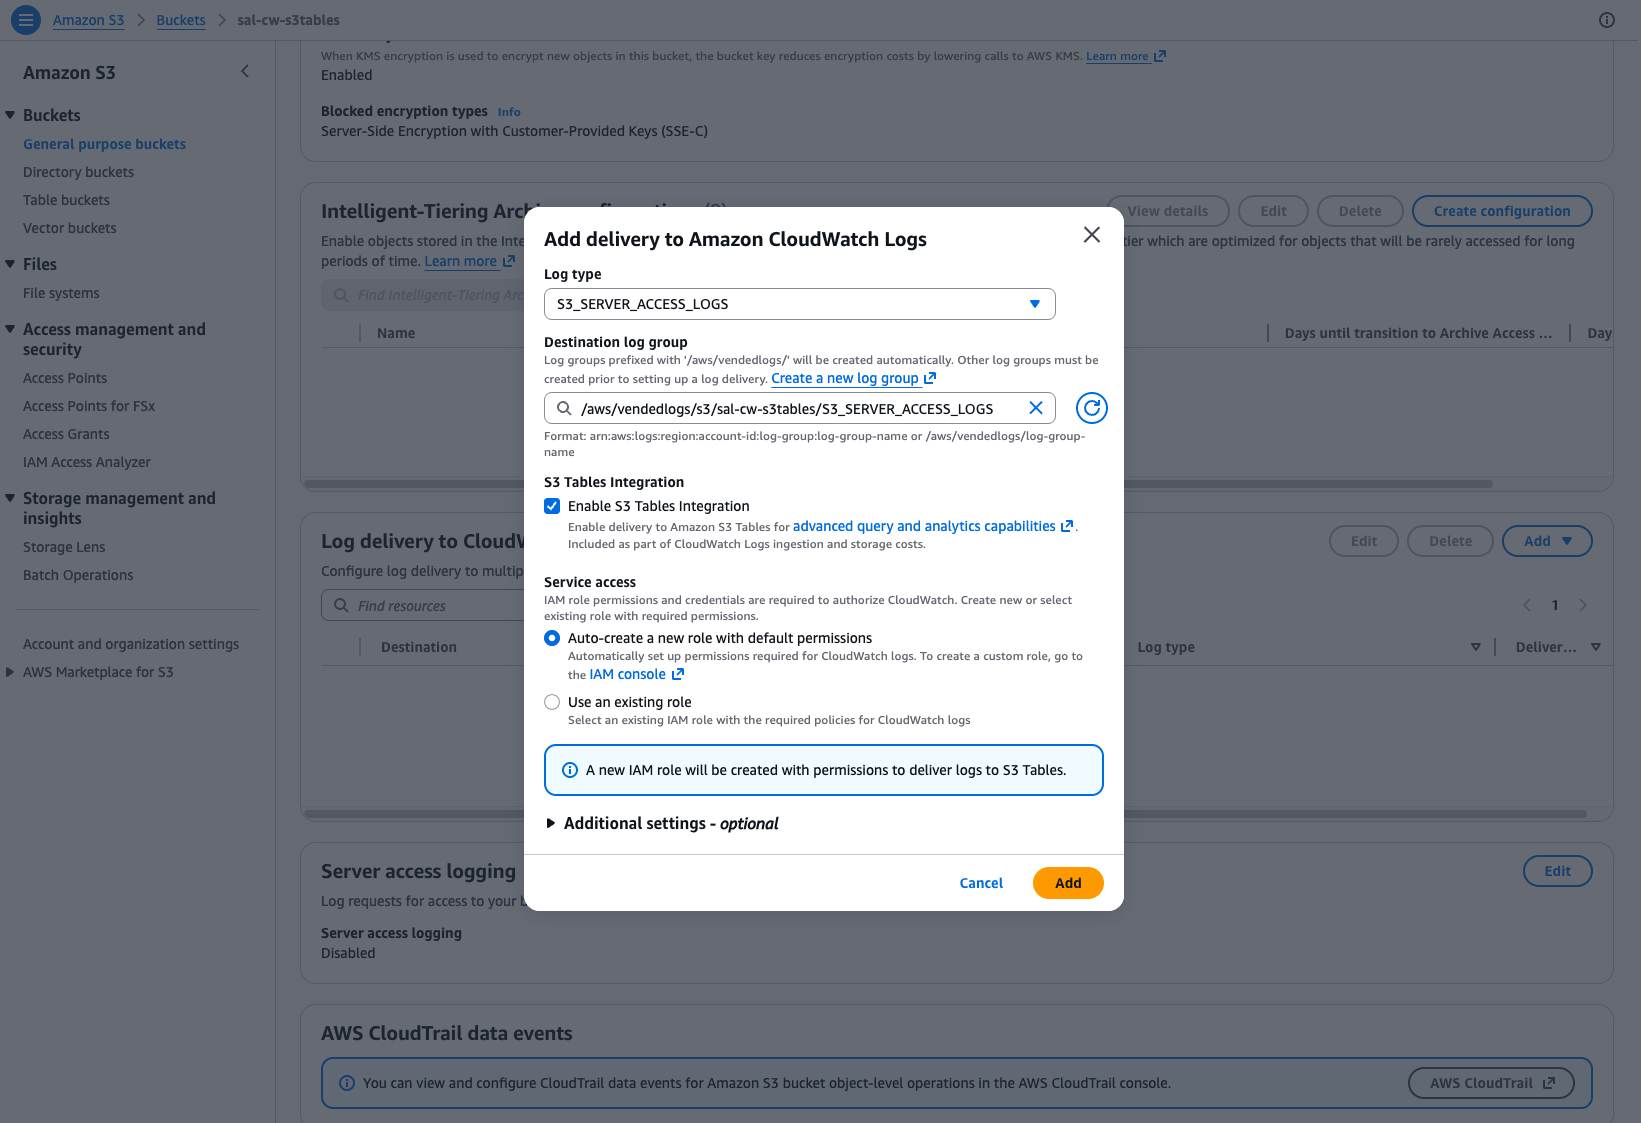
Step 3: Choose a destination log group
Select a Destination log group. To also query your logs with SQL, select Enable S3 Tables integration to deliver them in Iceberg format to S3 Tables. The S3 Tables integration is configured once per account per Region, so if it is already enabled this option appears selected and read-only. Under Service access, leave Auto-create a new role with default permissions selected to let CloudWatch create the role it needs. Then choose Add.
Set up delivery across your organization: To configure this at scale instead of per bucket, use telemetry enablement rules. From your organization’s management or delegated administrator account, define a rule that automatically turns on S3 server access log delivery to CloudWatch Logs for buckets across your accounts and Regions, or by tags, so both new and existing buckets get consistent coverage without configuring each one individually.
Option 2: AWS CLI
If you need to automate delivery across multiple buckets, integrate setup into infrastructure-as-code, or script repeatable deployments, the AWS CLI gives you full control over each step.
The AWS CLI must target the same Region and account as the source bucket. Delivery configuration takes 15 to 20 minutes to propagate. After that, like the existing S3 server access logging experience, delivery is best-effort and most log records arrive within a few hours. Only new requests are logged, with no backfill of historical data.
Step 1: Create a delivery source (per source bucket)
This registers a specific S3 bucket as a log source with CloudWatch Logs. Repeat this step for each bucket you want to log.
aws logs put-delivery-source \
  --name my-sal-source \
  --resource-arn arn:aws:s3:::my-bucket \
  --log-type S3_SERVER_ACCESS_LOGS \
  --region us-east-1
Step 2: Create a delivery destination (once per log group)
This specifies the CloudWatch Logs log group where logs will be delivered. Multiple source buckets can point to the same destination.
aws logs put-delivery-destination \
  --name my-sal-destination \
  --delivery-destination-configuration '{"destinationResourceArn": "arn:aws:logs:us-east-1:123456789012:log-group:my-sal-logs"}' \
  --region us-east-1
Step 3: Create a delivery (per source bucket)
This links the source to the destination and starts log delivery. Repeat for each source bucket.
aws logs create-delivery \
  --delivery-source-name my-sal-source \
  --delivery-destination-arn arn:aws:logs:us-east-1:123456789012:delivery-destination:my-sal-destination \
  --region us-east-1
Step 4: Enable the S3 Tables integration (once per account per Region, optional)
This delivers your logs in Apache Iceberg format for SQL analytics. The service role passed in –role-arn is the role CloudWatch Logs assumes to write to S3 Tables (see Prerequisites). Create the integration:
aws observabilityadmin create-s3-table-integration \
  --role-arn arn:aws:iam::123456789012:role/CWLogsS3TableIntegrationRole \
  --encryption '{"SseAlgorithm":"AES256"}' \
  --region us-east-1
`--encryption` is required. Use `{"SseAlgorithm":"AES256"}` for SSE-S3, or `{"SseAlgorithm":"aws:kms","KmsKeyArn":"arn:aws:kms:us-east-1:123456789012:key/key-id"}` to encrypt the table data with your own KMS key.
Then associate the S3 server access log data source:
aws logs associate-source-to-s3-table-integration \
  --integration-arn arn:aws:observabilityadmin:us-east-1:123456789012:s3tableintegration/s3-table-integration-id \
  --data-source '{"name":"amazon_s3","type":"server_access"}' \
  --region us-east-1
CloudWatch creates the aws-cloudwatch managed table bucket in your account and begins delivering logs in Iceberg format. Once enabled, all server access log deliveries in the account and Region automatically flow to S3 Tables, subject to the same best-effort delivery timing.
For AWS CloudFormation, see the documentation.
Setting up alarms and dashboards in CloudWatch
With your access logs in CloudWatch, you can access full CloudWatch functionality such as metric filters and alarms. Metric filters require the Standard log class. As an example, you might want an alarm to help you catch misconfigured IAM policies, credential leaks, or unauthorized scanning attempts before they become incidents. To support this, create a metric filter that counts 403 responses, then set an alarm to notify you when denied requests exceed 100 in a 5-minute period:
Metric filter pattern: { $.http_status = 403 }
Alarm threshold: 100 requests in 5 minutes
Action: SNS notification to your security team
Server access logs and S3 request metrics serve different dashboard needs. Request metrics give you near-real-time 1-minute aggregates (total counts, error rates, latency) published directly by S3, filterable by prefix, object tag, or access point. Server access logs add per-operation and per-requester breakdown that request metrics can’t provide. Use both together for complete visibility.
For example, S3 request metrics report 4xxErrors as a bucket-wide total. A Logs Insights widget breaks that down by operation:
stats count(*) as requests,
sum(http_status >= 400 and http_status < 500) as client_errors,
sum(http_status >= 500) as server_errors
by operation, bin(5m) as interval
| sort interval asc
This shows whether your 4xx spike is concentrated on GetObject (likely a permissions issue) or PutObject (likely a policy or condition mismatch). That per-operation context is something request metrics alone can’t give you.
Because delivery is best-effort, these widgets suit trend analysis and investigation rather than real-time alerting.
Querying logs with CloudWatch Logs Analytics and Insights
Once delivery is active, you can query your access logs immediately in the CloudWatch console using Logs Analytics and Insights. Here are practical queries for common use cases.
For each query, first select or filter on the `amazon_s3.server_access` logs in scope. The queries below don’t include a time filter. You can control this with the console time selector in Logs Analytics or Insights, and because cost scales with the volume of data scanned in that range, we recommend narrowing the window to reduce cost.
Who is accessing my data?
stats count(*) as requests by requester, operation
| sort requests desc
This breakdown of access by AWS IAM identity and operation supports access reviews and compliance audits. The requester field contains the full IAM ARN of the authenticated caller. For IAM users, that’s arn:aws:iam::123456789012:user/alice; for assumed roles (including Lambda, EC2 instance profiles, and cross-account access), it’s the full session ARN: arn:aws:sts::123456789012:assumed-role/MyRole/session-name. Anonymous requests appear as -. Because each assumed-role session gets a unique session name, grouping by raw requester produces one row per session rather than one row per role, which is useful for spotting individual sessions but noisy if you want a per-role summary.
What’s driving read volume?
filter operation like /REST\.GET\.OBJECT/
| parse key_name /^(?<prefix>[^\/]+)\//
| stats sum(bytes_sent_size) as total_bytes_returned, count(*) as requests by prefix
| sort total_bytes_returned desc
| limit 10
Ranks requesters by data read from your bucket (bytes returned in GET responses), optionally filtered and grouped by prefix (in regex format). This reflects usage volume, not billable data transfer, and is useful for spotting read-heavy callers and unexpected data movement.
Querying logs in S3 Tables with SQL in Amazon Athena
If you enabled the S3 Tables integration, your logs are also available in Apache Iceberg format in the aws-cloudwatch managed table bucket, under the logs namespace as the amazon_s3__server_access table. You can query this data with standard SQL in Amazon Athena for longer-term analysis, complex aggregations, and joins with other datasets (for example, correlating access logs with AWS CloudTrail in the same query). The S3 Tables integration works the same way for any CloudWatch Logs source, with server access logs being one of the sources it can mirror.
To get started, open the Athena console and choose the s3tablescatalog/aws-cloudwatch catalog. Your server access log data appears under the logs namespace, so the fully qualified table name is "s3tablescatalog/aws-cloudwatch"."logs"."amazon_s3__server_access".
The table is partitioned by day on cwl__timestamp (when the log record was created, always at or after request_time), allowing you to scan less data. Bound your window on request_time, then add a matching lower bound on cwl__timestamp to prune partitions, which can’t drop in-window rows. Don’t upper-bound cwl__timestamp, or late-delivered records are missed.
30-day request mix by requester
SELECT requester,
       operation,
       COUNT(*) as request_count,
       SUM(bytes_sent_size) as total_bytes_returned
FROM "s3tablescatalog/aws-cloudwatch"."logs"."amazon_s3__server_access"
WHERE cwl__timestamp > current_timestamp - interval '30' day
  AND request_time > current_timestamp - interval '30' day
GROUP BY requester, operation
ORDER BY request_count DESC
LIMIT 50;
Breaks down each requester’s activity by operation over the past 30 days. Because S3 request pricing varies by operation, this request mix is a useful basis for chargeback discussions. It reflects usage volume, not billable costs.
Week-over-week access pattern comparison
SELECT operation,
       COUNT(*) FILTER (WHERE request_time >= date_trunc('week', current_timestamp) - interval '7' day
                          AND request_time <  date_trunc('week', current_timestamp)) as last_week,
       COUNT(*) FILTER (WHERE request_time >= date_trunc('week', current_timestamp) - interval '14' day
                          AND request_time <  date_trunc('week', current_timestamp) - interval '7' day) as week_before
FROM "s3tablescatalog/aws-cloudwatch"."logs"."amazon_s3__server_access"
WHERE cwl__timestamp >= date_trunc('week', current_timestamp) - interval '14' day
  AND request_time >= date_trunc('week', current_timestamp) - interval '14' day
  AND request_time <  date_trunc('week', current_timestamp)
GROUP BY operation
ORDER BY last_week DESC;
Compares the two most recent complete calendar weeks by operation: the last full week against the one before. date_trunc('week', …) starts the week on Monday, and the in-progress current week is excluded so you’re comparing like with like. Helps you spot trends, detect anomalies, and validate that changes (new workloads, migrations, policy updates) are having the expected effect.
Finding cold data: when was this prefix last accessed?
SELECT MIN(request_time) AS coverage_since,
       MAX(request_time) FILTER (
           WHERE operation IN (
               'REST.GET.OBJECT', 'REST.HEAD.OBJECT',
               'REST.GET.OBJECT_TAGGING', 'REST.GET.OBJECT_ACL',
               'REST.COPY.OBJECT_GET', 'REST.SELECT.OBJECT_CONTENT',
               'REST.GET.OBJECT_ATTRIBUTES')
             AND key_name LIKE 'datasets/orders/%'
             AND (http_status BETWEEN 200 AND 299 OR http_status = 304)
       ) AS last_accessed
FROM "s3tablescatalog/aws-cloudwatch"."logs"."amazon_s3__server_access"
WHERE bucket_name = 'my-bucket';
Answers “when was anything under s3://my-bucket/datasets/orders/ last read?” This is the starting point for retention, tiering, or decommissioning decisions. The operation filter keeps last_accessed focused on object reads, so writes (PUT, DELETE) and lifecycle transitions don’t register as access. The coverage_since result is the oldest record in the table for that bucket: if last_accessed is NULL, the prefix has not been read since coverage_since, which is different from “never accessed” (reads before that timestamp are not in the table). Because the S3 Tables data shares the log group’s retention, coverage_since can be no earlier than the retention window: with 30-day retention, this query can only tell you whether a prefix was read in the last 30 days. To use it for cold-data detection, set the log group retention to at least the age threshold you care about. Because logging is best-effort, treat a NULL last_accessed as a strong signal that the prefix is cold, not as a guarantee that no reads occurred.
Pricing
Delivery to CloudWatch Logs is billed at standard CloudWatch Logs rates:
- Ingestion: You pay vended log ingestion rates, which are volume-based and tiered (the per-GB rate decreases at higher monthly volumes). This is the main cost to plan for, and it scales with how many requests your buckets receive. The Infrequent Access log class ingests at a lower cost than the Standard class, but does not support metric filters.
- Storage: CloudWatch Logs compresses logs before storage, so stored volume is significantly less than ingested volume. Storage charges are the same for both classes. Set a retention period on the log group to manage storage cost.
- Querying: CloudWatch Logs Insights charges based on the volume of data scanned per query.
If you enable the S3 Tables integration, S3 Tables storage and table maintenance have no additional charge beyond the CloudWatch Logs ingestion and storage above. When you query the data through Amazon Athena, you pay standard S3 Tables request rates plus the Athena per-query charge for the data scanned (other analytics engines bill their own query rates).
For current rates, see Amazon CloudWatch pricing, Amazon S3 Tables pricing, and Amazon Athena pricing.
Conclusion
In this post, we showed how to deliver S3 server access logs to CloudWatch Logs for instant, structured querying, without building forwarding pipelines, writing parsing logic, or managing ETL infrastructure. We walked through setting up delivery using the S3 console and AWS CLI, creating metric filters and alarms for proactive security monitoring, querying logs with CloudWatch Logs Insights for operational analysis, and running SQL in Amazon Athena against S3 Tables for longer-term analytics like chargeback attribution and cold-data detection.
Whether you need to investigate a single access pattern or build organization-wide observability across thousands of buckets, these capabilities give you a managed path from raw access logs to actionable answers. To get started, see logging requests with server access logging or jump straight to delivering server access logs to CloudWatch Logs for setup steps.