AWS Storage Blog
Monitoring Amazon EFS KPIs using Amazon CloudWatch metrics
Operational excellence isn’t just about efficiency—it’s about delivering consistent availability when customers need it most. Achieving this requires sophisticated, real-time monitoring that tracks key system metrics and storage insights, such as throughput patterns, IOPS utilization, I/O characteristics, and storage distribution. This visibility enables teams to resolve issues proactively, right-size resources, optimize workload placement, and plan for future capacity with confidence. Comprehensive, automated monitoring isn’t just a safeguard—it’s the strategic engine that drives performance, reduces waste, and ensures a seamless experience for both businesses and their customers.
Amazon Elastic File System (Amazon EFS) is a POSIX-compliant file storage service that provides a hands off experience. Amazon EFS offers multiple performance and throughput modes, so that users can select the appropriate option based on their application needs. Amazon CloudWatch is a monitoring and observability service that provides real-time metrics, logs, and alarms for AWS resources. Businesses can use it to gain actionable insights, troubleshoot issues, and automatically respond to system-wide performance changes. CloudWatch provides a centralized monitoring hub that organizations can use to reduce operational overhead while gaining deeper insights into their cloud infrastructure.
Organizations running file system workloads need real-time monitoring into storage and performance metrics to optimize costs and performance. EFS publishes these metrics to Cloudwatch, allowing you to track usage to optimize configurations and avoid overpaying for unused capacity. In this post, we walk through how to set up a CloudWatch dashboard to monitor key performance indicators (KPIs) such as throughput, IOPS, IO size, and storage bytes.
Solution overview
EFS provides comprehensive metrics such as TotalIOBytes, ReadIOBytes, WriteIOBytes, MetadataIOBytes, MetadataReadIOBytes, and MetadataWriteIOBytes, which must be used to manually calculate throughput, IOPS, and I/O size. As infrastructure scales across multiple file systems, accounts, and regions, automating these calculations becomes essential to maintain consistent visibility and operational efficiency. High throughput enables massive data transfers, while low latency ensures quick responses; without robust monitoring, storage bottlenecks or unexpected latency spikes can degrade application performance, trigger timeouts, or frustrate users. Consistent tracking of these metrics allows teams to proactively identify and resolve issues, safeguarding application health and sustaining a reliable, responsive experience for end users.
In this solution, we use an AWS CloudFormation template to simplify the creation of a CloudWatch dashboard that automatically calculates Amazon EFS throughput, IOPS and IOsize.
This dashboard creates the following metrics:
- Total throughput: The average amount of data and metadata transferred between EFS file system and the EFS clients. It provides a breakdown of read throughput, write throughput, and metadata throughput.
- Total IOPS: The average number of read, write, and metadata operations transferred between EFS file system and the EFS clients. It provides a breakdown of read IOPS, write IOPS, and metadata IOPS.
- IO size: The average size of an I/O operation that is transferred between EFS file system and the EFS clients.
- Client connections: The number of client connections to a file system.
- Storage bytes: The size of the file system in bytes, including the amount of data stored in EFS storage classes. Storage bytes are emitted to CloudWatch every 15 minutes.
Prerequisites
For this solution, you need to set up an AWS account with sufficient permission to access CloudWatch and CloudFormation. When using CloudFormation, it automatically creates an AWS Identity and Access Management (IAM) role while creating the CloudWatch dashboard. For this walkthrough, we created a general purpose EFS file system in elastic throughput mode with Regional availability.
Walkthrough
To create the Cloudwatch dashboard for EFS with the CloudFormation template, you must implement the following steps:
Step 1: Log in to the Console and navigate to CloudFormation
- Log in to the AWS Management Console.
- Change the region using Region selector in the upper-right corner of the page.
Step 2: Create a new CloudFormation stack
- Choose this template to load the stack directly from Amazon S3.
- On the Create stack page in the CloudFormation console, choose Next to proceed.
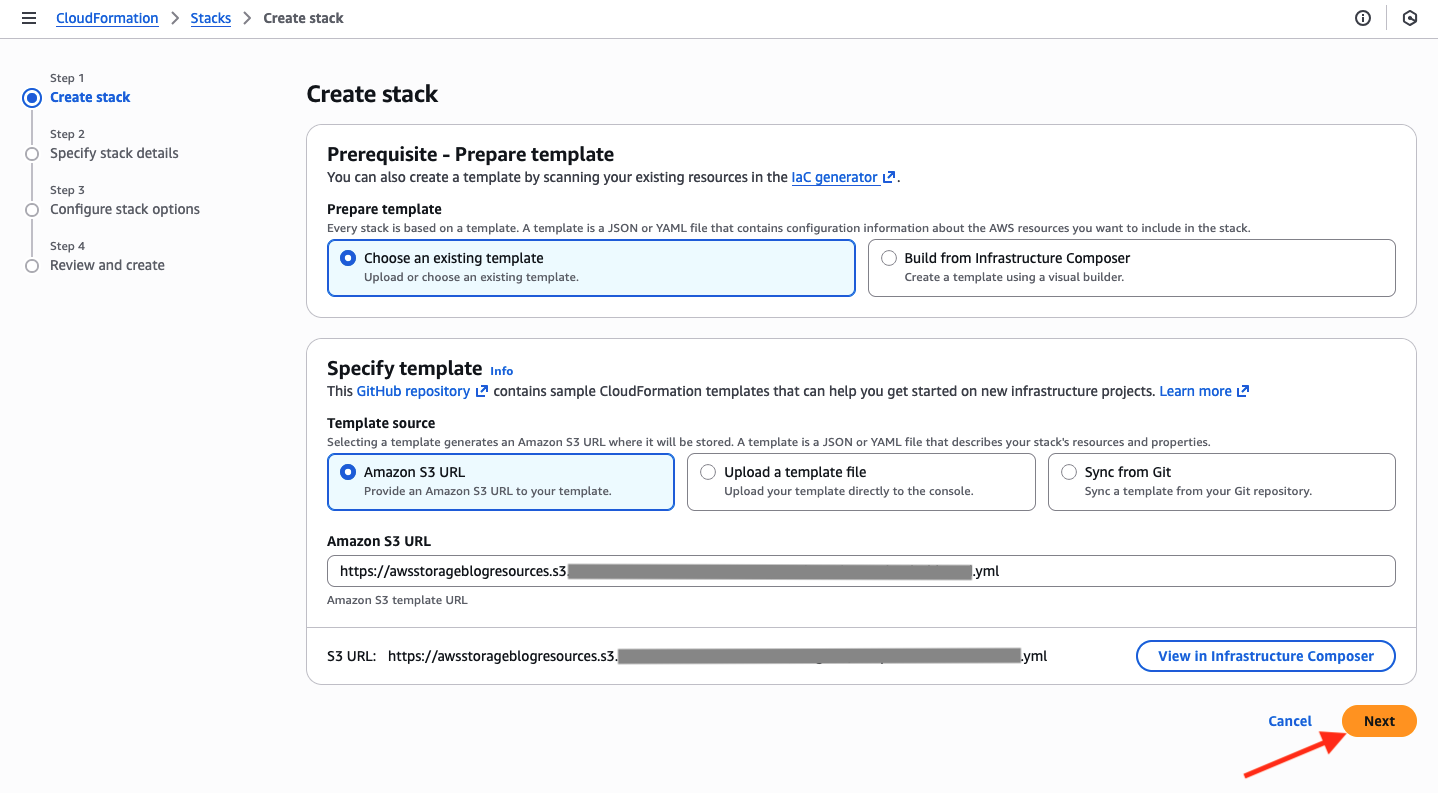
Figure 1: Creating CloudFormation stack using the template
Step 3: Configure CloudFormation stack parameters with EFS file system ID
- On the Specify stack details page, type a stack name in the Stack name box. In this example, efs-cloudwatch is the name of the stack.
- In the Parameters section, provide a unique CloudWatch dashboard name under DashboardName, your desired deletion preference under DeletionPolicy, and the Amazon EFS file system ID under FileSystemId.
- Choose Next to continue creating the stack.
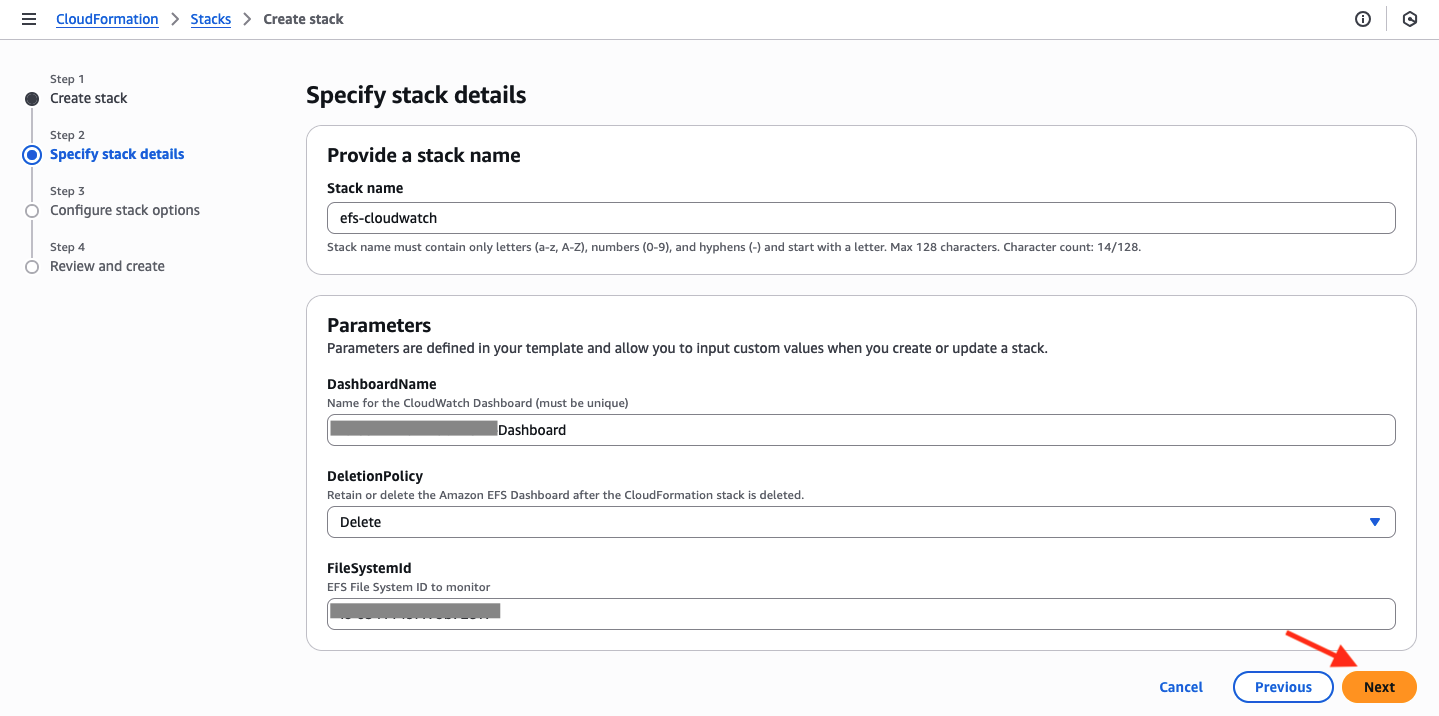
Figure 2: Providing stack name, dashboard name and the EFS file system ID
- On the Configure stack options page, change the default stack options as necessary. If you have an existing IAM role with sufficient permissions to create the CloudWatch dashboard for the Amazon EFS file system ID, then choose that from the IAM role name dropdown.
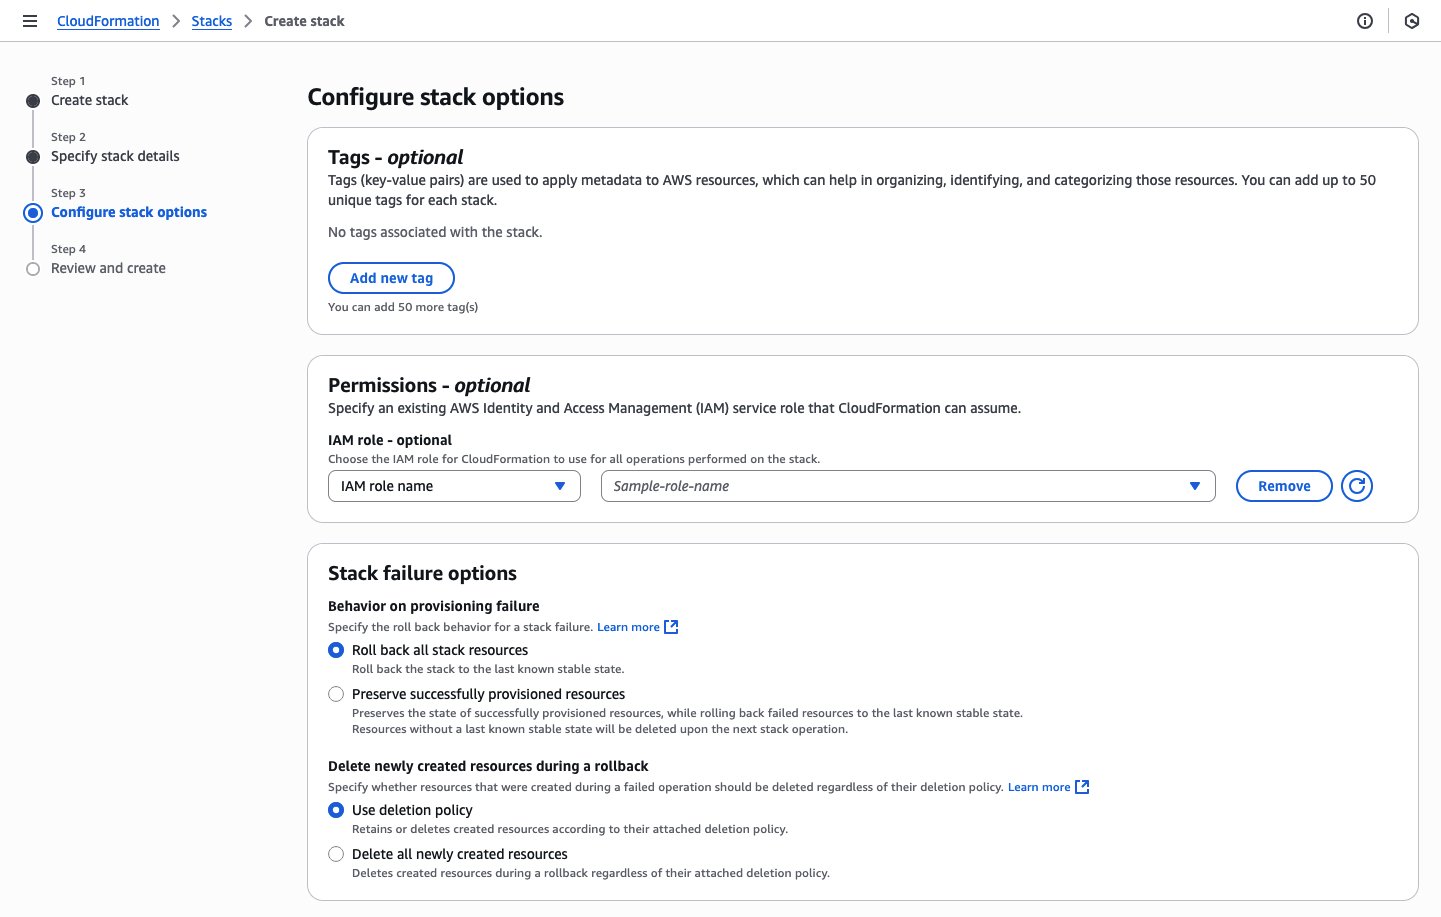
Figure 3: Configuring CloudFormation stack options
- Under Capabilities, choose I acknowledge that this template may create IAM resources to specify that you want to use IAM resources in the template. In this example, we have kept the default options.
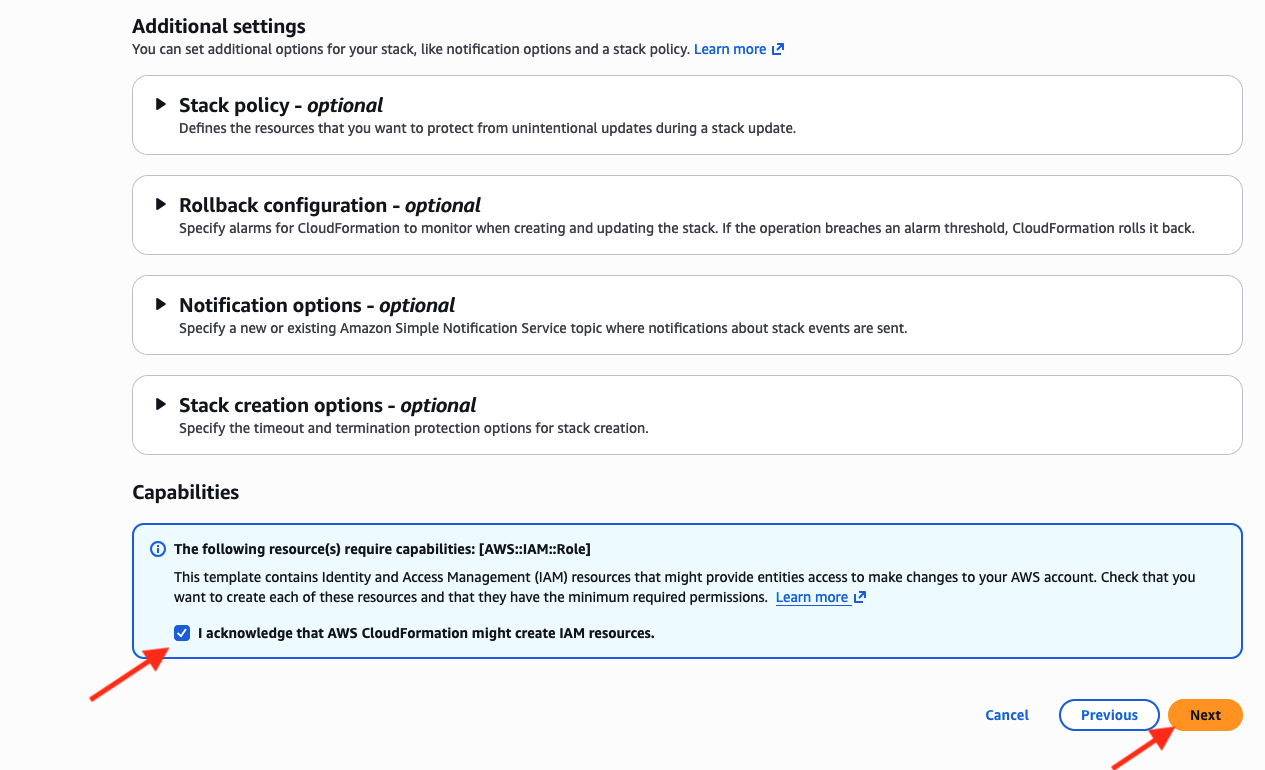
Figure 4: Acknowledging IAM resource creation
Step 4: Review and launch CloudFormation stack
- On the Review and create page, review that the correct EFS file system ID is provided along with the correct IAM role.
- After you review the stack creation settings, choose Submit to launch your stack.
- While your stack is being created, it’s listed on the Stacks page with a status of CREATE_IN_PROGRESS.
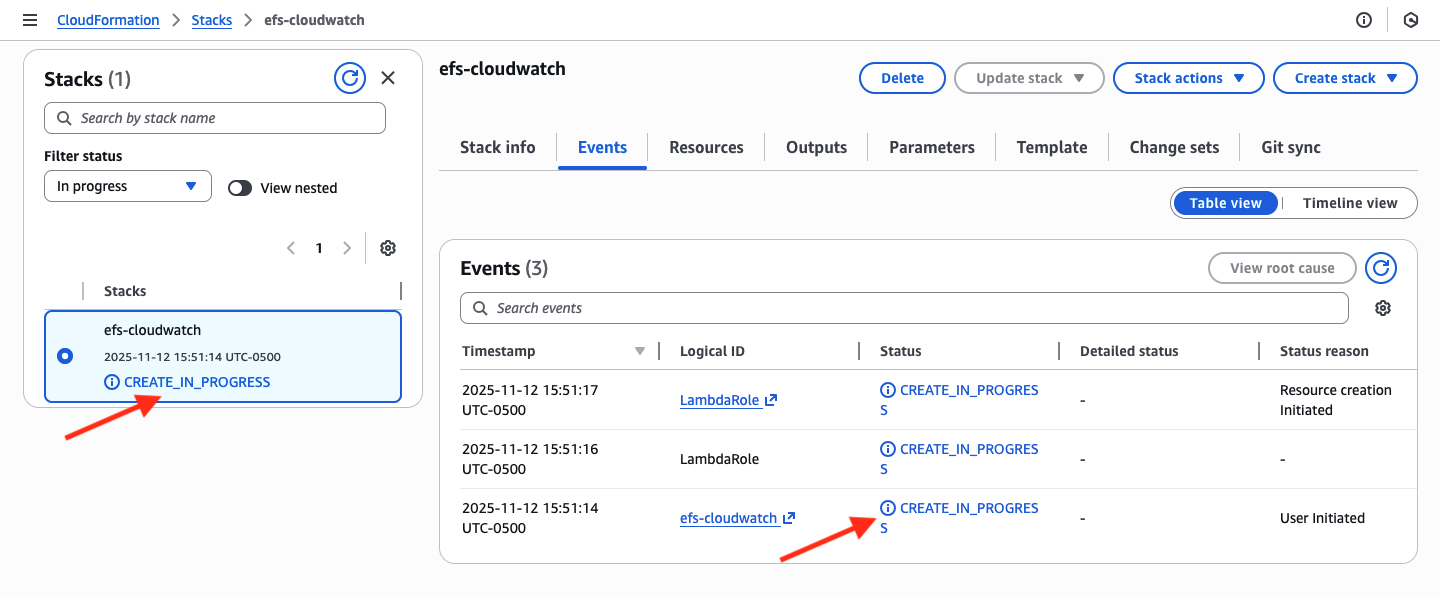
Figure 5: Tracking the progress of CloudFormation stack creation
- After your stack has been successfully created, its status changes to CREATE_COMPLETE.
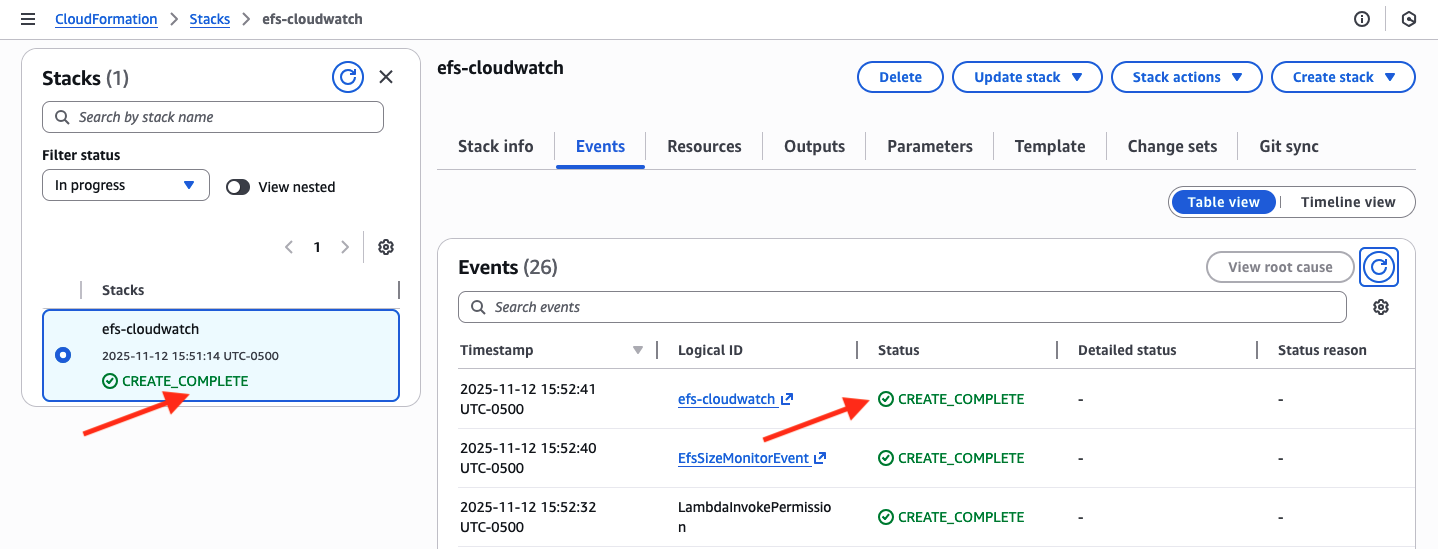
Figure 6: CloudFormation stack successfully created
Step 5: View newly created EFS dashboard from the CloudWatch console
- Navigate to the CloudWatch console and choose Dashboards in the left-hand navigation panel.
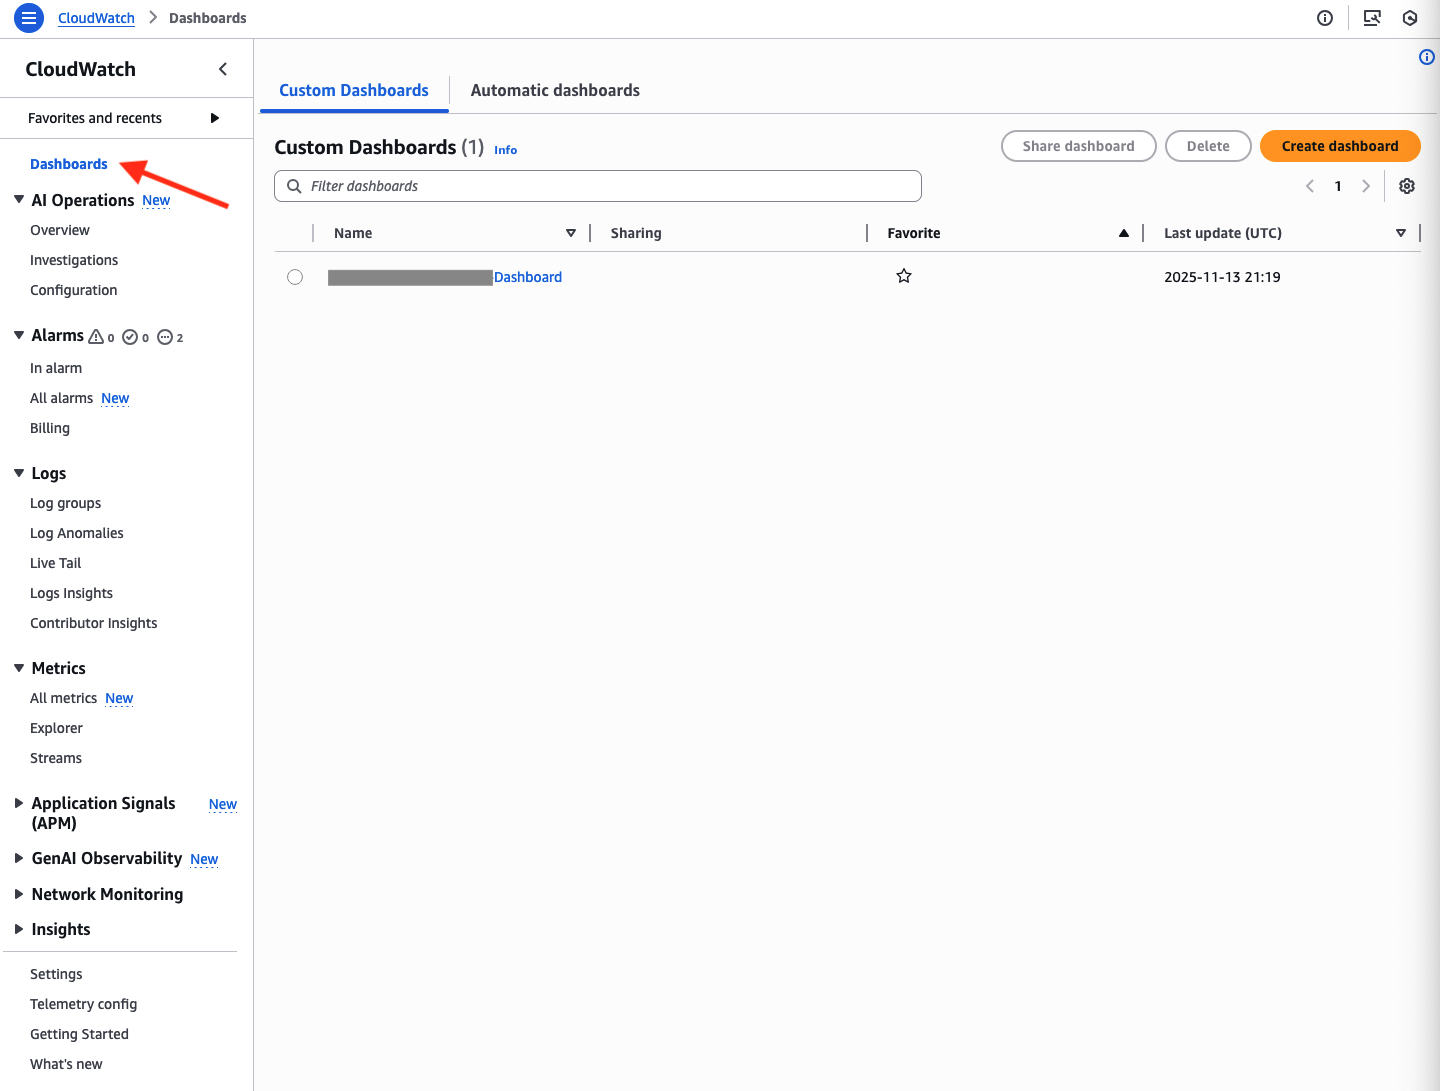
Figure 7: CloudWatch Dashboard page
- View the Amazon EFS file system metrics.
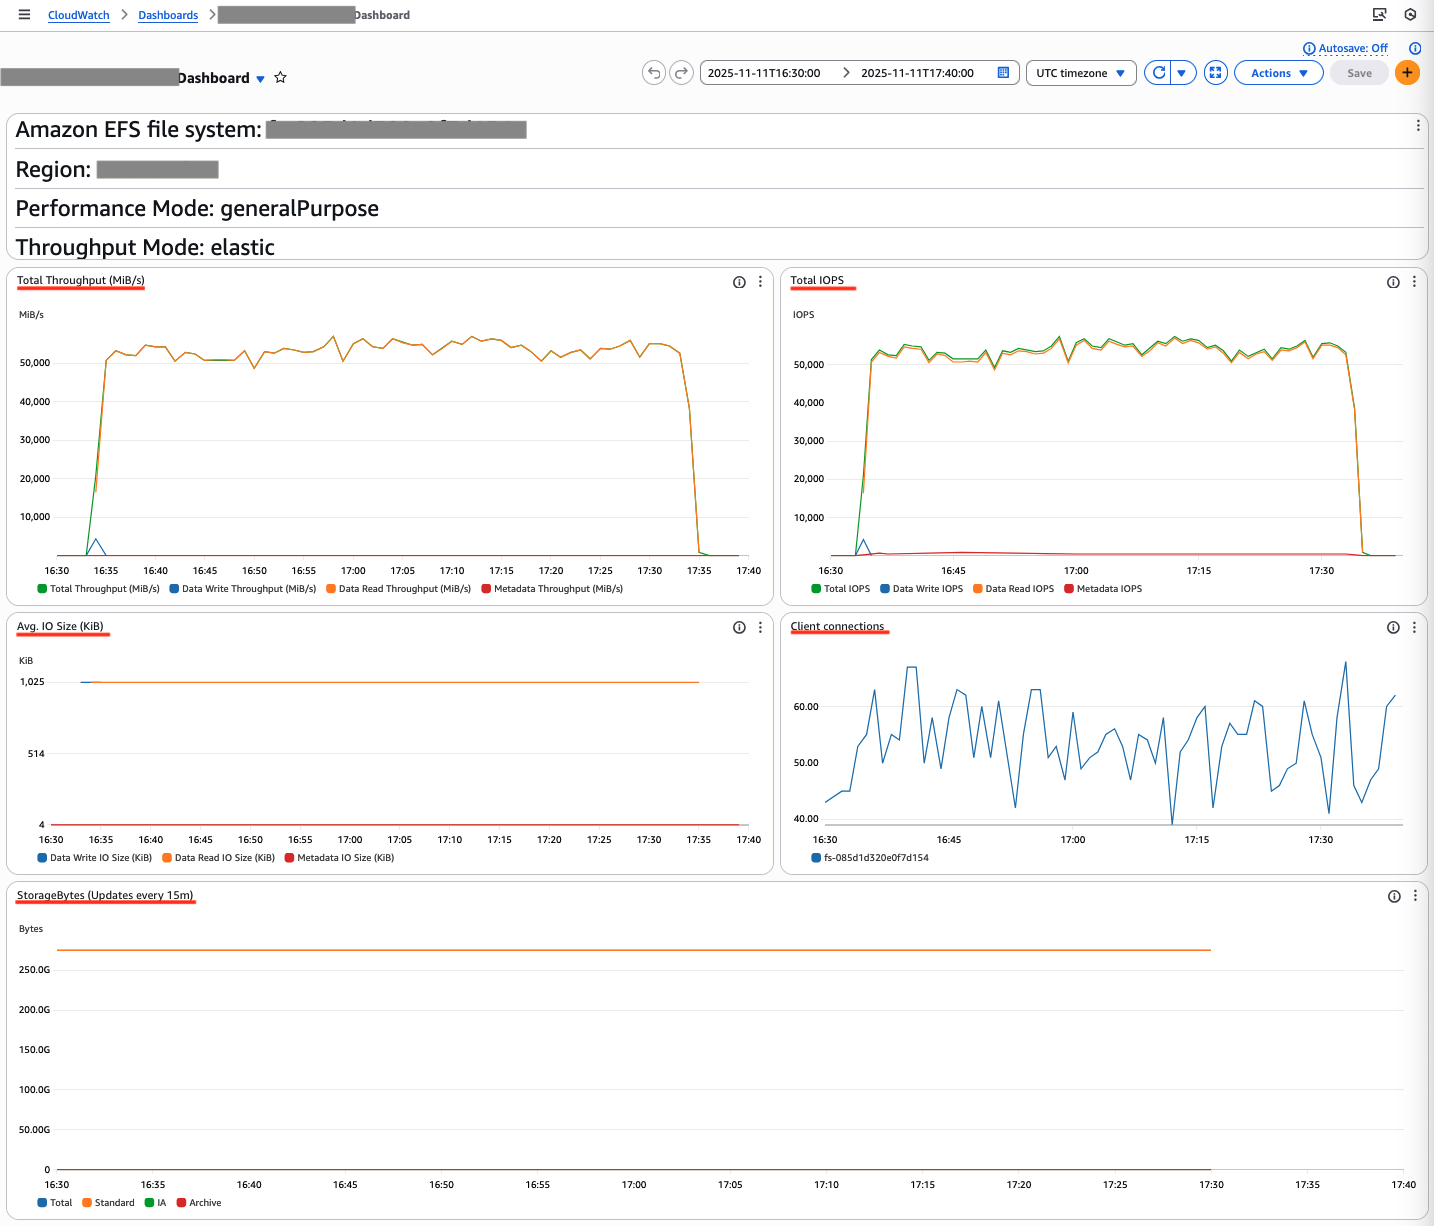
Figure 8: Monitoring Amazon EFS performance and storage metric
The dashboard shows a throughput of 55,000 MiB/s and 55,000 IOPS, with an average IO size of 1024 KiB. These metrics demonstrate the EFS KPIs and show how the application uses EFS performance. The StorageBytes data displays a breakdown of three storage classes: Standard, Infrequent Access, and Archive, providing clear visibility into your EFS lifecycle management.
Cleaning up
If you no longer need this solution, delete the CloudFormation stack and CloudWatch dashboard. You can delete the CloudFormation stack by following instructions in the documentation.
Conclusion
This solution automates the EFS and CloudWatch dashboard creation through CloudFormation, displaying essential performance metrics for your file systems. The consolidated dashboard streamlines monitoring of IOPS, throughput, and storage consumption. This automated approach provides immediate visibility into EFS performance and establishes a foundation for proactive file system management.