AWS Big Data Blog
Manage Query Workloads with Query Monitoring Rules in Amazon Redshift
This blog post has been translated into Japanese and Chinese.
Data warehousing workloads are known for high variability due to seasonality, potentially expensive exploratory queries, and the varying skill levels of SQL developers.
To obtain high performance in the face of highly variable workloads, Amazon Redshift workload management (WLM) enables you to flexibly manage priorities and resource usage. With WLM, short, fast-running queries don’t get stuck in queues behind long-running queries. In spite of this, a query can sometimes corner a disproportionate share of resources, penalizing other queries in the system. Such queries are commonly known as rogue or runaway queries.
While WLM provides a method to restrict memory use and moving queries to other queues using a timeout, many times granular control is desirable. You can now use query monitoring rules to create resource usage rules for queries, monitor a query’s resource use, and then perform actions if a query violates a rule.
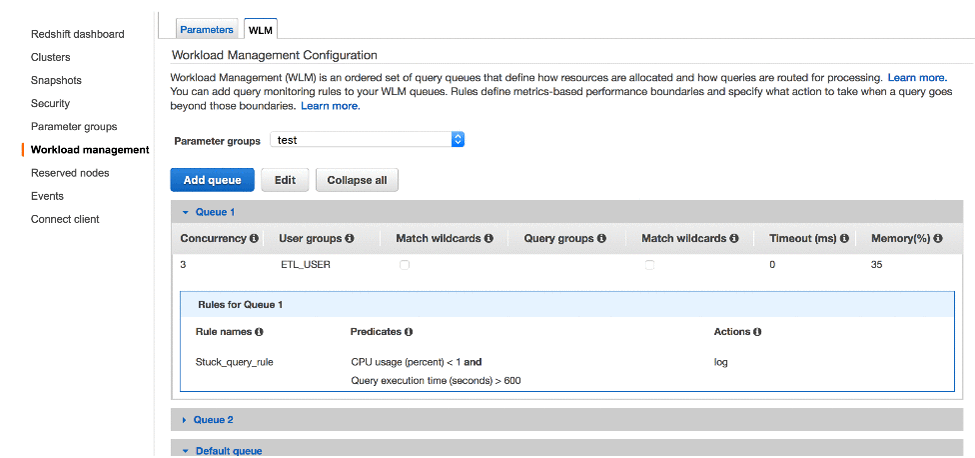
Workload management concurrency and query monitoring rules
In an Amazon Redshift environment, there are a maximum of 500 simultaneous connections to a single cluster. Throughput is usually expressed as queries per hour to maximize performance, while row databases like MySQL use concurrent connections to scale. In Amazon Redshift, workload management (WLM) maximizes throughput irrespective of concurrency. There are two main parts to WLM: queues and concurrency. Queues allow you to allocate memory at a user group or a query group level. Concurrency or memory slots is how you further subdivide and allocate memory to a query.
For example, assume that you have one queue (100% memory allocation) with a concurrency of 10. This means that each query gets a maximum of 10% memory. If the majority of your queries need 20% memory, then these queries are swapping to disk, causing a lower throughput. However, if you lower the concurrency to 5, each query is assigned 20% memory and the net result is higher throughput and overall faster response time to SQL clients. When switching from a row database to column-oriented, it is a common pitfall to assume that higher concurrency leads to better performance.
Now that you understand concurrency, here are more details about query monitoring rules. You define a rule based on resource usage and a corresponding action to take if a query violates that rule. Twelve different resource usage metrics are available, such as a query’s use of CPU, query execution time, rows scanned, rows returned, nested loop join, and so on.
Each rule includes up to three conditions, or predicates, and one action. A predicate consists of a metric, a comparison condition (=, <, or > ), and a value. If all of the predicates for any rule are met, that rule’s action is triggered. Possible rule actions are log, hop, and abort.
This allows you to catch a rogue or runaway query long before it causes severe problems. The rule triggers an action to free up the queue, and in turn improve throughput and responsiveness.
For example, for a queue that’s dedicated to short-running queries, you might create a rule aborting queries that run for more than 60 seconds. To track poorly designed queries, you might have another rule logging queries that contain nested loops. There are predefined rule templates in the Amazon Redshift console to get you started.
Scenarios
Use query monitoring rules to perform query level actions ranging from simply logging the query to aborting it. All of the actions taken are logged in the STL_WLM_RULE_ACTION table.
- The Log action logs the information and continue to monitor the query.
- The Hop action terminate the query, and restart it the next matching queue. If there is not another matching queue, the query is canceled.
- The Abort action aborts rule-violating queries.
The following three sample scenarios show how to use query monitoring rules.
Scenario 1: How to govern a suboptimal query in your ad hoc queue?
A runaway query that joins two large tables could return a billion or more rows. You can protect your ad hoc queue by creating a rule to abort any queries that return more than billion rows. Logically, this would look like the following:
In the following screenshot, any query returning more than a billion rows in the BI_USER group is aborted.

Scenario 2: How to manage and govern a suboptimal, CPU-intensive query?
Queries that cause a CPU spike are not necessarily a concern. However, a query with high CPU usage combined with long query execution times can cause increased latency for other concurrently running queries. For example, a suboptimal query using a high percentage of CPU for an extended period of time could be due to incorrect nested joins.
You can increase cluster throughput and responsiveness by creating a rule to abort any query that uses 80% or more CPU for more than 10 minutes. Logically, this would look like the following:
In the following screenshot, any query using more than 80% CPU for over 10 minutes is aborted.

You can further extend this rule by logging queries using 80% CPU for more than 5 mins and aborting queries using 80% CPU for more than 10 mins. Logically, this would look like the following:
In the following screenshot, a query using 80% CPU and running for over 5 minutes is logged, while a query using 80% CPU and running for over 10 minutes is aborted.

Scenario 3: How to monitor and log the queries that are not making any progress?
For example, in a mixed workload environment, an ETL job might be ingesting large volumes of data from S3 into Amazon Redshift. During the data ingestion, you might find a COPY command that is stuck in the queue and not making any progress. Such queries can increase data ingestion latency and also impact business SLAs.
You can find such queries by creating a rule to track and log queries. Create a rule to find queries with low CPU utilization and extended query execution run times, for example, a rule to log a query using 1% CPU for more than 10 mins. Logically, this would look like the following:
In the following screenshot, a query using 1% CPU and running for over 10 minutes is logged.
Summary
Amazon Redshift is a powerful, fully managed data warehouse that can offer significantly increased performance and lower cost in the cloud. However, queries which hog cluster resources (rogue queries) can affect your experience.
In this post, we discussed how query monitoring rules can help spot and act against such queries. This, in turn, can help you to perform smooth business operations in supporting mixed workloads to maximize cluster performance and throughput.
If you have questions or suggestions, please leave a comment below.
About the Author
 Gaurav Saxena is a software engineer on the Amazon Redshift query processing team. He works on several aspects of workload management and performance improvements for Amazon Redshift. In his spare time, he loves to play games on his PlayStation.
 Suresh Akena is a Senior Big Data/IT Transformation Architect for AWS Professional Services. He works with the enterprise customers to provide leadership on large scale data strategies including migration to AWS platform, big data and analytics projects and help them to optimize and improve time to market for data driven applications when using AWS. In his spare time, he likes to play with his 8 and 3 year old daughters and watch movies.
Related
Amazon Redshift Monitoring Now Supports End User Queries and Canaries