AWS Big Data Blog
Power data ingestion into Splunk using Amazon Data Firehose
February 9, 2024: Amazon Kinesis Data Firehose has been renamed to Amazon Data Firehose. Read the AWS What’s New post to learn more.
In late September, during the annual Splunk .conf, Splunk and Amazon Web Services (AWS) jointly announced that Amazon Data Firehose now supports Splunk Enterprise and Splunk Cloud as a delivery destination. This native integration between Splunk Enterprise, Splunk Cloud, and Amazon Data Firehose is designed to make AWS data ingestion setup seamless, while offering a secure and fault-tolerant delivery mechanism. We want to enable customers to monitor and analyze machine data from any source and use it to deliver operational intelligence and optimize IT, security, and business performance.
With Amazon Data Firehose, customers can use a fully managed, reliable, and scalable data streaming solution to Splunk. In this post, we tell you a bit more about the Data Firehose and Splunk integration. We also show you how to ingest large amounts of data into Splunk using Data Firehose.
Push vs. Pull data ingestion
Presently, customers use a combination of two ingestion patterns, primarily based on data source and volume, in addition to existing company infrastructure and expertise:
- Pull-based approach: Using dedicated pollers running the popular Splunk Add-on for AWS to pull data from various AWS services such as Amazon CloudWatch or Amazon S3.
- Push-based approach: Streaming data directly from AWS to Splunk HTTP Event Collector (HEC) by using AWS Lambda. Examples of applicable data sources include CloudWatch Logs and Amazon Kinesis Data Streams.
The pull-based approach offers data delivery guarantees such as retries and checkpointing out of the box. However, it requires more ops to manage and orchestrate the dedicated pollers, which are commonly running on Amazon EC2 instances. With this setup, you pay for the infrastructure even when it’s idle.
On the other hand, the push-based approach offers a low-latency scalable data pipeline made up of serverless resources like AWS Lambda sending directly to Splunk indexers (by using Splunk HEC). This approach translates into lower operational complexity and cost. However, if you need guaranteed data delivery then you have to design your solution to handle issues such as a Splunk connection failure or Lambda execution failure. To do so, you might use, for example, AWS Lambda Dead Letter Queues.
How about getting the best of both worlds?
Let’s go over the new integration’s end-to-end solution and examine how Data Firehose and Splunk together expand the push-based approach into a native AWS solution for applicable data sources.
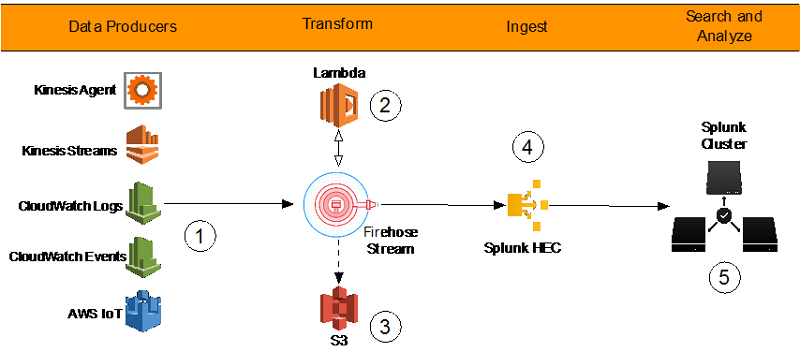
By using a managed service like Data Firehose for data ingestion into Splunk, we provide out-of-the-box reliability and scalability. One of the pain points of the old approach was the overhead of managing the data collection nodes (Splunk heavy forwarders). With the new Data Firehose to Splunk integration, there are no forwarders to manage or set up. Data producers (1) are configured through the AWS Management Console to drop data into Data Firehose.
You can also create your own data producers. For example, you can drop data into a Firehose delivery stream by using Amazon Kinesis Agent, or by using the Firehose API (PutRecord(), PutRecordBatch()), or by writing to a Kinesis Data Stream configured to be the data source of a Firehose delivery stream. For more details, refer to Sending Data to an Amazon Data Firehose Delivery Stream.
You might need to transform the data before it goes into Splunk for analysis. For example, you might want to enrich it or filter or anonymize sensitive data. You can do so using AWS Lambda. In this scenario, Data Firehose buffers data from the incoming source data, sends it to the specified Lambda function (2), and then rebuffers the transformed data to the Splunk Cluster. Data Firehose provides the Lambda blueprints that you can use to create a Lambda function for data transformation.
Systems fail all the time. Let’s see how this integration handles outside failures to guarantee data durability. In cases when Data Firehose can’t deliver data to the Splunk Cluster, data is automatically backed up to an S3 bucket. You can configure this feature while creating the Firehose delivery stream (3). You can choose to back up all data or only the data that’s failed during delivery to Splunk.
In addition to using S3 for data backup, this Firehose integration with Splunk supports Splunk Indexer Acknowledgments to guarantee event delivery. This feature is configured on Splunk’s HTTP Event Collector (HEC) (4). It ensures that HEC returns an acknowledgment to Data Firehose only after data has been indexed and is available in the Splunk cluster (5).
Now let’s look at a hands-on exercise that shows how to forward VPC flow logs to Splunk.
How-to guide
To process VPC flow logs, we implement the following architecture.
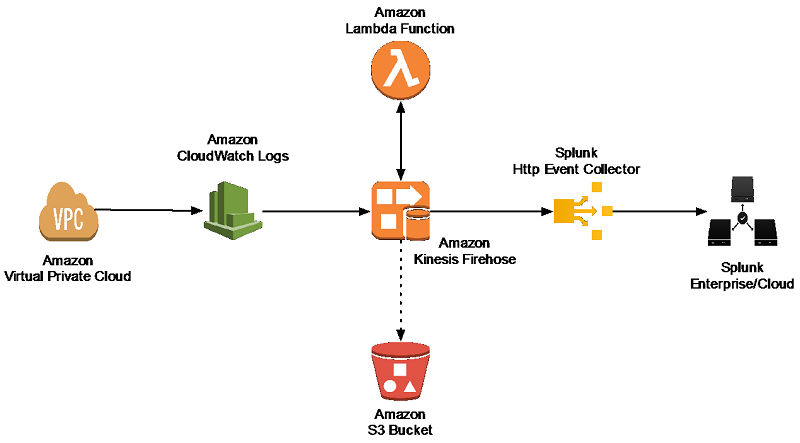
Amazon Virtual Private Cloud (Amazon VPC) delivers flow log files into an Amazon CloudWatch Logs group. Using a CloudWatch Logs subscription filter, we set up real-time delivery of CloudWatch Logs to a Data Firehose stream.
Data coming from CloudWatch Logs is compressed with gzip compression. To work with this compression, we need to configure a Lambda-based data transformation in Data Firehose to decompress the data and deposit it back into the stream. Firehose then delivers the raw logs to the Splunk Http Event Collector (HEC).
If delivery to the Splunk HEC fails, Firehose deposits the logs into an Amazon S3 bucket. You can then ingest the events from S3 using an alternate mechanism such as a Lambda function.
When data reaches Splunk (Enterprise or Cloud), Splunk parsing configurations (packaged in the Splunk Add-on for Data Firehose) extract and parse all fields. They make data ready for querying and visualization using Splunk Enterprise and Splunk Cloud.
Walkthrough
Install the Splunk Add-on for Amazon Data Firehose
The Splunk Add-on for Amazon Data Firehose enables Splunk (be it Splunk Enterprise, Splunk App for AWS, or Splunk Enterprise Security) to use data ingested from Amazon Data Firehose. Install the Add-on on all the indexers with an HTTP Event Collector (HEC). The Add-on is available for download from Splunkbase.
HTTP Event Collector (HEC)
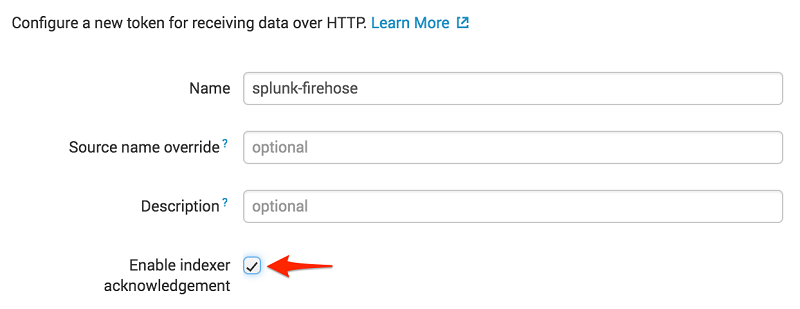
Before you can use Data Firehose to deliver data to Splunk, set up the Splunk HEC to receive the data. From Splunk web, go to the Setting menu, choose Data Inputs, and choose HTTP Event Collector. Choose Global Settings, ensure All tokens is enabled, and then choose Save. Then choose New Token to create a new HEC endpoint and token. When you create a new token, make sure that Enable indexer acknowledgment is checked.
When prompted to select a source type, select aws:cloudwatch:vpcflow.

Create an S3 backsplash bucket
To provide for situations in which Data Firehose can’t deliver data to the Splunk Cluster, we use an S3 bucket to back up the data. You can configure this feature to back up all data or only the data that’s failed during delivery to Splunk.
Note: Bucket names are unique. Thus, you can’t use tmak-backsplash-bucket.
Create an IAM role for the Lambda transform function
Firehose triggers an AWS Lambda function that transforms the data in the delivery stream. Let’s first create a role for the Lambda function called LambdaBasicRole.
Note: You can also set this role up when creating your Lambda function.
Here is TrustPolicyForLambda.json.
After the role is created, attach the managed Lambda basic execution policy to it.
Create a Firehose Stream
On the AWS console, open the Amazon Data Firehose console, and choose Create Delivery Stream.

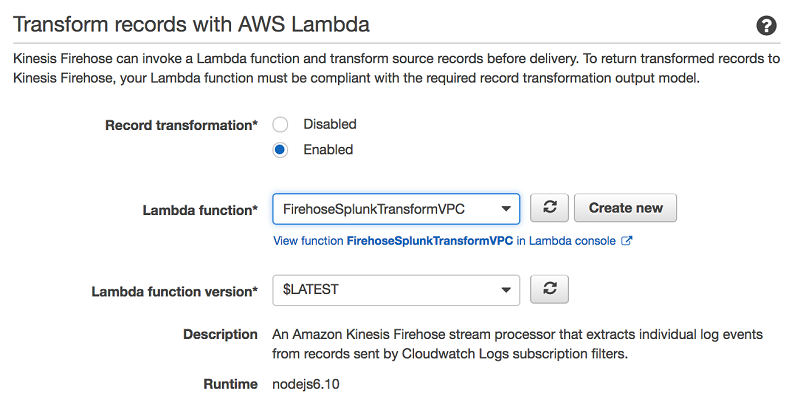
In the next section, you can specify whether you want to use an inline Lambda function for transformation. Because incoming CloudWatch Logs are gzip compressed, choose Enabled for Record transformation, and then choose Create new.

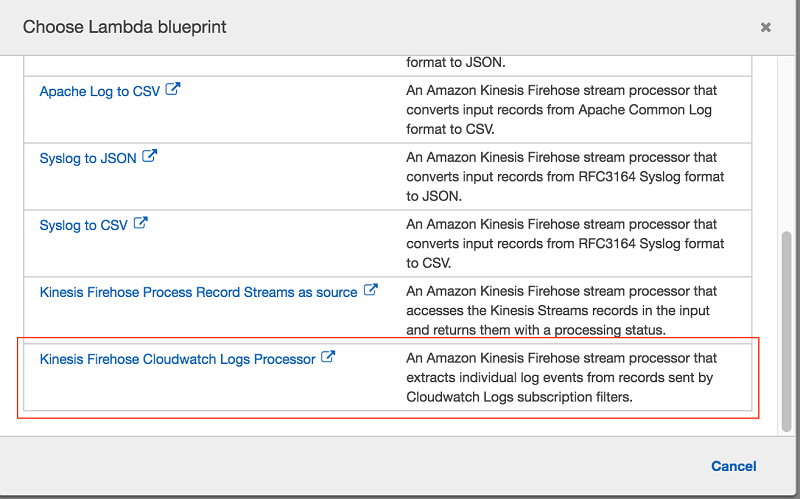
From the list of the available blueprint functions, choose Data Firehose CloudWatch Logs Processor. This function unzips data and place it back into the Firehose stream in compliance with the record transformation output model.
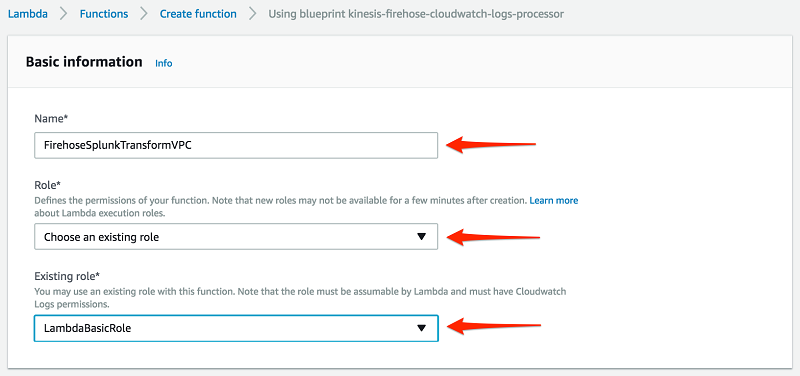
Enter a name for the Lambda function, choose Choose an existing role, and then choose the role you created earlier. Then choose Create Function.
Go back to the Firehose Stream wizard, choose the Lambda function you just created, and then choose Next.
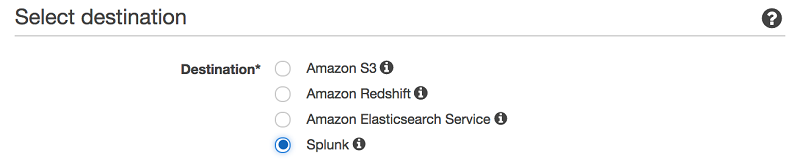
Select Splunk as the destination, and enter your Splunk Http Event Collector information.
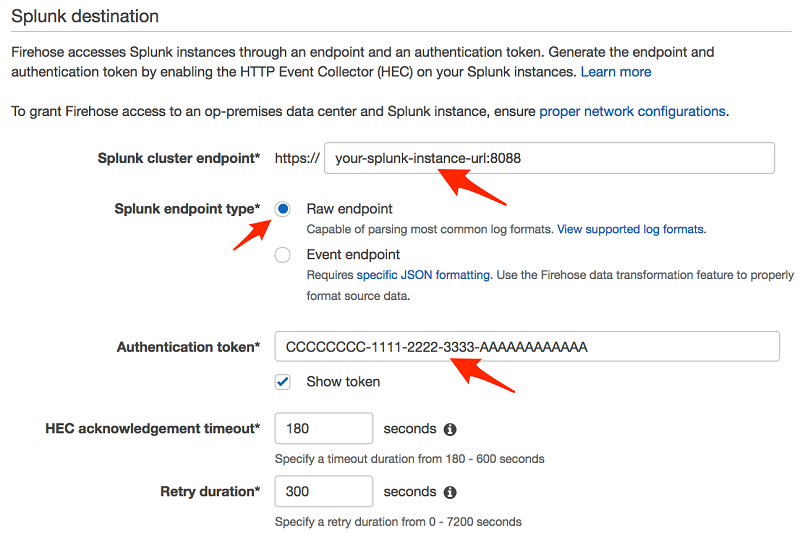
Note: Amazon Data Firehose requires the Splunk HTTP Event Collector (HEC) endpoint to be terminated with a valid CA-signed certificate matching the DNS hostname used to connect to your HEC endpoint. You receive delivery errors if you are using a self-signed certificate.
In this example, we only back up logs that fail during delivery.
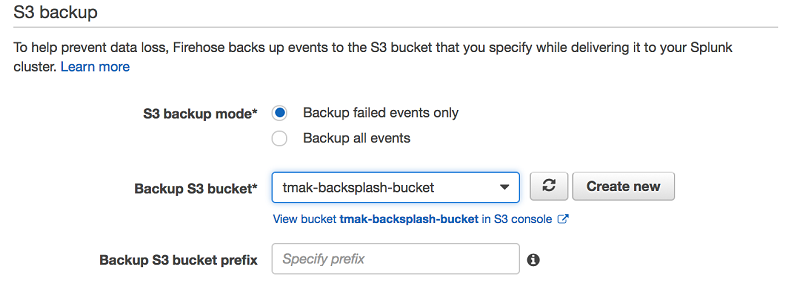
To monitor your Firehose delivery stream, enable error logging. Doing this means that you can monitor record delivery errors.

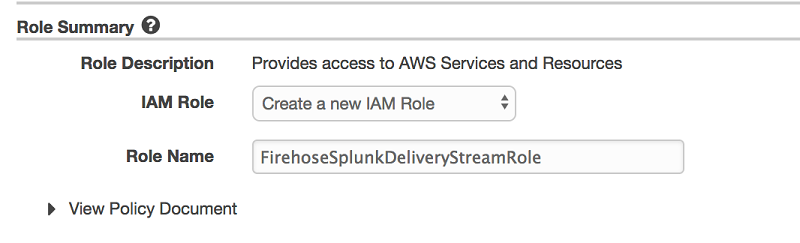
Create an IAM role for the Firehose stream by choosing Create new, or Choose. Doing this brings you to a new screen. Choose Create a new IAM role, give the role a name, and then choose Allow.
If you look at the policy document, you can see that the role gives Data Firehose permission to publish error logs to CloudWatch, execute your Lambda function, and put records into your S3 backup bucket.
You now get a chance to review and adjust the Firehose stream settings. When you are satisfied, choose Create Stream. You get a confirmation once the stream is created and active.

Create a VPC Flow Log
To send events from Amazon VPC, you need to set up a VPC flow log. If you already have a VPC flow log you want to use, you can skip to the “Publish CloudWatch to Data Firehose” section.
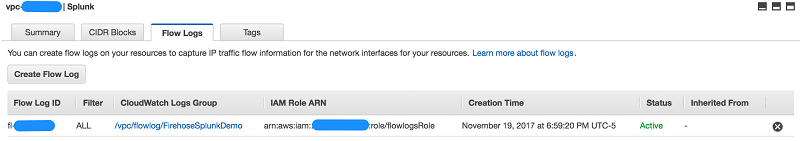
On the AWS console, open the Amazon VPC service. Then choose VPC, Your VPC, and choose the VPC you want to send flow logs from. Choose Flow Logs, and then choose Create Flow Log. If you don’t have an IAM role that allows your VPC to publish logs to CloudWatch, choose Set Up Permissions and Create new role. Use the defaults when presented with the screen to create the new IAM role.

Once active, your VPC flow log should look like the following.
Publish CloudWatch to Data Firehose
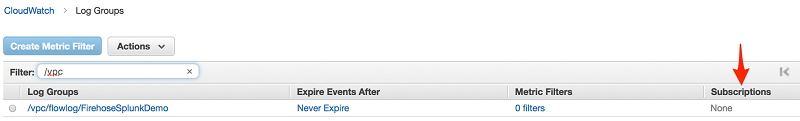
When you generate traffic to or from your VPC, the log group is created in Amazon CloudWatch. The new log group has no subscription filter, so set up a subscription filter. Setting this up establishes a real-time data feed from the log group to your Firehose delivery stream.
At present, you have to use the AWS Command Line Interface (AWS CLI) to create a CloudWatch Logs subscription to a Data Firehose stream. However, you can use the AWS console to create subscriptions to Lambda and Amazon OpenSearch Service.
To allow CloudWatch to publish to your Firehose stream, you need to give it permissions.
Here is the content for TrustPolicyForCWLToFireHose.json.
Attach the policy to the newly created role.
Here is the content for PermissionPolicyForCWLToFireHose.json.
Finally, create a subscription filter.
When you run the AWS CLI command preceding, you don’t get any acknowledgment. To validate that your CloudWatch Log Group is subscribed to your Firehose stream, check the CloudWatch console.
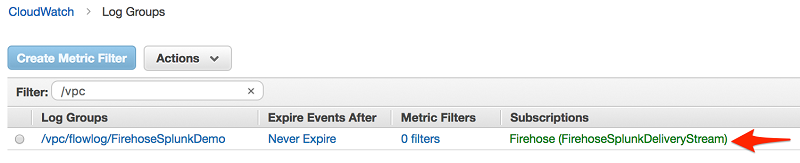
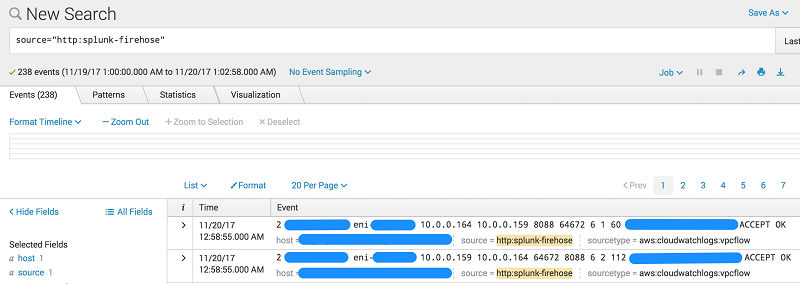
As soon as the subscription filter is created, the real-time log data from the log group goes into your Firehose delivery stream. Your stream then delivers it to your Splunk Enterprise or Splunk Cloud environment for querying and visualization. The screenshot following is from Splunk Enterprise.
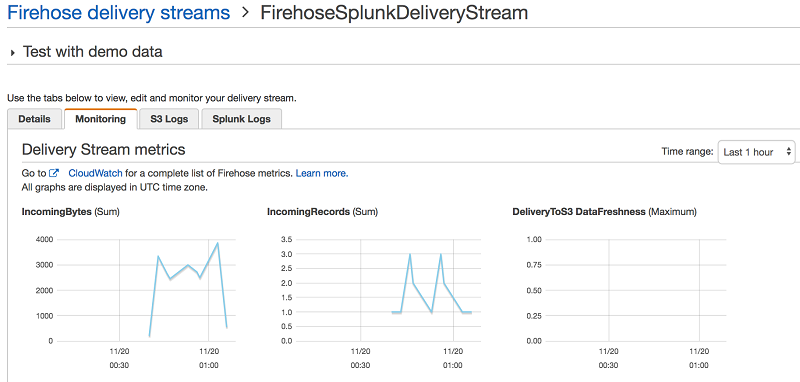
In addition, you can monitor and view metrics associated with your delivery stream using the AWS console.
Conclusion
Although our walkthrough uses VPC Flow Logs, the pattern can be used in many other scenarios. These include ingesting data from AWS IoT, other CloudWatch logs and events, Kinesis Streams or other data sources using the Kinesis Agent or Kinesis Producer Library. We also used Lambda blueprint Data Firehose CloudWatch Logs Processor to transform streaming records from Data Firehose. However, you might need to use a different Lambda blueprint or disable record transformation entirely depending on your use case. For an additional use case using Data Firehose, check out This is My Architecture Video, which discusses how to securely centralize cross-account data analytics using Kinesis and Splunk.
Additional Reading
If you found this post useful, be sure to check out Integrating Splunk with Amazon Kinesis Streams and Using Amazon EMR and Hunk for Rapid Response Log Analysis and Review.

About the Authors

Tarik Makota is a solutions architect with the Amazon Web Services Partner Network. He provides technical guidance, design advice and thought leadership to AWS’ most strategic software partners. His career includes work in an extremely broad software development and architecture roles across ERP, financial printing, benefit delivery and administration and financial services. He holds an M.S. in Software Development and Management from Rochester Institute of Technology.
 Roy Arsan is a solutions architect in the Splunk Partner Integrations team. He has a background in product development, cloud architecture, and building consumer and enterprise cloud applications. More recently, he has architected Splunk solutions on major cloud providers, including an AWS Quick Start for Splunk that enables AWS users to easily deploy distributed Splunk Enterprise straight from their AWS console. He’s also the co-author of the AWS Lambda blueprints for Splunk. He holds an M.S. in Computer Science Engineering from the University of Michigan.