AWS 기술 블로그
Part 3: Kiro로 RDS/Aurora 장애 분석 자동화하기 — 매일 자동으로 보고서 받기
이 글은 “Kiro로 RDS/Aurora 장애 분석 자동화하기” 시리즈의 세 번째 글입니다.
Part 1: “Kiro로 RDS/Aurora 장애 분석 자동화하기 — IDE에서 분석하기”
Part 2: “Kiro로 RDS/Aurora 장애 분석 자동화하기 — 터미널에서 분석하기”
Part 3 (해당글): “Kiro로 RDS/Aurora 장애 분석 자동화하기 — 매일 자동으로 보고서 받기”
이 시리즈에서 구성하는 자동화 솔루션은 편의상 KIDA(Kiro Database Analyzer)라고 부릅니다. 이 시리즈에서는 Kiro, Steering, Hook, MCP 서버를 조합해 구성한 활용 예시입니다. 시리즈는 총 3부로 구성됩니다.
이 편에서 다루는 것
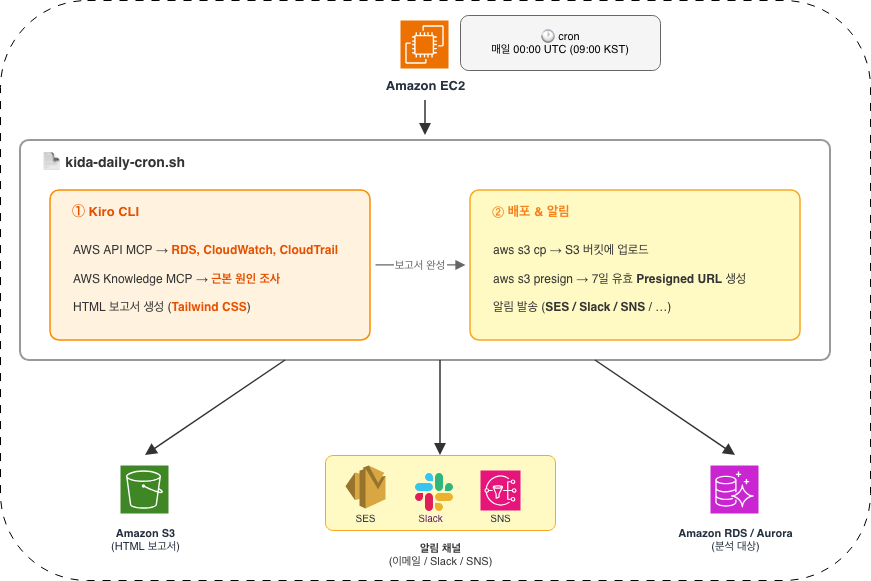
Part 2에서 Kiro CLI의 --no-interactive 모드를 소개했습니다. 이 모드를 Amazon EC2 + cron과 조합하면 매일 아침 자동으로 Amazon RDS/Amazon Aurora 점검 보고서를 생성하고, 이메일이나 Slack으로 보고서 링크를 받을 수 있습니다.
이 글에서는 Amazon EC2 인스턴스 구성부터 알림 채널별 설정까지 전체 모니터링 파이프라인을 단계별로 안내합니다. 각 단계의 실제 구현 결과로 Amazon SES 이메일 발송 화면과 Slack 알림 수신 결과도 함께 공유합니다. 마지막으로 전체 구성을 한 번에 배포할 수 있는 자동화 스크립트를 제공하며, 실행 환경에 따라 일부 수정이 필요할 수 있습니다.
아키텍처
사전 준비
Step 1: IAM Role (KidaEC2Role)에 필요한 권한 설정
{
  "Version": "2012-10-17",
  "Statement": [
    {
      "Sid": "RDSReadOnly",
      "Effect": "Allow",
      "Action": ["rds:Describe*", "rds:ListTagsForResource", "pi:GetResourceMetrics", "pi:DescribeDimensionKeys"],
      "Resource": "*"
    },
    {
      "Sid": "CloudWatchReadOnly",
      "Effect": "Allow",
      "Action": ["cloudwatch:GetMetricStatistics", "cloudwatch:ListMetrics", "logs:FilterLogEvents", "logs:GetLogEvents"],
      "Resource": "*"
    },
    {
      "Sid": "CloudTrailReadOnly",
      "Effect": "Allow",
      "Action": ["cloudtrail:LookupEvents"],
      "Resource": "*"
    },
    {
      "Sid": "HealthReadOnly",
      "Effect": "Allow",
      "Action": ["health:Describe*"],
      "Resource": "*"
    },
    {
      "Sid": "S3ReportUpload",
      "Effect": "Allow",
      "Action": ["s3:PutObject", "s3:GetObject"],
      "Resource": "arn:aws:s3:::kida-reports-*/*"
    },
    {
      "Sid": "NotificationServices",
      "Effect": "Allow",
      "Action": ["ses:SendEmail", "ses:SendRawEmail", "sns:Publish"],
      "Resource": "*"
    }
  ]
}
//프로덕션 환경에서는 리소스 ARN을 특정하여 최소 권한 부여 원칙을 따르도록 정책 작성할 것을 권고 드립니다.
Step 2: EC2 인스턴스 준비
aws ec2 run-instances \
  --image-id resolve:ssm:/aws/service/ami-amazon-linux-latest/al2023-ami-kernel-default-x86_64 \
  --instance-type t3.small \
  --key-name your-key-pair \
  --iam-instance-profile Name=KidaEC2Role \
  --tag-specifications 'ResourceType=instance,Tags=[{Key=Name,Value=kida-cron}]' \
  --region us-east-1
Step 3: EC2에 Kiro CLI + MCP 서버 설치
ssh -i your-key-pair.pem ec2-user@<EC2_PUBLIC_IP>

# Kiro CLI 설치
curl -fsSL https://cli.kiro.dev/install | bash

# uvx 설치 (MCP 서버 실행에 필요)
curl -LsSf https://astral.sh/uv/install.sh | sh
source ~/.bashrc

# Kiro CLI 로그인
kiro-cli login

# MCP 서버 설정
mkdir -p ~/.kiro/settings
cat > ~/.kiro/settings/mcp.json << 'EOF'
{
  "mcpServers": {
    "aws-mcp": {
      "command": "uvx",
      "args": [
        "mcp-proxy-for-aws@latest",
        "https://aws-mcp.us-east-1.api.aws/mcp",
        "--metadata", "AWS_REGION=us-east-1"
      ],
      "disabled": false,
      "autoApprove": [
        "aws___call_aws",
        "aws___search_documentation",
        "aws___read_documentation"
      ]
    },
    "cloudwatch-mcp": {
      "command": "uvx",
      "args": ["awslabs.cloudwatch-mcp-server@latest"],
      "env": {
        "AWS_REGION": "us-east-1",
        "FASTMCP_LOG_LEVEL": "ERROR"
      },
      "disabled": false,
      "autoApprove": [
        "get_metric_data",
        "get_metric_metadata",
        "analyze_metric",
        "get_active_alarms",
        "get_alarm_history",
        "get_recommended_metric_alarms",
        "describe_log_groups",
        "analyze_log_group",
        "execute_log_insights_query",
        "get_logs_insight_query_results"
      ]
    },
    "aws-knowledge-mcp-server": {
      "command": "uvx",
      "args": ["fastmcp", "run", "https://knowledge-mcp.global.api.aws"],
      "disabled": false,
      "autoApprove": ["*"]
    }
  }
}
EOF

# Steering 파일 설정
mkdir -p ~/.kiro/steering
cat > ~/.kiro/steering/rds-troubleshoot.md << 'STEER'
---
inclusion: auto
---

### Persona
You are a top-tier AWS Database expert. Your core competency goes beyond
merely listing metrics; it involves finding tangible clues within the data
and presenting immediately actionable solutions.

### MCP Tool Usage Guide
- Use **cloudwatch-mcp** tools for metrics and logs:
  get_metric_data, analyze_metric, get_recommended_metric_alarms,
  get_active_alarms, get_alarm_history, describe_log_groups,
  analyze_log_group, execute_log_insights_query
- Use **aws-mcp** (call_aws) for RDS API, CloudTrail, Database Insights (PI API), SES
- Use **aws-knowledge-mcp-server** for AWS documentation search

### Analysis PHASE

#### PHASE 1: Resource Verification
- Run describe-db-clusters (via aws-mcp) to get cluster info and member list
- Identify all instances: Writer(s) and Reader(s) with their DBInstanceIdentifier
- Classify the query type (performance issue / incident / general guide)
- Check EnabledCloudwatchLogsExports to verify which logs are exported (error, slowquery, audit)
- If slowquery log is exported, check cluster parameter group for slow_query_log and long_query_time values
- If logs are NOT exported, note this as a finding and recommend enabling log exports

#### PHASE 2: Time Range Setup
- Use the region's timezone if not specified in the prompt

#### PHASE 3: Data Collection

**CRITICAL: Aurora Metric Collection Rules**
- Aurora uses shared storage. Some metrics are cluster-level only, others are instance-level only.
- For clusters with multiple instances, you MUST collect instance-level metrics for EACH instance separately.

**CloudWatch MCP tools (cloudwatch-mcp):**
- get_metric_data: Per-instance CPUUtilization, FreeableMemory, DatabaseConnections, ReadIOPS, WriteIOPS, SwapUsage, BufferCacheHitRatio, Deadlocks
- get_metric_data: Reader only — AuroraReplicaLag
- get_metric_data: Cluster level — VolumeBytesUsed
- analyze_metric: Per-instance CPUUtilization trend/seasonality/statistics
- get_recommended_metric_alarms: CPUUtilization alarm recommendations
- get_active_alarms: Currently active alarms in the account
- describe_log_groups + analyze_log_group: Log anomaly detection
- execute_log_insights_query: Error pattern analysis

**AWS API MCP tools (aws-mcp call_aws):**
- aws rds describe-events: Cluster and instance events
- aws cloudtrail lookup-events: API call history
- aws pi get-resource-metrics: Database Insights (if Advanced mode enabled)
- aws rds describe-db-recommendations: RDS recommendations
- aws rds describe-pending-maintenance-actions: Pending maintenance
- aws health describe-events: Health Dashboard

#### PHASE 4: Root Cause Analysis
- Use aws-knowledge-mcp-server for investigation
- If a recommendation includes 'check', execute it yourself
- Compare Writer vs Reader metrics when multiple instances exist

#### PHASE 5: Report Generation — REPORT STRUCTURE
- IMPORTANT: HTML reports with 9 tabs will be large (200+ lines). Use fsWrite for the first ~50 lines, then fsAppend for remaining parts. Split by logical sections (head+sidebar, then each tab content).

#### PHASE 6: Verification
- Verify all 9 tabs are present in the HTML report
- Verify per-instance time-series data is shown (not just summary)
- Verify instance-level metrics were collected per instance, not just cluster-level
- Verify CloudWatch MCP analyze_metric was used
- Verify the report opens correctly in browser
STEER
Step 4: S3 버킷 생성
aws s3api create-bucket --bucket kida-reports-<ACCOUNT_ID> --region us-east-1보고서는 Amazon S3에 업로드 후 Presigned URL(7일 유효)로 접근합니다. 버킷을 공개할 필요가 없어 보안적으로 안전합니다. 매일 cron이 실행될 때마다 새 Presigned URL이 생성되므로 별도 갱신이 필요 없습니다. 각 URL은 7일간 유효하며, 7일 이후에도 보고서를 보려면 S3 콘솔에서 직접 다운로드하거나 새 Presigned URL을 수동 생성하면 됩니다.
알림 채널별 구성
공통 파이프라인: S3 업로드 → Presigned URL → 알림 발송
모든 알림 방식은 동일한 공통 파이프라인을 거칩니다. Kiro CLI가 HTML 보고서를 생성한 후, 다음 3단계가 순서대로 실행됩니다.
Kiro CLI (HTML 보고서 생성)

          │

          ▼

          ① aws s3 cp → S3 버킷에 업로드

          │ (s3://kida-reports-<ACCOUNT_ID>/reports/YYYYMMDD/cluster-name.html)

          ▼

          ② aws s3 presign → 7일 유효 Presigned URL 생성

          │ (https://kida-reports-xxx.s3.amazonaws.com/reports/...?X-Amz-...)

          ▼

          ③ 알림 발송 → Presigned URL을 이메일 본문 / Slack 메시지에 포함하여 발송
아래 각 방식은 ③ 알림 발송 부분만 다르고, ①②는 동일합니다.
방식 1: SES 이메일
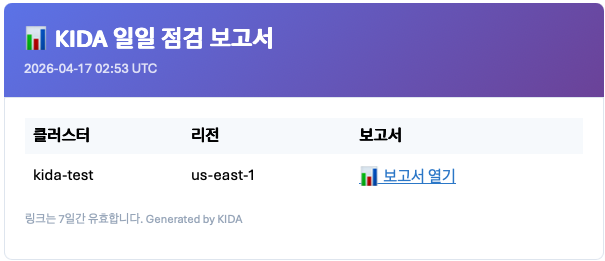
가장 간단한 방식입니다. Amazon SES로 HTML 이메일을 발송하며, 보고서의 S3 Presigned URL 링크가 이메일 본문에 테이블 형태로 포함됩니다. 수신자는 이메일의 “보고서 열기” 링크를 클릭하면 브라우저에서 Tailwind CSS 보고서가 바로 열립니다.
사전 준비:
# 발신/수신 이메일 주소 인증
aws ses verify-email-identity --email-address your-email@example.com --region us-east-1
# → 인증 메일이 발송됩니다. 메일함에서 확인 링크를 클릭하세요.
알림 발송 코드 (스크립트 내):
# SES로 HTML 이메일 발송
aws ses send-email \
  --source "your-email@example.com" \
  --destination "ToAddresses=your-email@example.com" \
  --message "Subject={Data='[KIDA] 일일 점검 보고서',Charset=UTF-8},Body={Html={Data='<html>..보고서 링크..</html>',Charset=UTF-8}}" \
  --region us-east-1
아래와 같이 메일로 보고서를 받을 수 있습니다.
방식 2: Slack Workflow Webhook
Slack Workflow Webhook을 사용하면 별도의 Slack App 생성 없이 Slack 채널에 보고서 링크를 자동 포스팅할 수 있습니다. 공통 파이프라인에서 생성된 Presigned URL이 Slack 메시지에 <URL|보고서 열기> 형태로 포함되어, 채널 멤버가 링크를 클릭하면 브라우저에서 보고서가 바로 열립니다.
사전 준비:
-
- Slack에서 Workflow Builder 열기 (좌측 사이드바 → Tools → Workflows)
- “New Build Workflow” → “Choose an event” → “From a webhook” 선택
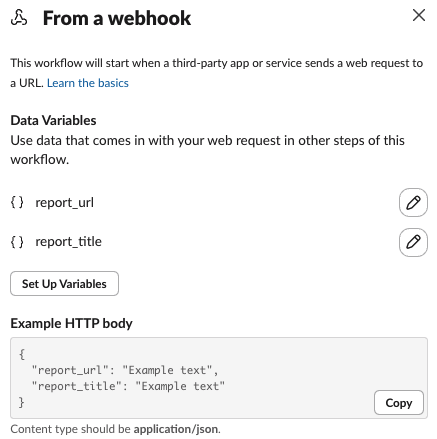
- Webhook 변수 추가:
report_title(text),report_url(text)
-
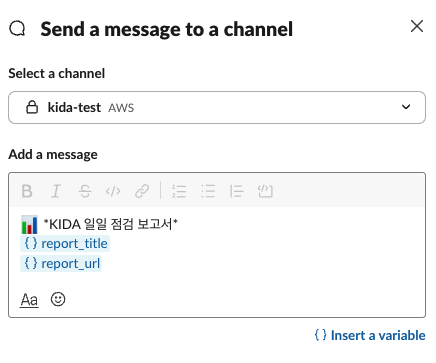
- “Send a message” 스텝 추가 → 알림 받을 채널 선택 → 메시지에 insert a variable 클릭하여 변수 추가
- Workflow 게시 → Webhook URL 복사
알림 발송 코드:
SLACK_WORKFLOW_URL="https://hooks.slack.com/triggers/T.../B.../xxx"

curl -s -X POST "$SLACK_WORKFLOW_URL" \
  -H 'Content-Type: application/json' \
  -d "{
    \"report_title\": \"${CLUSTER_ID} (${REGION}) — ${DATE}\",
    \"report_url\": \"${PRESIGNED_URL}\"
  }"
아래와 같이 슬랙을 통해 알림을 받을 수 있습니다.

팁: Slack Workflow Webhook의 text 변수는 단일 라인 텍스트만 지원합니다. 메시지 포맷(이모지, 볼드 등)은 Workflow의 “Send a message” 스텝에서 직접 설정하고, webhook에서는 report_title과 report_url 값만 전달하는 것이 안정적입니다.
전체 자동 실행 스크립트 (SES 이메일 + Slack Workflow Webhook 버전)
아래 자동 실행 스크립트는 예시이며, 실행 환경에 따라 일부 수정이 필요할 수 있습니다.
#!/bin/bash
# kida-daily-cron.sh
set -euo pipefail

EMAIL_TO="your-email@example.com"
EMAIL_FROM="your-email@example.com"
S3_BUCKET="kida-reports-<ACCOUNT_ID>"
AWS_REGION="us-east-1"
PRESIGN_EXPIRY=604800
SLACK_WORKFLOW_URL="https://hooks.slack.com/triggers/T.../B.../xxx"  # Slack Workflow Webhook URL

CLUSTERS=(
  "my-cluster-1:us-east-1"
  "my-cluster-2:ap-northeast-2"
)

SCRIPT_DIR="$(cd "$(dirname "$0")" && pwd)"
REPORT_DIR="${SCRIPT_DIR}/reports"
DATE=$(date +%Y%m%d)
TIMESTAMP=$(date '+%Y-%m-%d %H:%M KST')
LOG_FILE="${REPORT_DIR}/kida-cron-${DATE}.log"
mkdir -p "$REPORT_DIR"

log() { echo "[$(date '+%H:%M:%S')] $1" | tee -a "$LOG_FILE"; }

declare -a REPORT_ROWS=()

for entry in "${CLUSTERS[@]}"; do
  cluster_id="${entry%%:*}"; region="${entry##*:}"
  report_file="${REPORT_DIR}/kida-${cluster_id}-${DATE}.html"
  s3_key="reports/${DATE}/${cluster_id}.html"

  log "Analyzing ${cluster_id} (${region})..."

  kiro-cli chat --no-interactive --trust-all-tools \
    "${cluster_id} 클러스터(${region})에 대해 최근 24시간 일일 점검 보고서를 생성해줘. Tailwind CSS HTML 보고서를 ${report_file}로 저장해줘. 근본 원인과 권장 조치를 포함해줘." \
    >> "$LOG_FILE" 2>&1 || true

  if [ -f "$report_file" ]; then
    aws s3 cp "$report_file" "s3://${S3_BUCKET}/${s3_key}" --content-type "text/html" --region "$AWS_REGION" >> "$LOG_FILE" 2>&1
    url=$(aws s3 presign "s3://${S3_BUCKET}/${s3_key}" --expires-in "$PRESIGN_EXPIRY" --region "$AWS_REGION")
    REPORT_ROWS+=("<tr><td style='padding:8px;'>${cluster_id}</td><td style='padding:8px;'>${region}</td><td style='padding:8px;'><a href='${url}' style='color:#3182ce;'>보고서 열기</a></td></tr>")
    log "  ✅ ${cluster_id} 완료"
  else
    REPORT_ROWS+=("<tr><td style='padding:8px;'>${cluster_id}</td><td style='padding:8px;'>${region}</td><td style='padding:8px;color:#e53e3e;'>❌ 실패</td></tr>")
    log "  ❌ ${cluster_id} 실패"
  fi
done

# SES 이메일 발송
ROWS_HTML=""; for row in "${REPORT_ROWS[@]}"; do ROWS_HTML+="$row"; done

EMAIL_BODY="<html><body style='font-family:-apple-system,sans-serif;'>
<div style='max-width:600px;margin:0 auto;'>
  <div style='background:linear-gradient(135deg,#667eea,#764ba2);padding:20px;border-radius:8px 8px 0 0;'>
    <h2 style='color:white;margin:0;'>KIDA 일일 점검 보고서</h2>
    <p style='color:rgba(255,255,255,0.8);margin:5px 0 0;font-size:14px;'>${TIMESTAMP}</p>
  </div>
  <div style='background:white;padding:20px;border:1px solid #e2e8f0;border-radius:0 0 8px 8px;'>
    <table style='width:100%;border-collapse:collapse;'>
      <thead><tr style='background:#f7fafc;'><th style='padding:8px;text-align:left;'>클러스터</th><th style='padding:8px;text-align:left;'>리전</th><th style='padding:8px;text-align:left;'>보고서</th></tr></thead>
      <tbody>${ROWS_HTML}</tbody>
    </table>
    <p style='margin-top:16px;font-size:12px;color:#a0aec0;'>링크는 7일간 유효합니다. Generated by KIDA</p>
  </div>
</div></body></html>"

TMPFILE="${REPORT_DIR}/.email-${DATE}.json"
cat > "$TMPFILE" << EMAILEOF
{
  "Source": "${EMAIL_FROM}",
  "Destination": {"ToAddresses": ["${EMAIL_TO}"]},
  "Message": {
    "Subject": {"Data": "[KIDA] 일일 점검 보고서 — ${DATE}", "Charset": "UTF-8"},
    "Body": {"Html": {"Data": $(echo "$EMAIL_BODY" | python3 -c "import sys,json; print(json.dumps(sys.stdin.read()))"), "Charset": "UTF-8"}}
  }
}
EMAILEOF

aws ses send-email --cli-input-json "file://${TMPFILE}" --region "$AWS_REGION" >> "$LOG_FILE" 2>&1
rm -f "$TMPFILE"
log "✅ Email sent to ${EMAIL_TO}"

# Slack Workflow Webhook 발송 (report_title + report_url)
for entry in "${CLUSTERS[@]}"; do
  cluster_id="${entry%%:*}"; region="${entry##*:}"
  s3_key="reports/${DATE}/${cluster_id}.html"
  url=$(aws s3 presign "s3://${S3_BUCKET}/${s3_key}" --expires-in "$PRESIGN_EXPIRY" --region "$AWS_REGION" 2>/dev/null || echo "")
  if [ -n "$url" ]; then
    SLACK_JSON=$(jq -n \
      --arg title "${cluster_id} (${region}) — ${DATE}" \
      --arg url "$url" \
      '{"report_title": $title, "report_url": $url}')
    curl -s -X POST "$SLACK_WORKFLOW_URL" \
      -H 'Content-Type: application/json' \
      -d "$SLACK_JSON" >> "$LOG_FILE" 2>&1
  fi
done
log "✅ Slack notification sent"
** 공개된 스크립트와 설정은 예시이며, 실운영 환경에 맞게 수정이 필요할 수 있습니다.
crontab 등록
chmod +x /home/ec2-user/kida-daily-cron.sh

# 매일 00:00 UTC (09:00 KST)
(crontab -l 2>/dev/null; echo "0 0 * * * /home/ec2-user/kida-daily-cron.sh >> /home/ec2-user/reports/cron.log 2>&1") | crontab -

crontab -l
정리
이 글에서는 EC2 인스턴스에 Kiro CLI와 MCP 서버를 설치하고, cron으로 매일 자동 실행하여 RDS/Aurora 점검 보고서를 생성하는 전체 파이프라인을 구성했습니다. HTML 보고서를 S3에 업로드한 뒤 Presigned URL(7일 유효)을 생성하고, SES 이메일과 Slack Workflow Webhook으로 보고서 링크를 자동 발송하는 방법을 다뤘습니다.
이 시리즈를 통해 DBA는 자신의 환경에 맞는 방식을 선택할 수 있습니다. IDE에서 즉시 분석이 필요하면 Part 1, SSH 환경이면 Part 2, 매일 자동 보고서가 필요하면 Part 3를 적용할수 있습니다. 이 글의 스크립트와 crontab 설정을 EC2에 적용하면 매일 아침 점검 보고서를 자동으로 받아볼 수 있습니다. Kiro에 대한 자세한 내용은 Kiro 공식 사이트에서, Amazon RDS와 Amazon Aurora에 대한 자세한 내용은 각 제품 페이지에서 확인할 수 있습니다.