AWS Architecture Blog
Field Notes: Monitor Your Couchbase Performance and Logs with Amazon CloudWatch
Cloud architects leverage AWS compute services to run customer-managed workloads like Couchbase clusters. While customer-managed workloads may come with their own monitoring metrics and dashboards, customers miss the same level of deep integration with Amazon CloudWatch that the AWS managed services provide.
In this post, we show you how to achieve higher levels of observability and monitoring using CloudWatch to monitor customer-managed workloads through serverless architectures. The architectures leverage CloudWatch to be a unified plane of monitoring workloads’ resources and services.
We also show how you can create alerts on relevant thresholds and automate certain actions, like notifying the operations team to perform maintenance tasks on your cluster without disruption. As a result, you’re able to drive operational excellence across all your resources through nearly continuous observability.
Code snippets, examples in this post, and artifacts for the monitoring solution deployment are available in this samples repository.
Couchbase is a distributed, high performance, Cache and NoSQL database in a single cluster architecture. Couchbase uses the concept of buckets to distribute data across the cluster nodes. A bucket is a logical grouping of keys and values associated to those keys. We’ll explore two mechanisms for exposing cluster and buckets metrics to monitor your cluster performance.
- Through an HTTP API endpoint that exports metrics based on the API endpoint of the cluster, or a bucket in JSON format.
- Through a command line tool, CBSTATS, that ships with Couchbase. CBSTATS has a parameter to allow for text or JSON output format.
We supplement metrics with dimensions to add additional meta-data to metrics, identifying for example resource id or a logical grouping like a cluster.
Applying load on the cluster
To set the stage for monitoring solutions, you should have your cluster up and running in an Amazon VPC. To simulate some load on your cluster you can use pillow fight, a part of libcouchbase the C client library for Couchbase, to induce artificial load.
Log into the Couchbase cluster and check the web monitoring console provided, while running the performance load test tool. The internal monitoring dashboard should look similar to the following images.
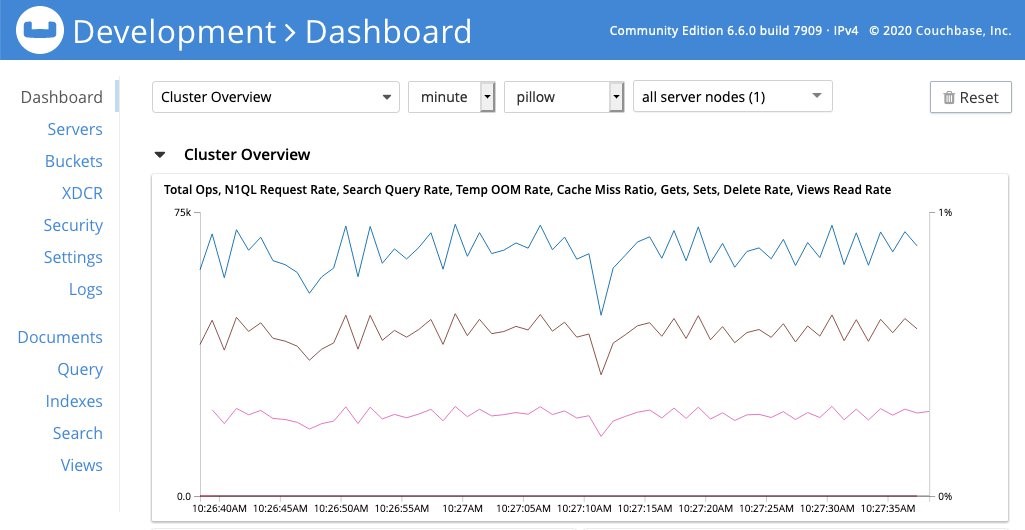
Figure 1 – Couchbase monitoring dashboard showing Total Ops (equivalent to Gets + Sets)
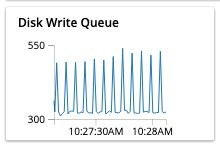
Figure 2 – showing Disk write queue panel in the monitoring dashboard showing number of items waiting to be written to disk
We aim to replicate this dashboard by forwarding those metrics to CloudWatch and visualizing them via the CloudWatch console. We use number of operations per second as a representative of cluster performance, and disk write queue as a representative of consistency of data.
Monitor using Prometheus and Container Insights
If you install Couchbase through a containers platform, such as Amazon Elastic Kubernetes Service (Amazon EKS), you can leverage container insights Prometheus metrics monitoring to export Couchbase metrics to CloudWatch. Using Couchbase exporter for Prometheus, you can export Couchbase metrics to Prometheus scrapper by exposing a metrics HTTP endpoints.
Once exporter is installed you can verify the results by running the following command:
curl localhost:9420/metricsThis approach is modular and so you can then set up a CloudWatch agent for Prometheus on your node and configure the agent to check for this endpoint to export metrics to Amazon CloudWatch.
Monitor Couchbase cluster metrics via HTTP API endpoint externally
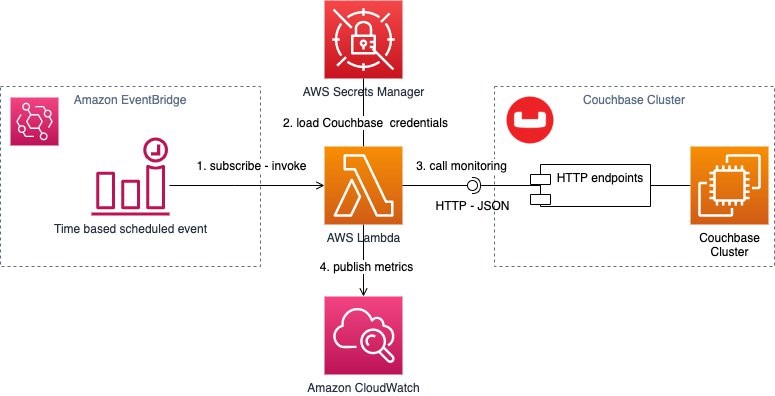
Figure 3 – serverless monitoring solution architecture showing an AWS Lamba function scheduled by an EventBridge rule. The function calls monitoring endpoints after obtaining cluster credentials from Secrets Manager, parses the response and posts metrics to CloudWatch.
If you’re not using containers or don’t have control over installing additional packages on your node, Couchbase clusters provide JSON-based HTTP endpoints that exports information about the cluster health. Couchbase clusters also provide bucket-specific endpoints that monitor the performance of the operations in relation to the buckets. For more information on the endpoints, review the Couchbase documentation.
Node monitoring endpoint
The first endpoint is http://<ip>:8091/pools/default gives an insight into computing resources consumed per node. While we could have used http://<ip>:8091/nodeStatuses endpoint, we opted to use an endpoint that provides more information for demonstration purposes.
A typical response looks as follows:
{
  "name": "default",
  "nodes": [
    {
      "systemStats": {...},
      "interestingStats": {
        ...
        "mem_used": 100453472,
      },
      ...
      "status": "healthy",
      "ports": {...},
      "services": [...],
      "externalListeners": [...]
    }
  ],
  "buckets": {...},
  "remoteClusters": {...},
  "alerts": [],
  "controllers": {...},
  "rebalanceStatus": "none",
  "nodeStatusesUri": "/nodeStatuses",
  "maxBucketCount": 30,
  "autoCompactionSettings": {...},
  "tasks": {...},
  "counters": {},
  "clusterName": "Development",
  "balanced": true,
  "storageTotals": {
    "ram": {...},
    "hdd": {...}
  }
}
To convert the information provided through this endpoint to metrics we’ll need to extract metrics and regularly call this endpoint, and send statistics to CloudWatch as metrics. The metrics will be added into a Couchbase namespace to group all the metrics and supplemented by dimensions.
The following is an example of an AWS Lambda function in Python to call the endpoint, and constructs CloudWatch metrics.
cloudwatch = boto3.client('cloudwatch')

def handler():
    metric_data = []
    cluster_monitor_response = get_monitoring_details(
        cluster_base_url + '/pools/default', auth=auth)
    cluster_name = cluster_monitor_response['clusterName']
    nodes = len(cluster_monitor_response['nodes'])
    healthy_nodes = len(
        [node for node in cluster_monitor_response['nodes']
            if 'healthy' == node['status']])
    metric_data.append(
        {
            'MetricName': 'HealthyNodes',
            'Dimensions': [
            {
                'Name': 'Cluster',
                'Value': cluster_name
            }],
            'Unit': 'None',
            'Value': healthy_nodes,
            'StorageResolution': 60
        })
    cloudwatch.put_metric_data(MetricData=metric_data, Namespace='Couchbase')
The code interrogates the response from the endpoint for the nodes array, and provides a metric for number of healthy nodes. This value is set in the field Value as this is a single value metric.
Setting StorageResolution to 60 specifies this metric as a regular-resolution metric, which CloudWatch stores at 1-minute resolution. This is done as we’re calling this endpoint on a minute-by-minute basis as we’ll see in nearly-continuous monitoring.
Buckets monitoring endpoint
The second endpoint is http://<ip>:8091/pools/default/buckets/<bucket_name>/stats which provides insights on bucket-level statistics across all nodes.
A typical response looks as follows:
{
  "op": {
    "samples": {
        ...
        "ep_queue_size":[0,1,1,2,0,....],
        "ep_cache_miss_rate": [0,1,1,2,0,...],
        "cmd_set": [0,1,1,2,0,...],
        "cmd_get": [0,1,1,2,0,...],
        "ops": [0,1,1,2,0,...],
        ...
        }
    },
    "samplesCount": 60,
    "isPersistent": true,
    "lastTStamp": 1605878935611,
    "interval": 1000,
    "hot_keys": [
        {
            "name": "object_key_name",
            "ops": 0.000002082661891817169
        },
        ...
    ]
}
The bucket endpoint provides a higher granularity for statistics that can be passed to CloudWatch metrics. For example, we want disk drain and cache misses.
Following is example code that can be added to monitor these metrics:
def handler():
    ...
    bucket_name = 'pillow'
    bucket_monitor_response = get_monitoring_details(
        cluster_base_url + '/pools/default/buckets/{}/stats'.format(bucket_name), auth=auth)
    metric_data.append(
        {
            'MetricName': 'DiskDrain',
            'Dimensions': [
            {
                'Name': 'Cluster',
                'Value': cluster_name
            },
            {
                'Name': 'Bucket',
                'Value': bucket_name
            }],
            'Unit': 'None',
            'Values': bucket_monitor_response['op']['samples']['ep_queue_size'],
            'StorageResolution': 1
        })
    cloudwatch.put_metric_data(MetricData=metric_data, Namespace='Couchbase')
The code is similar to the one we described earlier with some notable changes:
- The request to CloudWatch API contains all the values set as an array in the property Values.
- Setting StorageResolution to 1 specifies this metric as a high-resolution metric, so that CloudWatch stores the metric with sub-minute resolution down to the second. High resolution is currently available only for custom metrics. For more information about high-resolution metrics, review the Amazon CloudWatch User Guide.
Nearly Continuous monitoring
To continuously monitor the Couchbase cluster and buckets through the exposed endpoints, the preceding example can be called from AWS Lambda. This provides a cost-effective solution for your monitoring needs. As your Couchbase cluster can be a private cluster, you can configure a Lambda function to connect to resources provisioned in your private subnets in a VPC in your AWS account.
We learned that we can crawl the metrics with a Lambda function. But how do we actually initiate it?
One way is to leverage Amazon EventBridge to create time-based scheduled events. The event initiates a Lambda function that is subscribed as a target. We recommend using AWS Secrets Manager to store Couchbase cluster credentials. Review the following post: How to securely provide database credentials to Lambda functions by using AWS Secrets Manager, to learn how to inject secrets stored in secret manager inside the Lambda function.
Monitor Couchbase cluster metrics via HTTP API endpoint internally
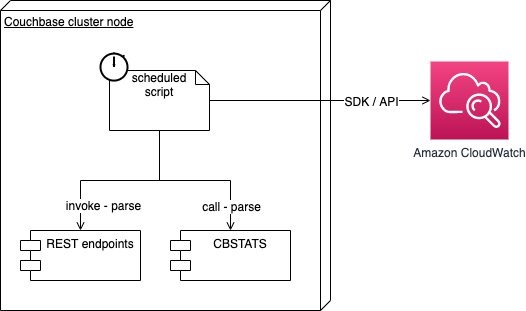
Figure 4 – features a node monitoring solution, a script scheduled by host calls Couchbase monitoring CLI tools, and parses the response and posts metrics to CloudWatch.
This solution is suitable if you can install packages on the cluster nodes to publish metrics to CloudWatch directly. We’ll reuse the scripts in the preceding solution to call the same endpoints.
If needed, we can combine results with detailed statistics from CBSTATS tool after parsing its output.
stream = os.popen('/opt/couchbase/bin/cbstats localhost all -j -u {} -p {} -a'.format(
        event['username'], event['password']))
cbstats_output = stream.read()
cbstats_lines = cbstats_output.split(cbstats_output_delimiter)

for cbstats_out_line in cbstats_lines:
    if len(cbstats_out_line) > 0:
        bucket_and_response = cbstats_out_line.split('\n',1)[1].split('\n',1)
        bucket = bucket_and_response[0]
        if bucket in buckets:
            bucket_cbstats_response = json.loads(bucket_and_response[1])
Nearly Continuous monitoring
We then create a script that conveniently calls the needed CLI tools and creates the metrics we want to monitor through CloudWatch.
metric_data=$(python couchbase_monitor_cli.py "${c_username}" "${c_password}" "${buckets}" 0>&1)
aws cloudwatch put-metric-data --namespace "Couchbase" --metric-data "${metric_data}" --region "${region}"
We leverage the host node schedule mechanisms. Following is an example using cron schedule expression that you can set in a cron service to initiate the monitoring script every minute.
* * * * * /opt/aws/couchbase-monitor/metrics-cloudwatch.sh user password bucket1,bucket2As a best practice, it is recommended to poll the endpoints / cbstats every 60 seconds.
Metrics and Alarms in Amazon CloudWatch
As a result, you can start obtaining metrics in the CloudWatch console, similar to those that were previously only reached through the Couchbase dashboards, endpoints or CLI tools.
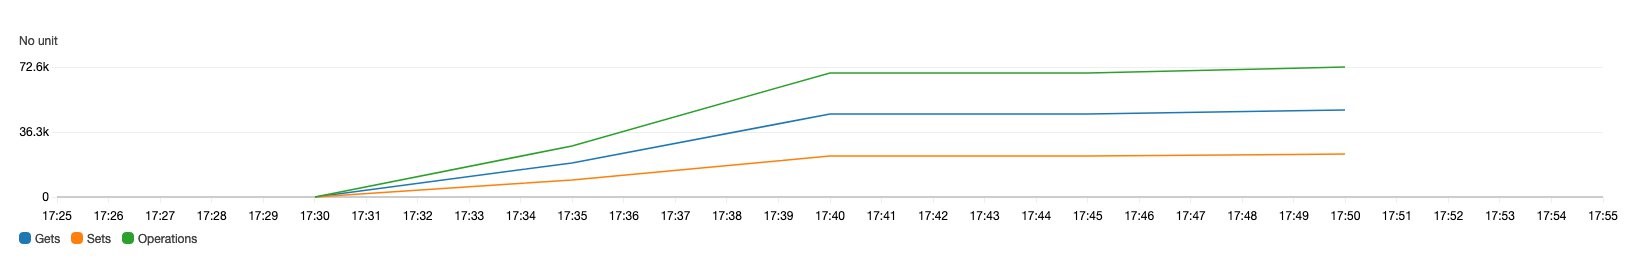
Figure 5 – showing Total Ops metrics in CloudWatch visualized in the AWS console showing Total Ops (equivalent to Gets + Sets).
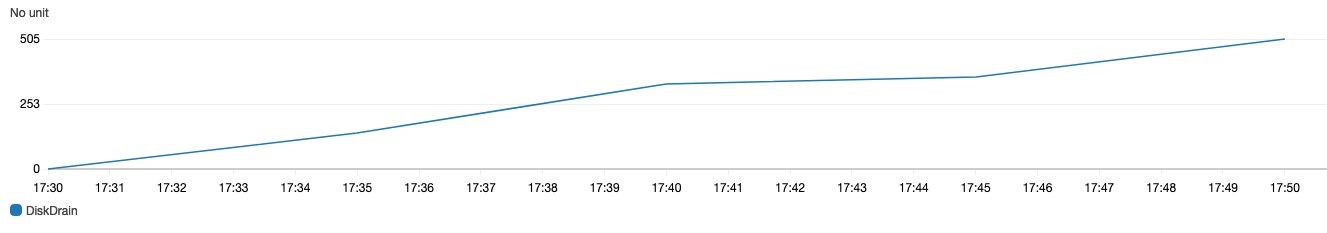
Figure 6 – showing Disk write queue metrics in CloudWatch visualized in the AWS console showing number of items waiting to be written to disk.
Now you can define alerts to unhealthy node count exceeding a threshold of 1 for a 1-minute period. You can refer to the following guide, Create a CloudWatch Alarm Based in a Static Threshold.
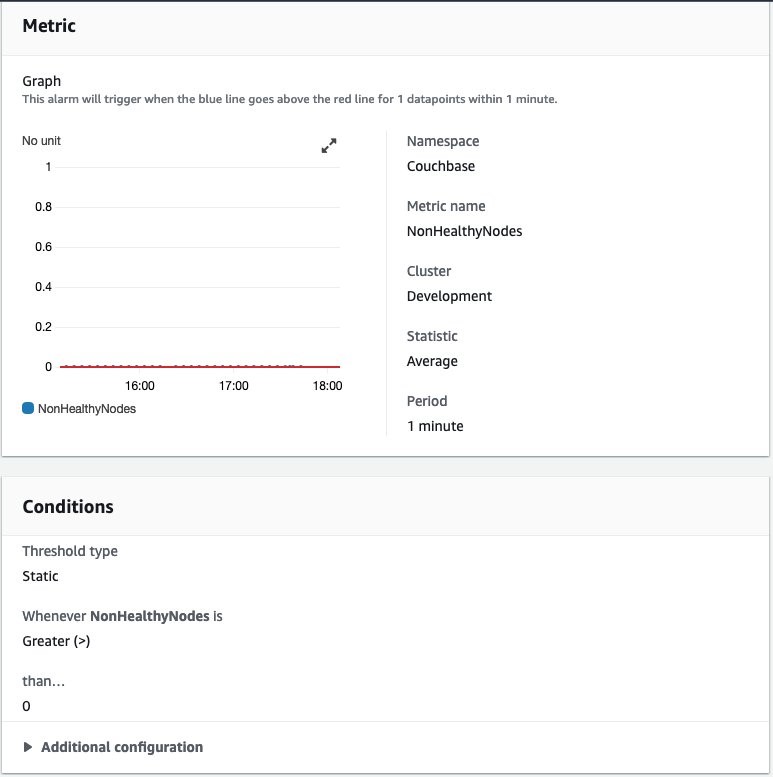
Figure 7 – showing example setup for a CloudWatch alarm on non-healthy nodes metrics in the AWS Console.
Sending Couchbase node logs to Amazon CloudWatch Logs
The second piece of the monitoring solution is ingesting Couchbase node logs to a resilient log aggregator. To ingest your service logs, you can use CloudWatch Logs unified agent and ship logs and metrics to CloudWatch Logs and CloudWatch. Once logs are ingested you can search in log entries, and define metrics to be emitted once a certain filter matches your log entries.
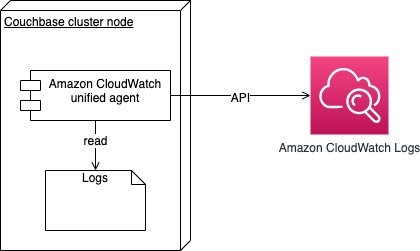
Figure 8 – showing CloudWatch unified agent monitoring local logs and ships them to CloudWatch Logs for analysis.
The agent monitors log files for changes and ingests your logs automatically. Following is an example agent configuration for the log configuration portion.
{
  "logs": {
     "logs_collected": {
        "files": {
          "collect_list": [
           {
                "file_path": "/opt/couchbase/var/lib/couchbase/logs/error.log*",
                "log_group_name": "/couchbase/error/",
                "log_stream_name": "{instance_id}-{ip_address}",
                "timestamp_format": "%Y-%m-%dT%H:%M:%S.%fZ"
            },
            {
                "file_path": "/opt/couchbase/var/lib/couchbase/logs/info.log*",
                "log_group_name": "/couchbase/info/",
                "log_stream_name": "{instance_id}-{ip_address}",
                "timestamp_format": "%Y-%m-%dT%H:%M:%S.%fZ",
                "multi_line_start_pattern":"\\[ns_server:"
            },
            {
                "file_path": "/opt/couchbase/var/lib/couchbase/logs/couchdb.log*",
                "log_group_name": "/couchbase/couchdb/",
                "log_stream_name": "{instance_id}-{ip_address}",
                "timestamp_format": "%Y-%m-%dT%H:%M:%S.%fZ",
                "multi_line_start_pattern":"\\[couchdb:"
            },
            {
                "file_path": "/opt/couchbase/var/lib/couchbase/logs/babysitter.log*",
                "log_group_name": "/couchbase/babysitter/",
                "log_stream_name": "{instance_id}-{ip_address}",
                "timestamp_format": "%Y-%m-%dT%H:%M:%S.%fZ"
            }
        ]
      }
    }
  }
}
Then logs in the CloudWatch logs console appear, helping you troubleshoot issues happening during operations.
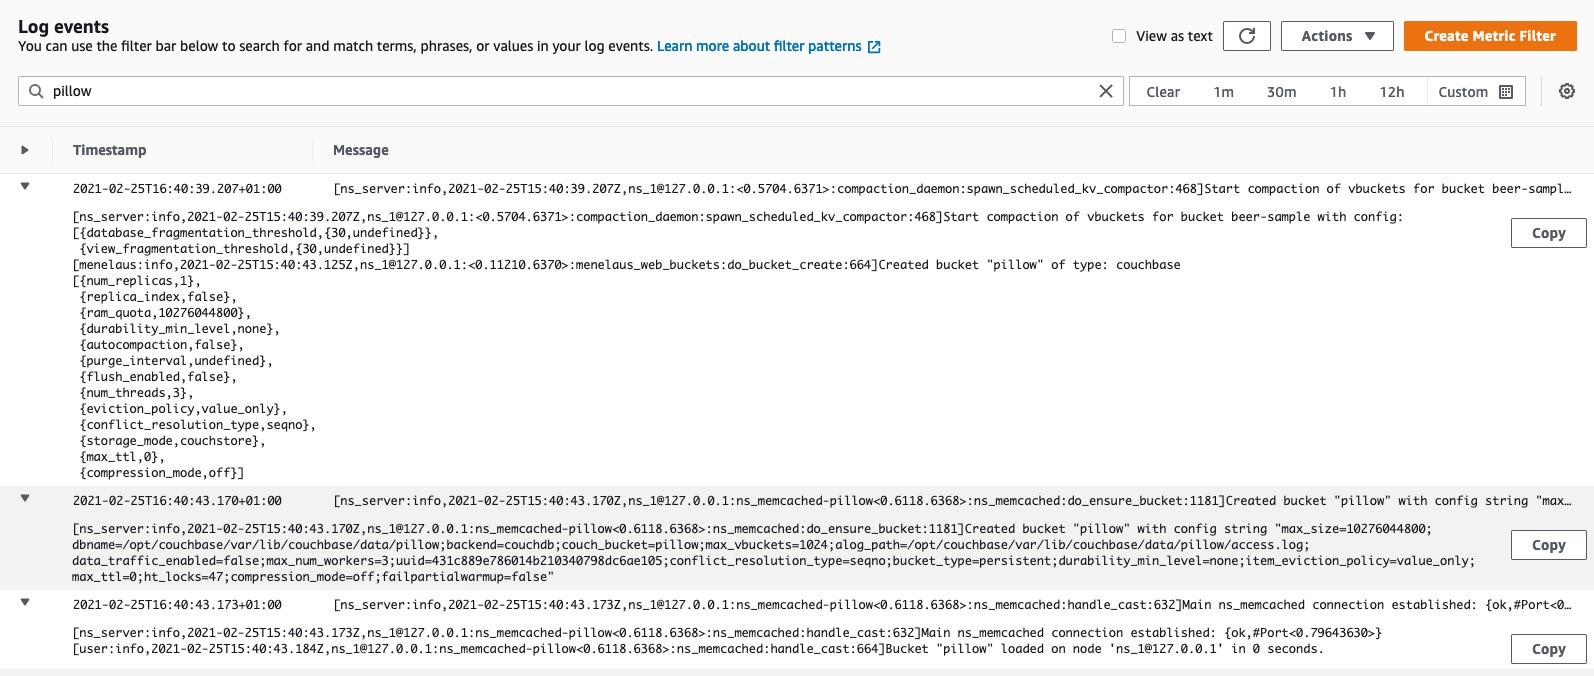
Figure 9 – showing node info logs in CloudWatch Logs browsed from the AWS Console.
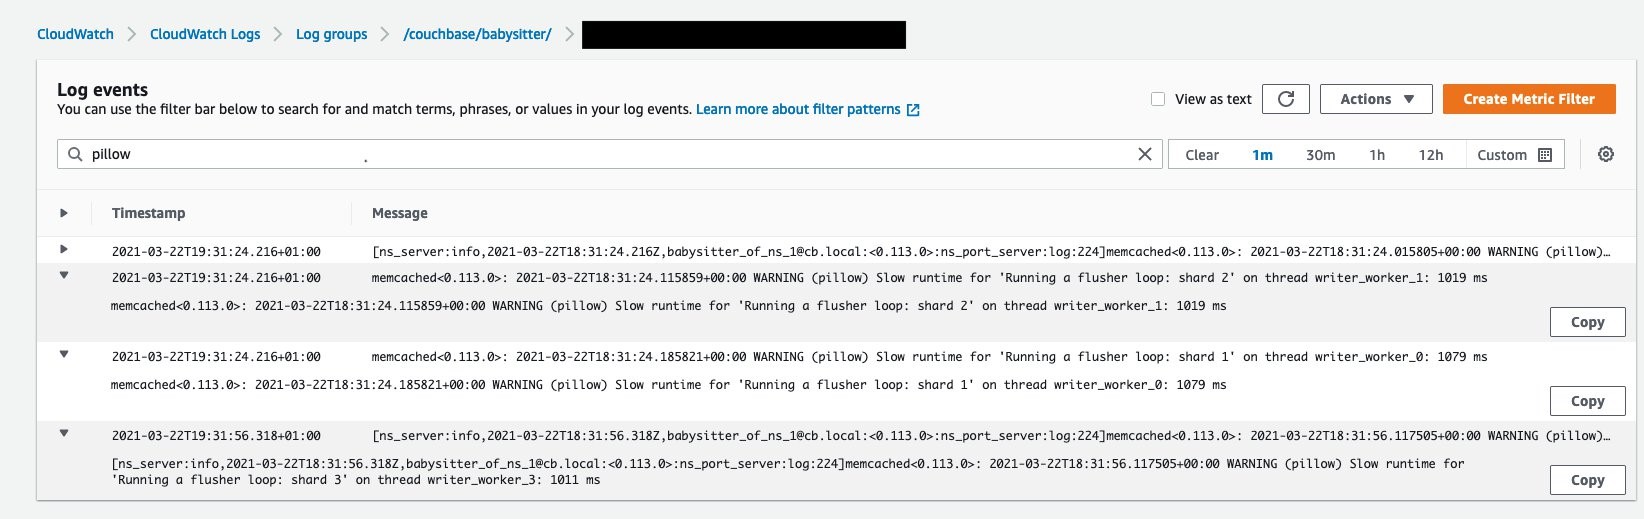
Figure 10 – showing node babysitter service logs in CloudWatch Logs browsed from the AWS Console. The preceding example shows how running the load test affects flushing.
Cost Drivers and Clean Up
The cost drivers for such solution would depend on the number of metrics and the frequency of posting metrics to CloudWatch. You can utilize the free tier to monitor some of your workloads. Your nonfunctional requirements will influence the number, frequency and granularity of metrics.
As a general rule, extend metrics as long as you have actionable alerts, notifications or remediation actions to support your operational goals.
You can extend the metrics you’re monitoring by modifying your monitoring scripts. CloudWatch offers the scalability and flexibility to accommodate added, and removed, metrics. For more details on pricing for CloudWatch and CloudWatch Logs refer to the Amazon CloudWatch pricing page.
To stop incurring additional costs you can:
- Clean up resources by deleting the CloudFormation stack.
- Disable the created EventBridge rules for external cluster monitoring without decommissioning the solution.
- Disable cron tab or scheduled scripts for internal node monitoring.
- Stop CloudWatch Logs agent (if it’s only used to ship logs) or update the logs section and remove Couchbase logs configuration in all deployed instances of the agent.
Conclusion
In this post, we showed how you can leverage custom metric submission to CloudWatch. Using serverless architectures to orchestrate and schedule metrics updates. Additionally, we showed you how to ship service logs to Amazon CloudWatch Logs to troubleshoot and debug problems, or create alerts based on operational logs. That way, you can monitor your Couchbase workloads and set alerts. These will help you automate cluster notifications for significant events or to notify you to scale your cluster based on load.
Check out the code snippets and examples for this post in the samples repository, and additional resources.
We hope you found this post helpful, and look forward to your feedback in the comments!
The AWS Management and Governance Blog for additional learning on CloudWatch.
Couchbase documentation for monitoring API endpoints.