AWS Cloud Financial Management
How One Organization Cut AWS Costs by 39% in 12 Weeks
In 12 weeks, one Software as a Service (SaaS) organization cut AWS costs by 39% while preparing for 10x growth. This post walks through the phased approach the team used to sequence multiple optimizations without disrupting production. Each phase built on the last, compounding into a total 39% reduction within 12 weeks. You can apply this same phased approach to your own AWS workloads, regardless of infrastructure size.
In this blog post, you learn how to:
- Prioritize cost optimizations using effort-versus-impact scoring, including extending AWS Cost Optimization Hub for custom architectural changes
- Sequence changes into phases where each phase funds and reduces risk for the next
- Execute high-impact infrastructure changes, such as consolidating more than 150 Network Load Balancers (NLBs) onto five Application Load Balancers (ALBs), with zero downtime
- Sustain savings with automated governance
Background
The platform engineering team behind a growing SaaS product line processed 150 TB of data while spending $35,000 per month on AWS infrastructure. Projected 10x growth would increase costs to $350,000 monthly, a potential annual impact of more than $4.2 million.
The team identified multiple optimization opportunities across storage, networking, compute, and architecture, each delivering incremental savings. The challenge was combining these into a coordinated program without disrupting production. The team sequenced changes by risk and dependency, so that each phase funded and reduced risk for the next.
Understanding the Cost Challenge
Five key inefficiencies drove the majority of the $35,000 monthly spend:
- Older generation Amazon Elastic Compute Cloud (EC2) m5 instances and Amazon Elastic Block Store (EBS) gp2 volumes, missing current-generation price-performance
- Amazon S3 traffic routed through Network Address Translation (NAT) gateway, driving $2,400/month in avoidable charges
- More than 150 NLBs with thousands in fixed monthly costs
- 100% of data on Amazon Simple Storage Service (S3) Standard Storage vs. tiering infrequently accessed data to lower-cost storage classes
- Sizing workloads for peak capacity rather than scaling based on elastic demand, causing 30–50% waste
Prioritizing Effort Versus Impact
AWS Cost Optimization Hub surfaced three recommendations for the team’s workload: Amazon EBS gp2-to-gp3 migration, compute right-sizing, and AWS Graviton migration. For four additional architectural changes outside those recommendations, the team built custom effort-versus-impact scoring. Figure 1 shows the finalized optimization scoring table.
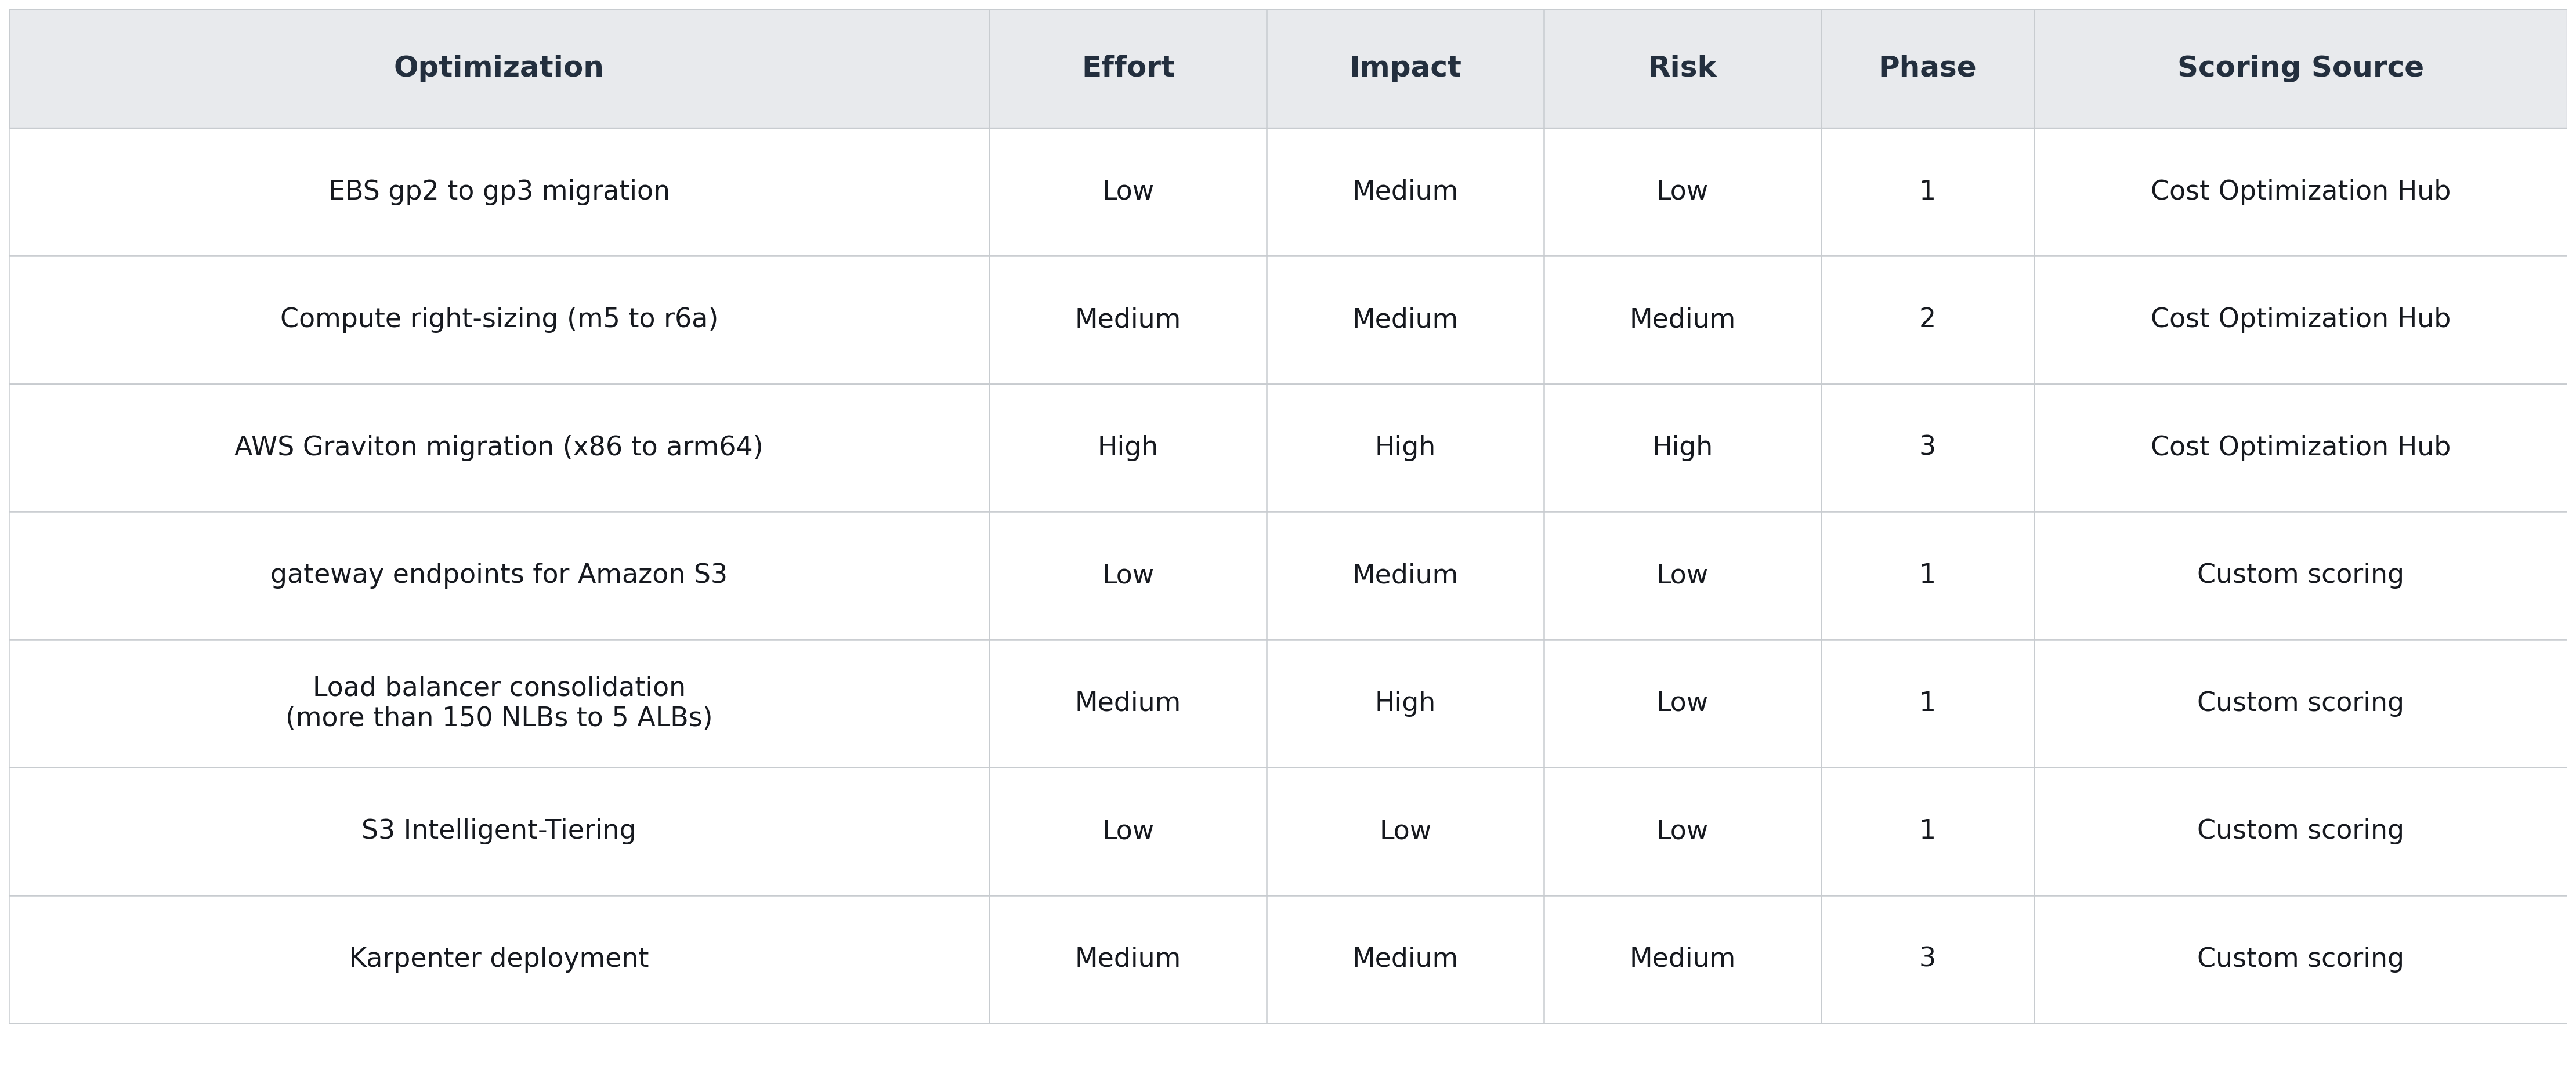
Figure 1. Effort-versus-impact scoring that sequenced the seven optimizations by phase.
AWS Cost Optimization Hub includes implementation effort and restart estimates for each recommendation, which helped identify the lowest-risk items. The same approach applied to custom-scored items, placing low-effort, low-risk changes in Phase 1 to build confidence and fund later phases. Each custom-scored item was evaluated on three factors: implementation complexity, monthly savings potential, and failure scope if something went wrong.
The load balancer consolidation scored as follows:
- Effort: Medium. Required deploying the AWS Load Balancer Controller and migrating Ingress resources (Kubernetes objects that define HTTP routing rules), but no application code changes.
- Impact: High. Fixed hourly charges scaled linearly with NLB count, making savings predictable.
- Risk: Low. Amazon Route 53 weighted routing allowed gradual traffic shifts with rapid rollback by shifting DNS weight back to zero.
Establishing the Spend Baseline
The team analyzed 12 months of spend data and identified the cost distribution (see Figure 2).
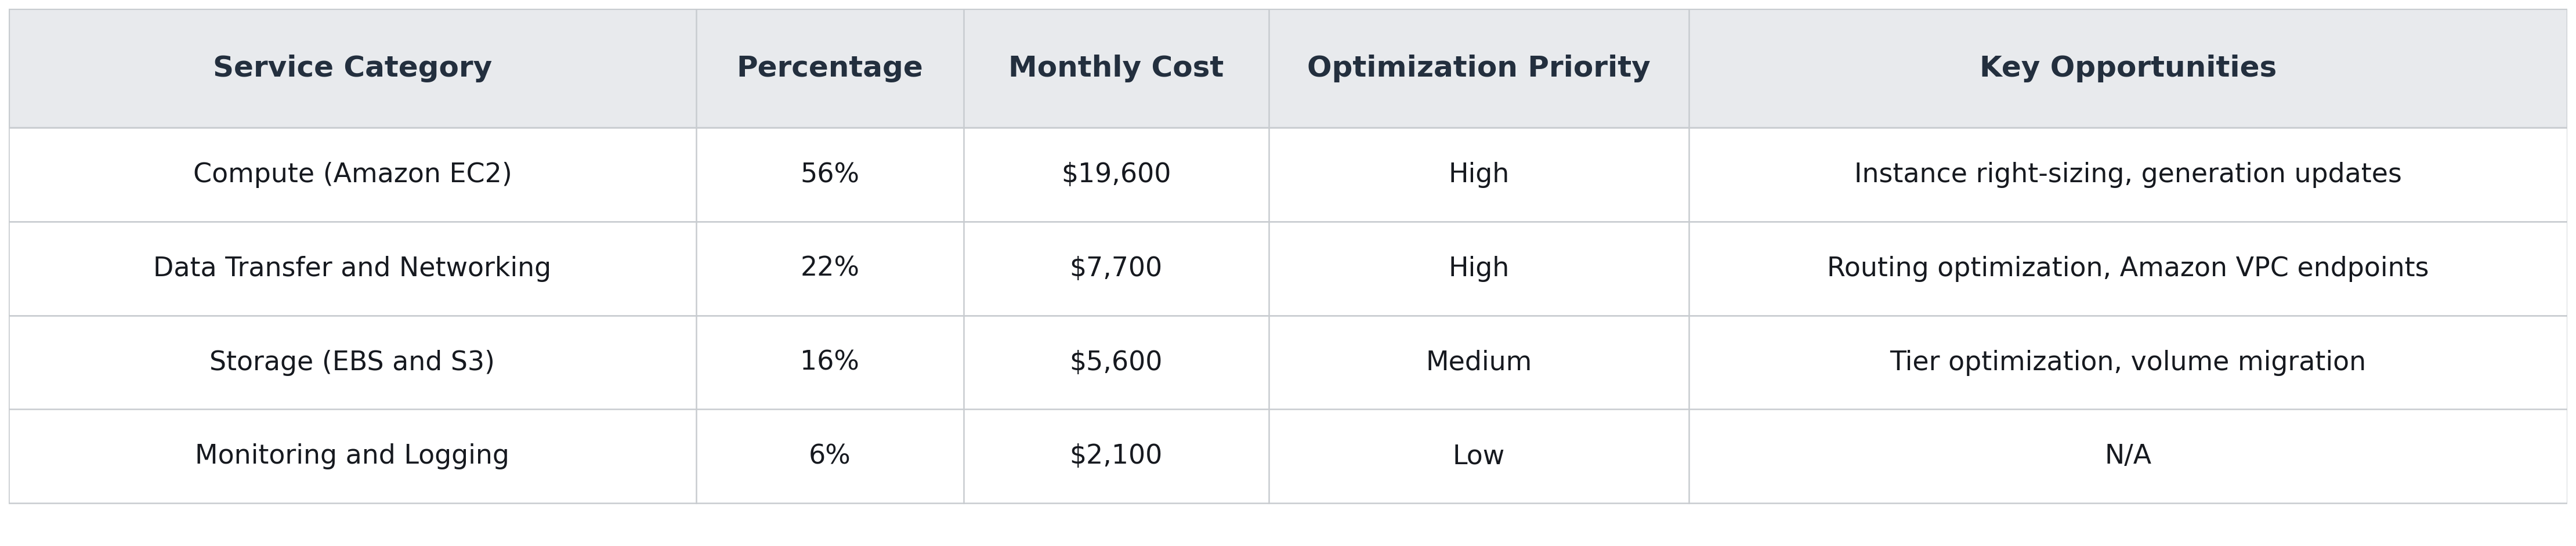
Figure 2. Baseline monthly cost distribution across service categories.
Implementing a Three-Phase Optimization Strategy
The team organized the strategy into three phases, ordered by the effort-versus-impact framework (see Figure 3).

Figure 3. Three-phase plan ordered by risk and effort level.
Phase 1: Foundation Optimization (Weeks 1–4)
Phase 1 prioritized storage, networking, and load balancing services.
For EBS storage, AWS Compute Optimizer identified more than 200 EBS gp2 volumes eligible for gp3 migration through its Upgrade EBS volume type recommended action. These volumes migrated online with no application impact.
For networking, the AWS Cost and Usage Reports (CUR) identified NAT gateway as a high-cost line item. The CUR Query Library provides ready-made queries for surfacing this kind of finding. Amazon Virtual Private Cloud (Amazon VPC) Flow Logs revealed 60% of NAT gateway traffic was bound for Amazon S3. Gateway endpoints for Amazon S3 rerouted that traffic within the AWS network, saving $2,400 per month.
S3 Intelligent-Tiering, configured next, saved another $1,200 per month by automatically transitioning objects 128 KB or larger between access tiers based on access patterns.
Load Balancer Consolidation: More than 150 NLBs to Five ALBs
Load balancer consolidation was one of the highest-impact Phase 1 optimizations. Each microservice in the Amazon Elastic Kubernetes Service (Amazon EKS) cluster used a Service of type LoadBalancer, which provisioned a dedicated Network Load Balancer (NLB) by default. Because NLBs operate at Layer 4 (TCP/UDP) and don’t support host-based or path-based HTTP routing, each HTTP service required its own NLB. The result is shown in Figure 4: more than 150 NLBs, each incurring a fixed hourly charge regardless of traffic volume.
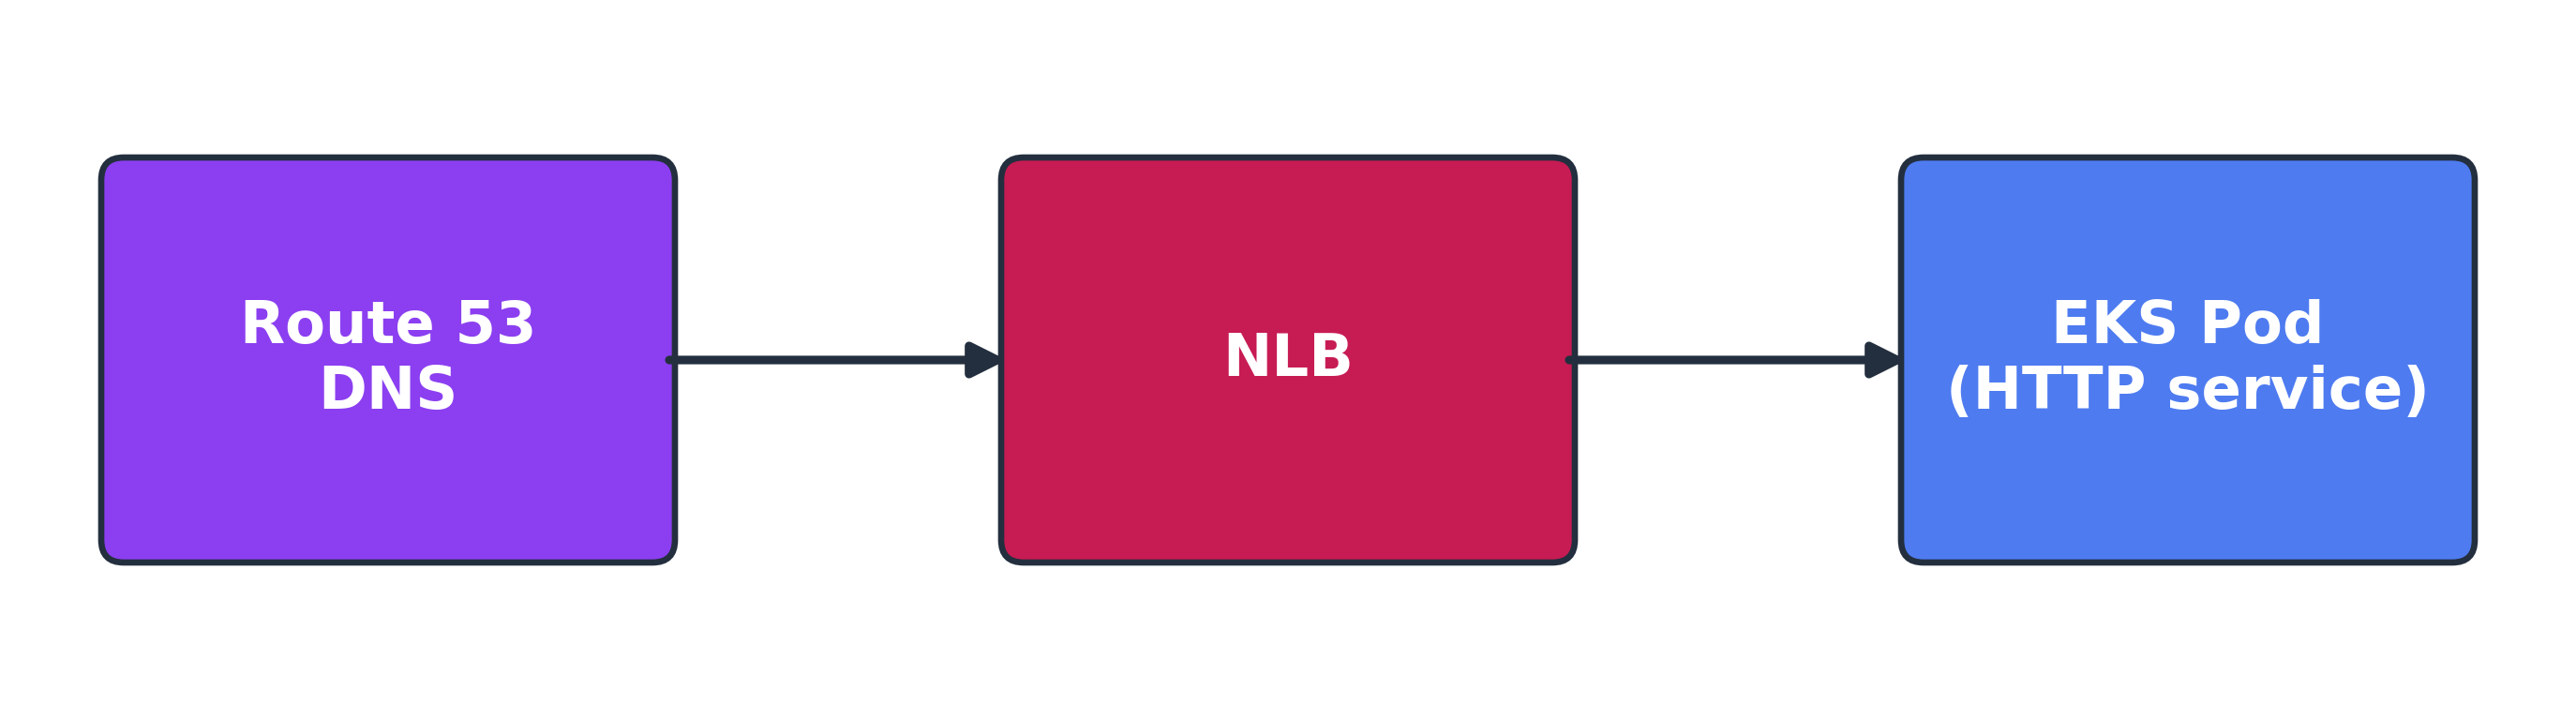
Figure 4. Before-state — Route 53 DNS routes to a dedicated Network Load Balancer, which routes to an Amazon EKS pod. This pattern repeats for each HTTP service.
The solution was to migrate from NLBs to ALBs, which support host-based and path-based routing (see Figure 5).
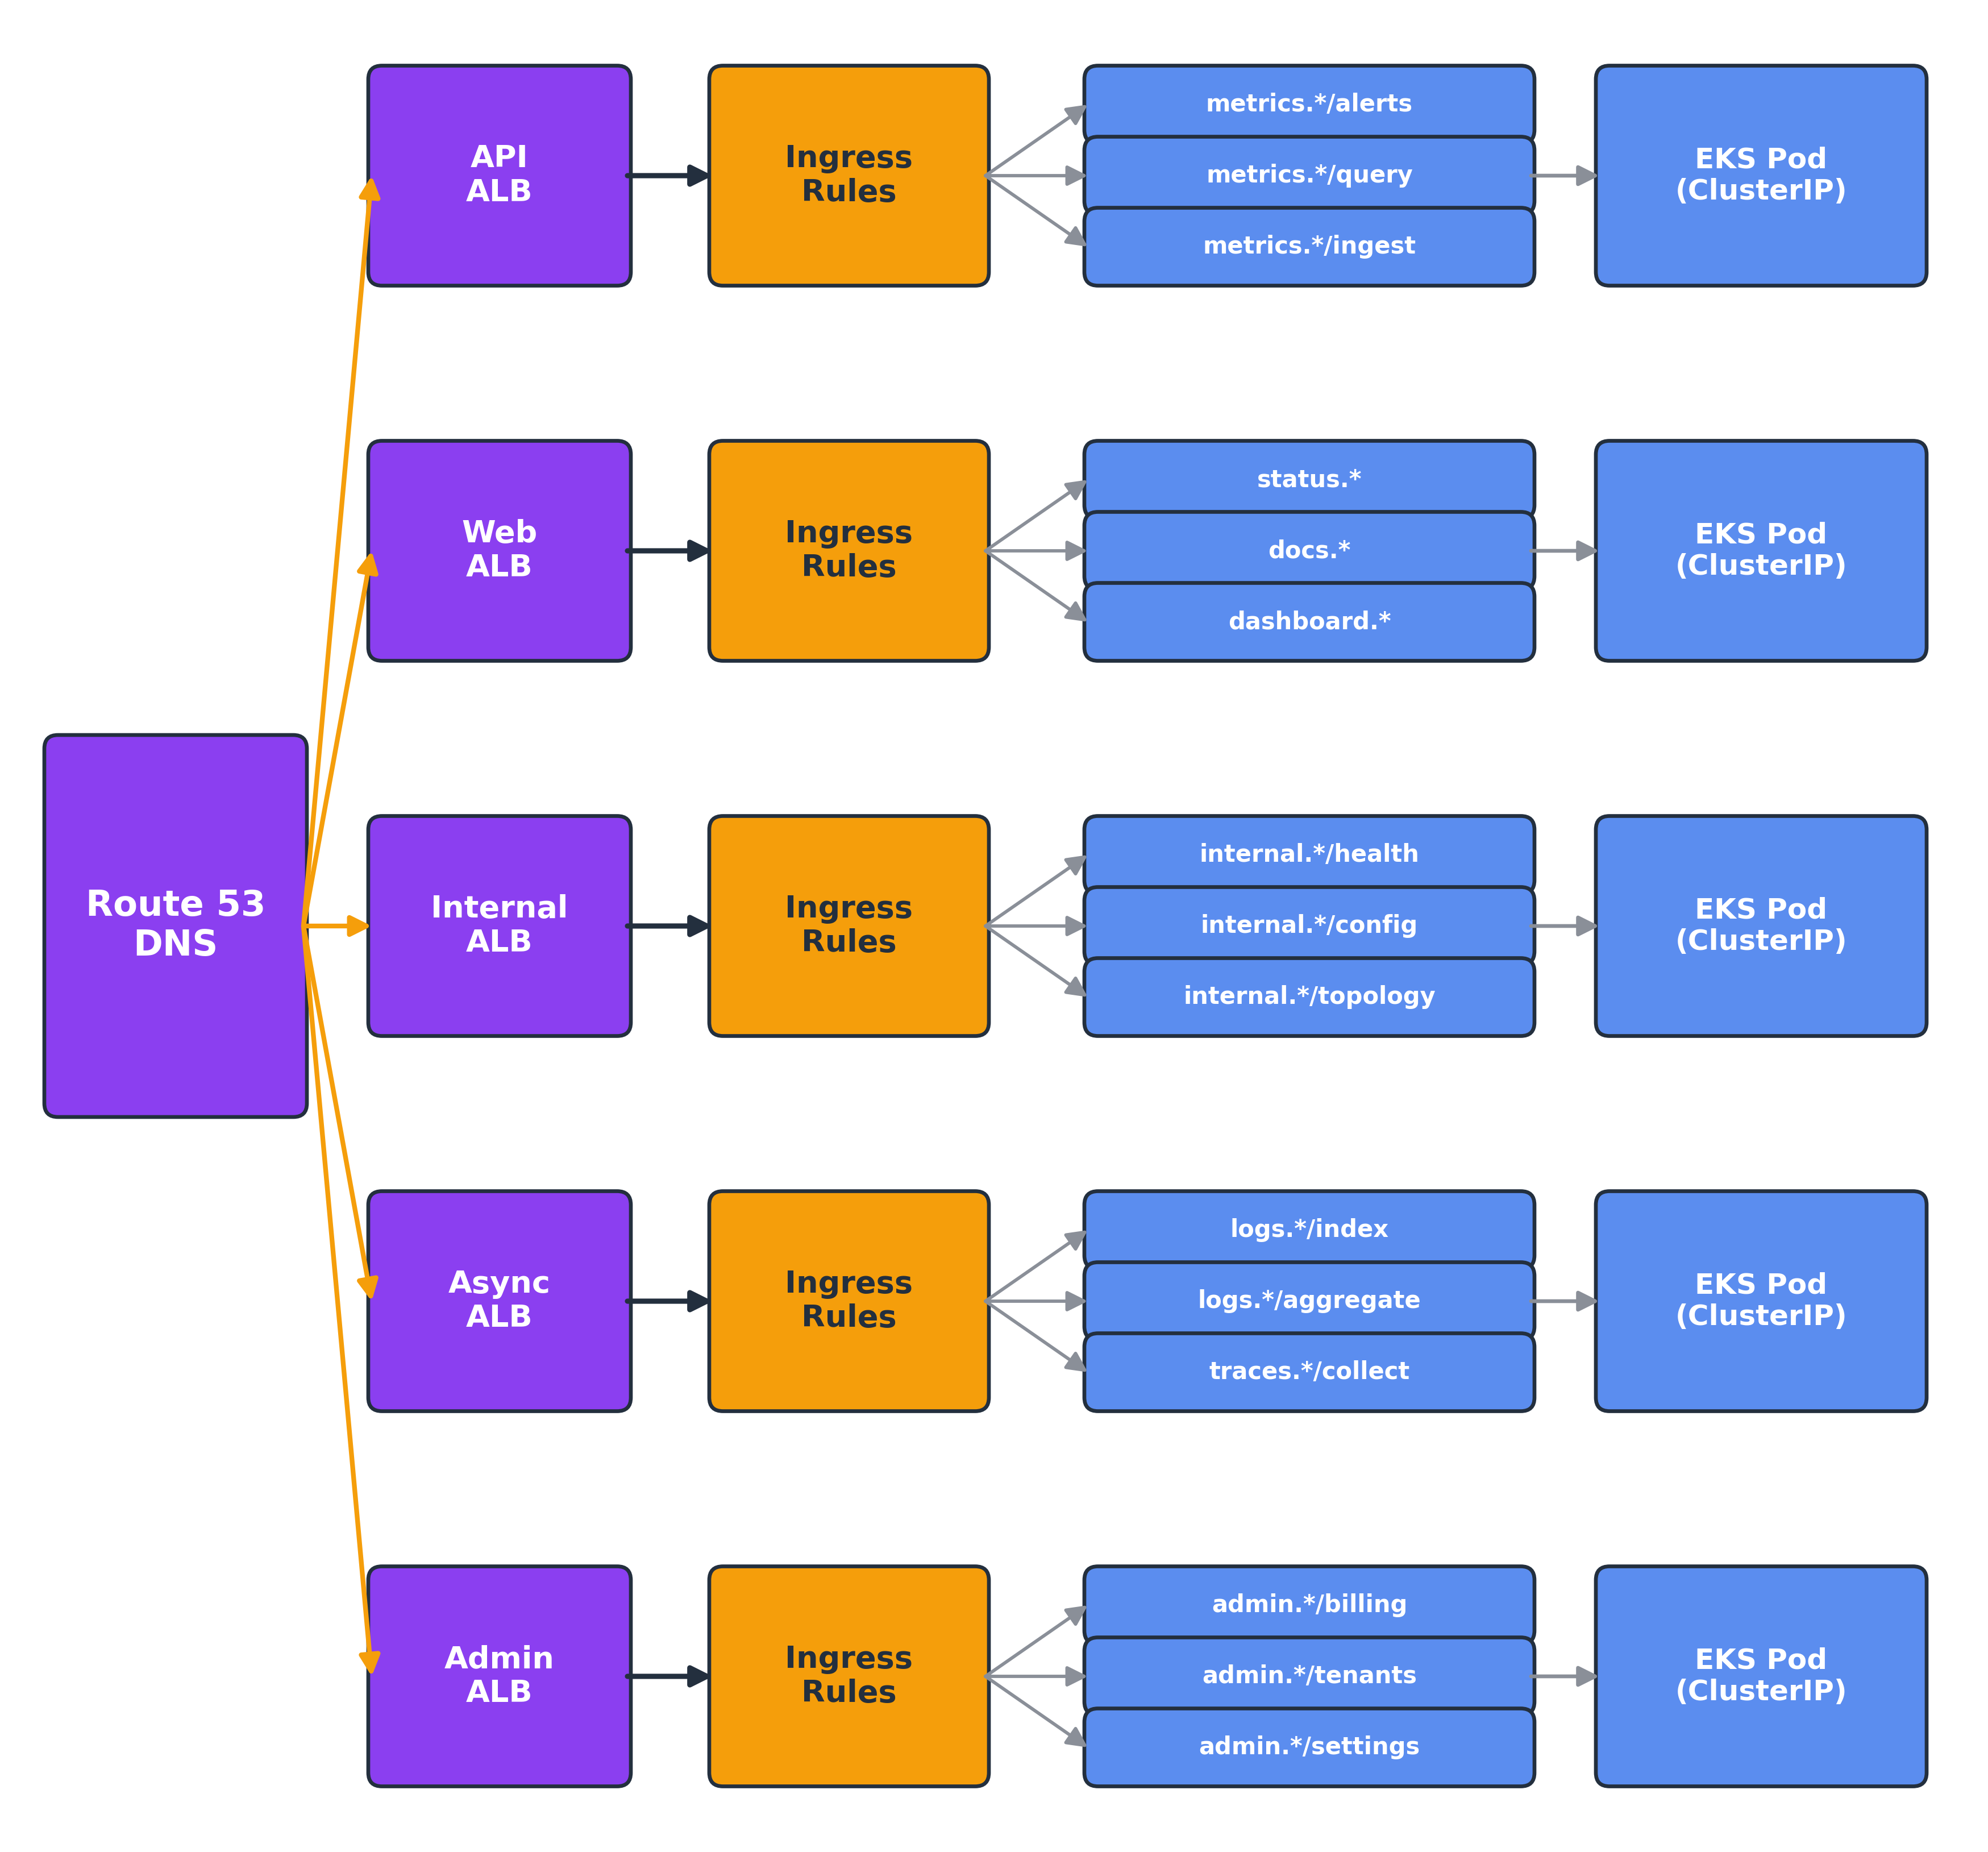
Figure 5. After-state — Route 53 DNS routes to five domain-grouped Application Load Balancers, each using Ingress rules to route by host and path to Amazon EKS pods.
The team grouped services into five ALBs by domain boundary: API, Web, Internal, Async, and Admin. Each group mapped to a product domain. For example, API handled metrics ingestion and query, while Async handled traces and log processing.
Each ALB supports up to 100 routing rules. With approximately 30 services per domain group, the team stayed well within this quota while leaving room for growth. Grouping by domain also simplified SSL certificate management: each ALB used a single AWS Certificate Manager (ACM) wildcard certificate for its domain (such as *.metrics.example.com).
The team migrated services in four stages:
- Catalog: Inventoried the more than 150 NLBs, mapping each to its Kubernetes Service, host name, traffic volume, and health check configuration.
- Group: Organized services into five Ingress groups by domain. Each Ingress resource defined host-header conditions (such as metrics.example.com, dashboard.example.com) and path-based routing rules (such as /ingest/* → metrics ingest service, /query/* → metrics query service). The AWS Load Balancer Controller watches for Ingress resources and translates them into ALB listener rules when applied to the cluster.
- Migrate in waves: The team created the Ingress resource on the new ALB. Traffic shifted gradually using Amazon Route 53 weighted routing: 10%, then 50%, then 100%. At each stage, the team monitored error rates and latency before proceeding. After traffic was fully on the new ALB, the team switched the Service from type
LoadBalancerto typeClusterIP, deprovisioning the old NLB. - Validate: Confirmed target group health checks, connection draining, and sticky session behavior on the consolidated ALBs.
The zero-downtime migration removed more than 150 NLBs, saving roughly $3,400 per month in fixed hourly charges and cutting the operational overhead of managing that many resources.
Phase 1 delivered foundational wins of approximately $8,400 in monthly savings, cutting the total bill by 24% within four weeks.
Phase 2: Infrastructure Intelligence, Compute Right-Sizing (Weeks 4–8)
With Phase 1 savings secured, attention shifted to higher-complexity compute optimizations. AWS Compute Optimizer identified memory-bound workloads running on general-purpose instances and recommended memory-optimized alternatives, accounting for both performance and cost in the recommendation. Workloads showed 45% average CPU but 85% memory utilization. The balanced vCPU-to-memory ratio of m5.4xlarge instances meant paying for idle compute capacity. Switching to r6a.2xlarge provided the same 64 GiB memory at lower cost by dropping to eight vCPUs. After A/B testing confirmed comparable response times, throughput, and error rates, 20 instances were migrated. Had performance degraded, the team would have reverted the launch template to m5.4xlarge, chosen not for cost-effectiveness, but because it was the baseline type across the un-migrated fleet, making it the lowest-risk revert. Terminating the r6a instances would then trigger Amazon EC2 Auto Scaling to launch replacements from the updated template.
Phase 3: Next-Generation Architecture, Advanced Optimization (Weeks 8–12)
Phase 3 introduced Karpenter (an open source Kubernetes node provisioner) to automate node lifecycle management and right-size workloads based on demand.
Karpenter also drove the AWS Graviton migration. The team implemented multi-architecture container builds (container images that run on both x86 and arm64), then migrated a different 20-instance group, the Graviton-eligible workloads, from r6i.2xlarge to r6g.2xlarge, based on AWS Graviton2. The migration delivered approximately 20% cost savings with performance that met the team’s requirements.
The team updated the NodePool, the node configuration object for Karpenter, to prioritize AWS Graviton instance types. The Karpenter Disruption Controller, the node replacement mechanism for Karpenter, then drained and replaced existing nodes with instances based on AWS Graviton2. To roll back, update the NodePool to reprioritize x86 instance types. The Disruption Controller will then replace nodes with x86 instances on the next disruption cycle. For a detailed walkthrough of this pattern, see Migrating from x86 to AWS Graviton on Amazon EKS using Karpenter.
Results and Long-Term Impact
The total effort delivered $13,700 in monthly savings (a 39% reduction) as shown in Figure 6.
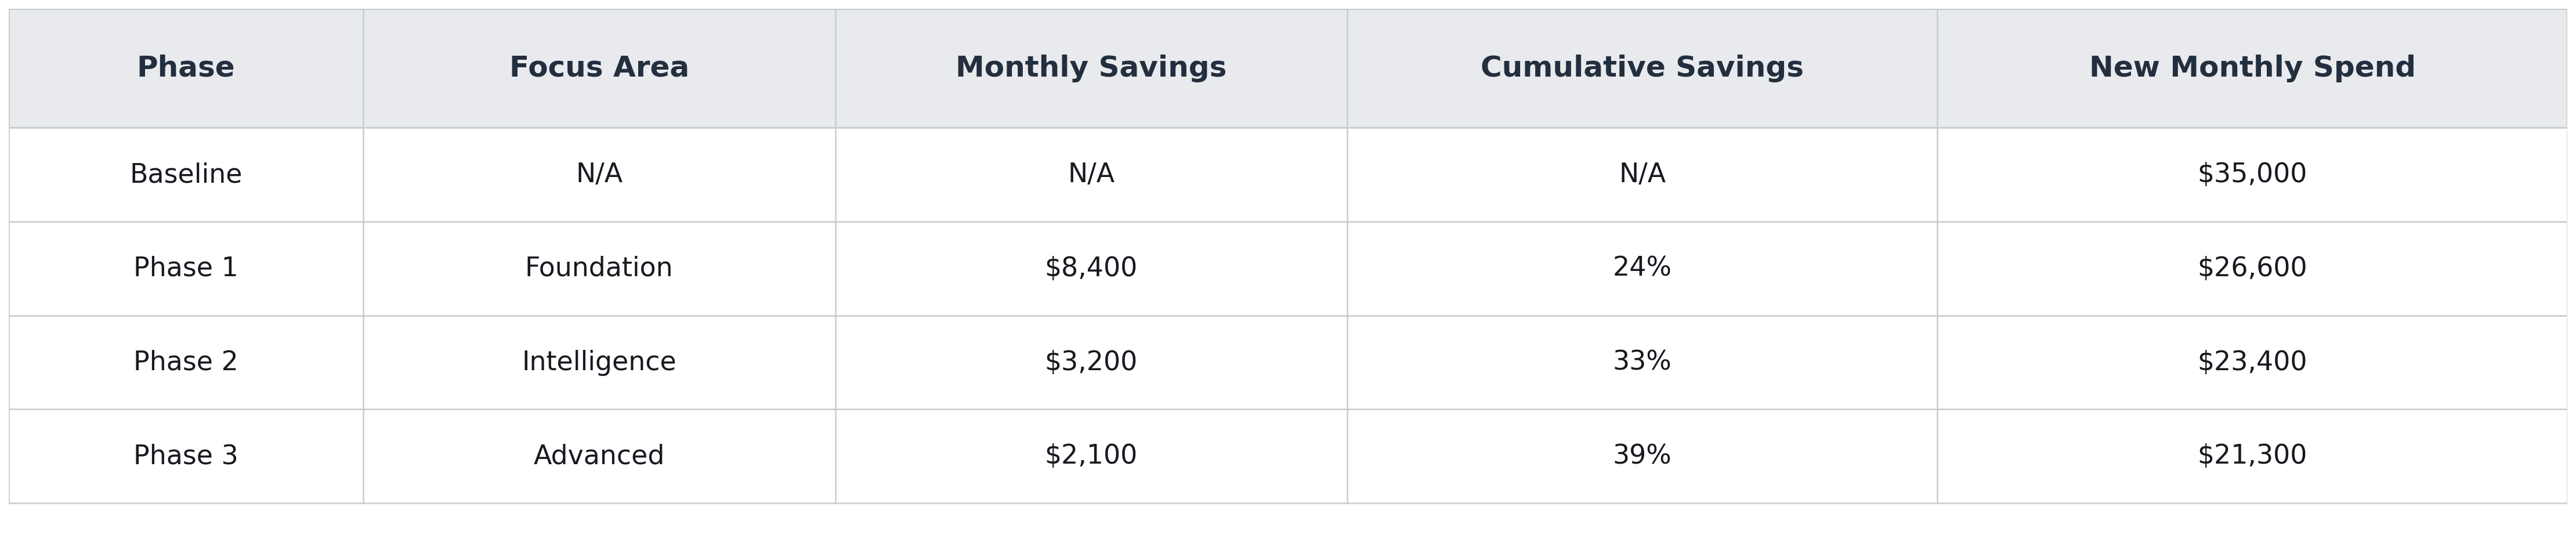
Figure 6. Monthly savings delivered across the three phases.
At the projected 10x scale ($350,000/month), these percentage-based savings represent approximately $1.64 million in projected annual savings.
Sustaining Savings with Governance
Cost optimization holds only when new resources can’t reintroduce the old waste. To sustain these savings, the team integrated cost reviews into sprint planning. The team also implemented service control policies (SCPs) in AWS Organizations to restrict launches to approved instance families and AWS Regions, and to prevent gp2 volume creation.
Conclusion
You can apply this three-phase methodology to sequence AWS cost optimizations by risk, effort, and dependency. It starts with AWS Cost Optimization Hub for standard recommendations, then layers custom scoring on architectural changes. Load balancer consolidation, surfaced through that custom scoring, saved roughly $3,400 per month. If you run Kubernetes environments where each Service provisions its own load balancer, you can identify a similar consolidation opportunity.
To begin your own cost reduction program:
- Identify high-impact cost reduction opportunities by activating AWS Cost Optimization Hub in your account, then extend it with custom scoring for architectural changes.
- Review the AWS Well-Architected Framework Cost Optimization pillar for a comprehensive framework to guide your cost reduction decisions.
- Review the AWS Load Balancer Controller documentation to plan NLB-to-ALB consolidation if you run Amazon EKS with multiple load balancers.
- Run AWS Compute Optimizer on your Amazon EC2 fleet and Amazon EBS volumes to identify right-sizing, GP2-to-GP3 migration, and AWS Graviton migration opportunities.
- Codify your wins with service control policies (SCPs) in AWS Organizations and recurring cost reviews, so new resources can’t reintroduce the savings you removed.