AWS Big Data Blog
Building a real-time ICU patient analytics pipeline with AWS Lambda event source mapping
In hospital intensive care units (ICUs), continuous patient monitoring is critical. Medical devices generate vast amounts of real-time data on vital signs such as heart rate, blood pressure, and oxygen saturation. The key challenge lies in early detection of patient deterioration through vital sign trending. Healthcare teams must process thousands of data points daily per patient to identify concerning patterns, a task crucial for timely intervention and potentially life-saving care.
AWS Lambda event source mapping can help in this scenario by automatically polling data streams and triggering functions in real-time without additional infrastructure management. By using AWS Lambda for real-time processing of sensor data and storing aggregated results in secure data structures designed for large analytic datasets called Iceberg tables in Amazon Simple Storage Service (Amazon S3) buckets, medical teams can achieve both immediate alerting capabilities and gain long-term analytical insights, enhancing their ability to provide timely and effective care.
In this post, we demonstrate how to build a serverless architecture that processes real-time ICU patient monitoring data using Lambda event source mapping for immediate alert generation and data aggregation, followed by persistent storage in Amazon S3 with an Iceberg catalog for comprehensive healthcare analytics. The solution demonstrates how to handle high-frequency vital sign data, implement critical threshold monitoring, and create a scalable analytics platform that can grow with your healthcare organization’s needs and help monitor sensor alert fatigue in the ICU.
Architecture
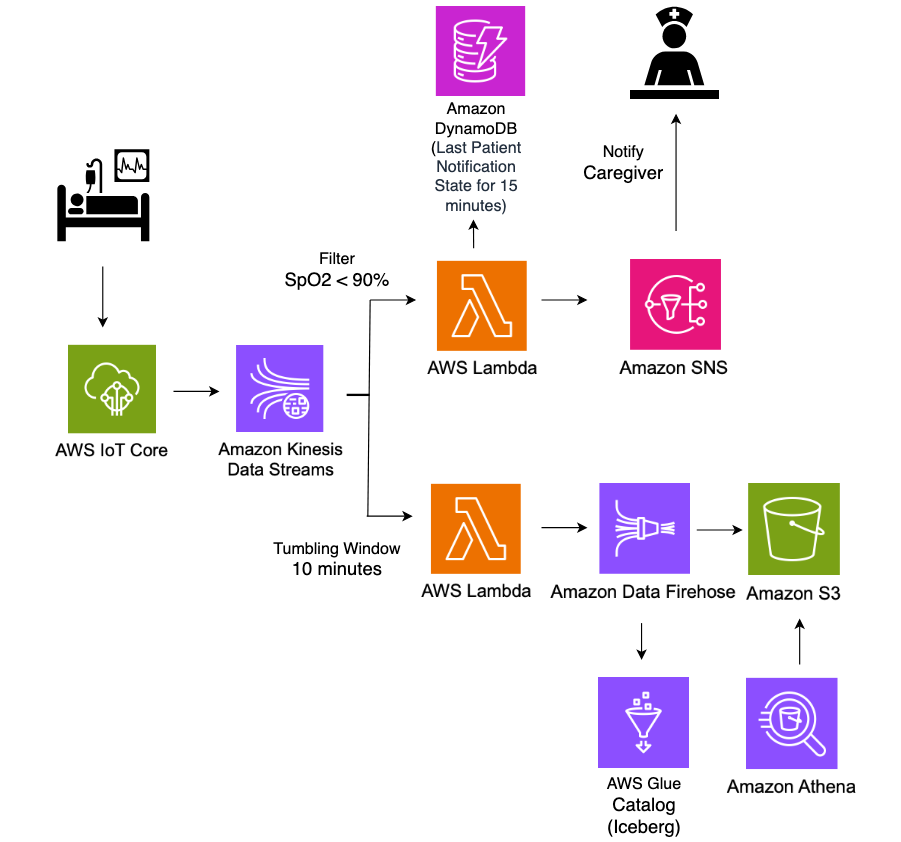
The following architecture diagram illustrates a real-time ICU patient analytics system.

In this architecture, real-time patient monitoring data from hospital ICU sensors is ingested into AWS IoT Core, which then streams the data into Amazon Kinesis Data Streams. Two Lambda functions consume this streaming data concurrently for different purposes, both using Lambda event source mapping integration with Kinesis Data Streams. The first Lambda function uses the filtering feature of event source mapping to detect critical health events where SpO2(blood oxygen saturation) levels fall below 90%, immediately triggering notifications to caregivers through Amazon Simple Notification Service (Amazon SNS) for rapid response. The second Lambda function employs the tumbling window feature of event source mapping to aggregate sensor data over 10-minute time intervals. This aggregated data is then systematically stored in S3 buckets in Apache Iceberg format for historical analysis and reporting. The entire pipeline operates in a serverless manner, providing scalable, real-time processing of critical healthcare data while maintaining both immediate alerting capabilities and long-term data storage for analytics.
Amazon S3 data, with its support for Apache Iceberg table format, enables healthcare organizations to efficiently store and query large volumes of time-series patient data. This solution allows for complex analytical queries across historical patient data while maintaining high performance and cost efficiency.
Prerequisites
To implement the solution provided in this post, you should have the following:
- An active AWS account
- IAM permissions to deploy CloudFormation templates and provision AWS resources
- Python installed on your machine to run the ICU patient sensor data simulator code
Deploy a real-time ICU patient analytics pipeline using CloudFormation
You use AWS CloudFormation templates to create the resources for a real-time data analytics pipeline.
- To get started, Sign in to the console as Account user and select the appropriate Region.
- Download and launch CloudFormation template where you want to host the Lambda functions.
- Choose Next.
- On the Specify stack details page, enter a Stack name (for example, IoTHealthMonitoring).
- For Parameters, enter the following:
- IoTTopic: Enter the MQTT topic for your IoT devices (for example,
icu/sensors). - EmailAddress: Enter an email address for receiving notifications.
- IoTTopic: Enter the MQTT topic for your IoT devices (for example,
- Wait for the stack creation to complete. This process might take 5-10 minutes.
- After the CloudFormation stack completes, it creates following resources:
- An AWS IoT Core rule to capture data from the specified IoTTopic topic and routes it to Kinesis data stream.
- A Kinesis data stream for ingesting IoT sensor data.
- Two Lambda functions:
FilterSensorData: Monitors critical health metrics and sends alerts.AggregateSensorData: Aggregates sensor data in 10 minutes window.
- An Amazon DynamoDB table (
NotificationTimestamps) to store notification timestamps for rate limiting alerts. - An Amazon SNS topic and subscription to send email notifications for critical patient conditions.
- An Amazon Data Firehose delivery stream to deliver processed data to Amazon S3 using Iceberg format.
- Amazon S3 buckets to store sensor data.
- Amazon Athena and AWS Glue resources for the database and an Iceberg table for querying aggregated data.
- AWS Identity and Access Management (IAM) roles and policies to support required permissions for Amazon IoT rules, Lambda functions, and Data Firehose streams.
- Amazon CloudWatch log groups to record for Kinesis Firehose activity and Lambda functions.
Solution walkthrough
Now that you’ve deployed the solution, let’s review a functional walkthrough. First, simulate patient vital signs data and send it to AWS IoT Core using the following Python code on your local machine. To run this code successfully, ensure you have the necessary IAM permissions to publish messages to the IoT topic in the AWS account where the solution is deployed.
The following is the format of a sample ICU sensor message produced by the simulator.
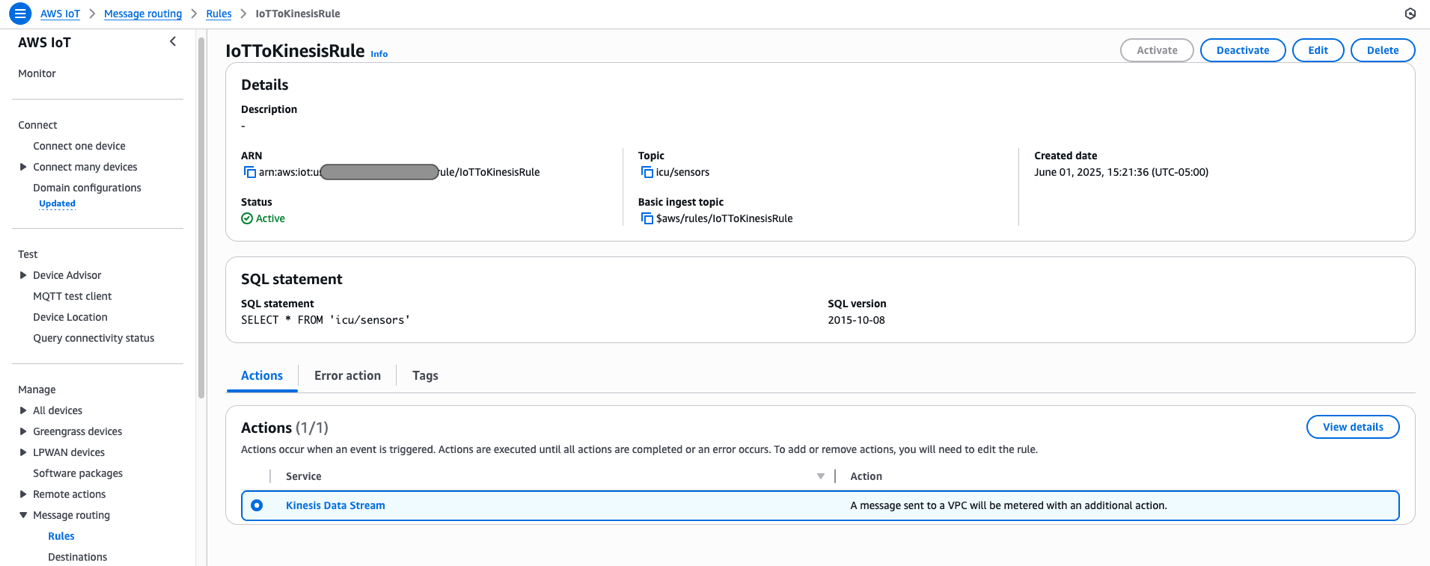
Data is published to the icu/sensors IoT topic every 30 seconds for 10 different patients, creating a continuous stream of ICU patient monitoring data. Messages published to AWS IoT Core are passed to Kinesis Data Streams using the following message routing rule deployed by our solution.

Two Lambda functions consume data from Data Streams concurrently, both using the Lambda event source mapping integration with Kinesis Data Streams.
Event source mapping
Lambda event source mapping automatically triggers Lambda functions in response to data changes from supported event sources like Amazon DynamoDB Streams, Amazon Kinesis Data Streams, Amazon Simple Queue Service (Amazon SQS), Amazon MQ, and Amazon Managed Streaming for Apache Kafka. This serverless integration works by having Lambda poll these sources for new records, which are then processed in configurable batch sizes ranging from 1 to 10,000 records. When new data is detected, Lambda automatically invokes the function synchronously, handling the scaling automatically based on the workload. The service supports at-least-once delivery and provides robust error handling through retry policies and dead-letter queues for failed events. Event source mappings can be fine-tuned through various parameters such as batch windows, maximum record age, and retry attempts, making them highly adaptable to different use cases. This feature is particularly valuable in event-driven architectures, so that customers can focus on business logic while AWS manages the complexities of event processing, scaling, and reliability.
Event source mapping uses tumbling windows and filtering to process and analyze data.
Tumbling windows
Tumbling windows in Lambda event processing enable data aggregation in fixed, non-overlapping time intervals, where each event belongs to exactly one window. This is ideal for time-based analytics and periodic reporting. When combined with event source mapping, this approach allows efficient batch processing of events within defined time periods (for example, 10-minute windows), enabling calculations such as average vital signs or cumulative fluid intake and output while optimizing function invocations and resource usage.
When you configure an event source mapping between Kinesis Data Streams and a Lambda function, use the Tumbling Window Duration setting, which appears in the trigger configuration in the Lambda console. The solution you deployed using the CloudFormation template includes the AggregateSensorData Lambda function, which uses a 10-minute tumbling window configuration. Depending on the volume of messages flowing through the Amazon Kinesis stream, the AggregateSensorData function can be invoked multiple times for each 10-minute window, sequentially, with the following attributes in the event supplied to the function.
- Window start and end: The beginning and ending timestamps for the current tumbling window.
- State: An object containing the state returned from the previous window, which is initially empty. The state object can contain up to 1 MB of data.
- isFinalInvokeForWindow: Indicates if this is the last invocation for the tumbling window. This only occurs once per window period.
- isWindowTerminatedEarly: A window ends early only if the state exceeds the maximum allowed size of 1 MB.
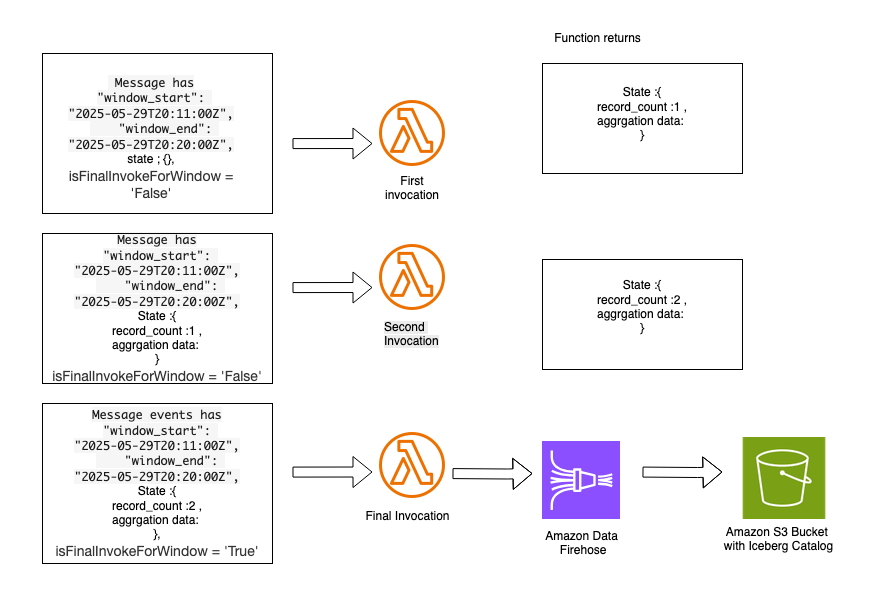
In a tumbling window, there is a series of Lambda invocations in the following pattern:

AggregateSensorData Lambda code snippet:
- The first invocation contains an empty state object in the event. The function returns a state object containing custom attributes that are specific to the custom logic in the aggregation.
- The second invocation contains the state object provided by the first Lambda invocation. This function returns an updated state object with new aggregated values. Subsequent invocations follow this same sequence. Following is a sample of the aggregated state, which can be supplied to subsequent Lambda invocations within the same 10-minute tumbling window.
- The final invocation in the tumbling window has the
isFinalInvokeForWindowflag set to the true. This contains the state returned by the most recent Lambda invocation. This invocation is responsible for passing aggregated state messages to the Data Firehose stream, which delivers data to the Amazon S3 bucket using Iceberg data format. - After the aggregated data is sent to Amazon S3, you can query the data using Athena.
Sample result of the preceding Athena query:

Event source mapping with filtering
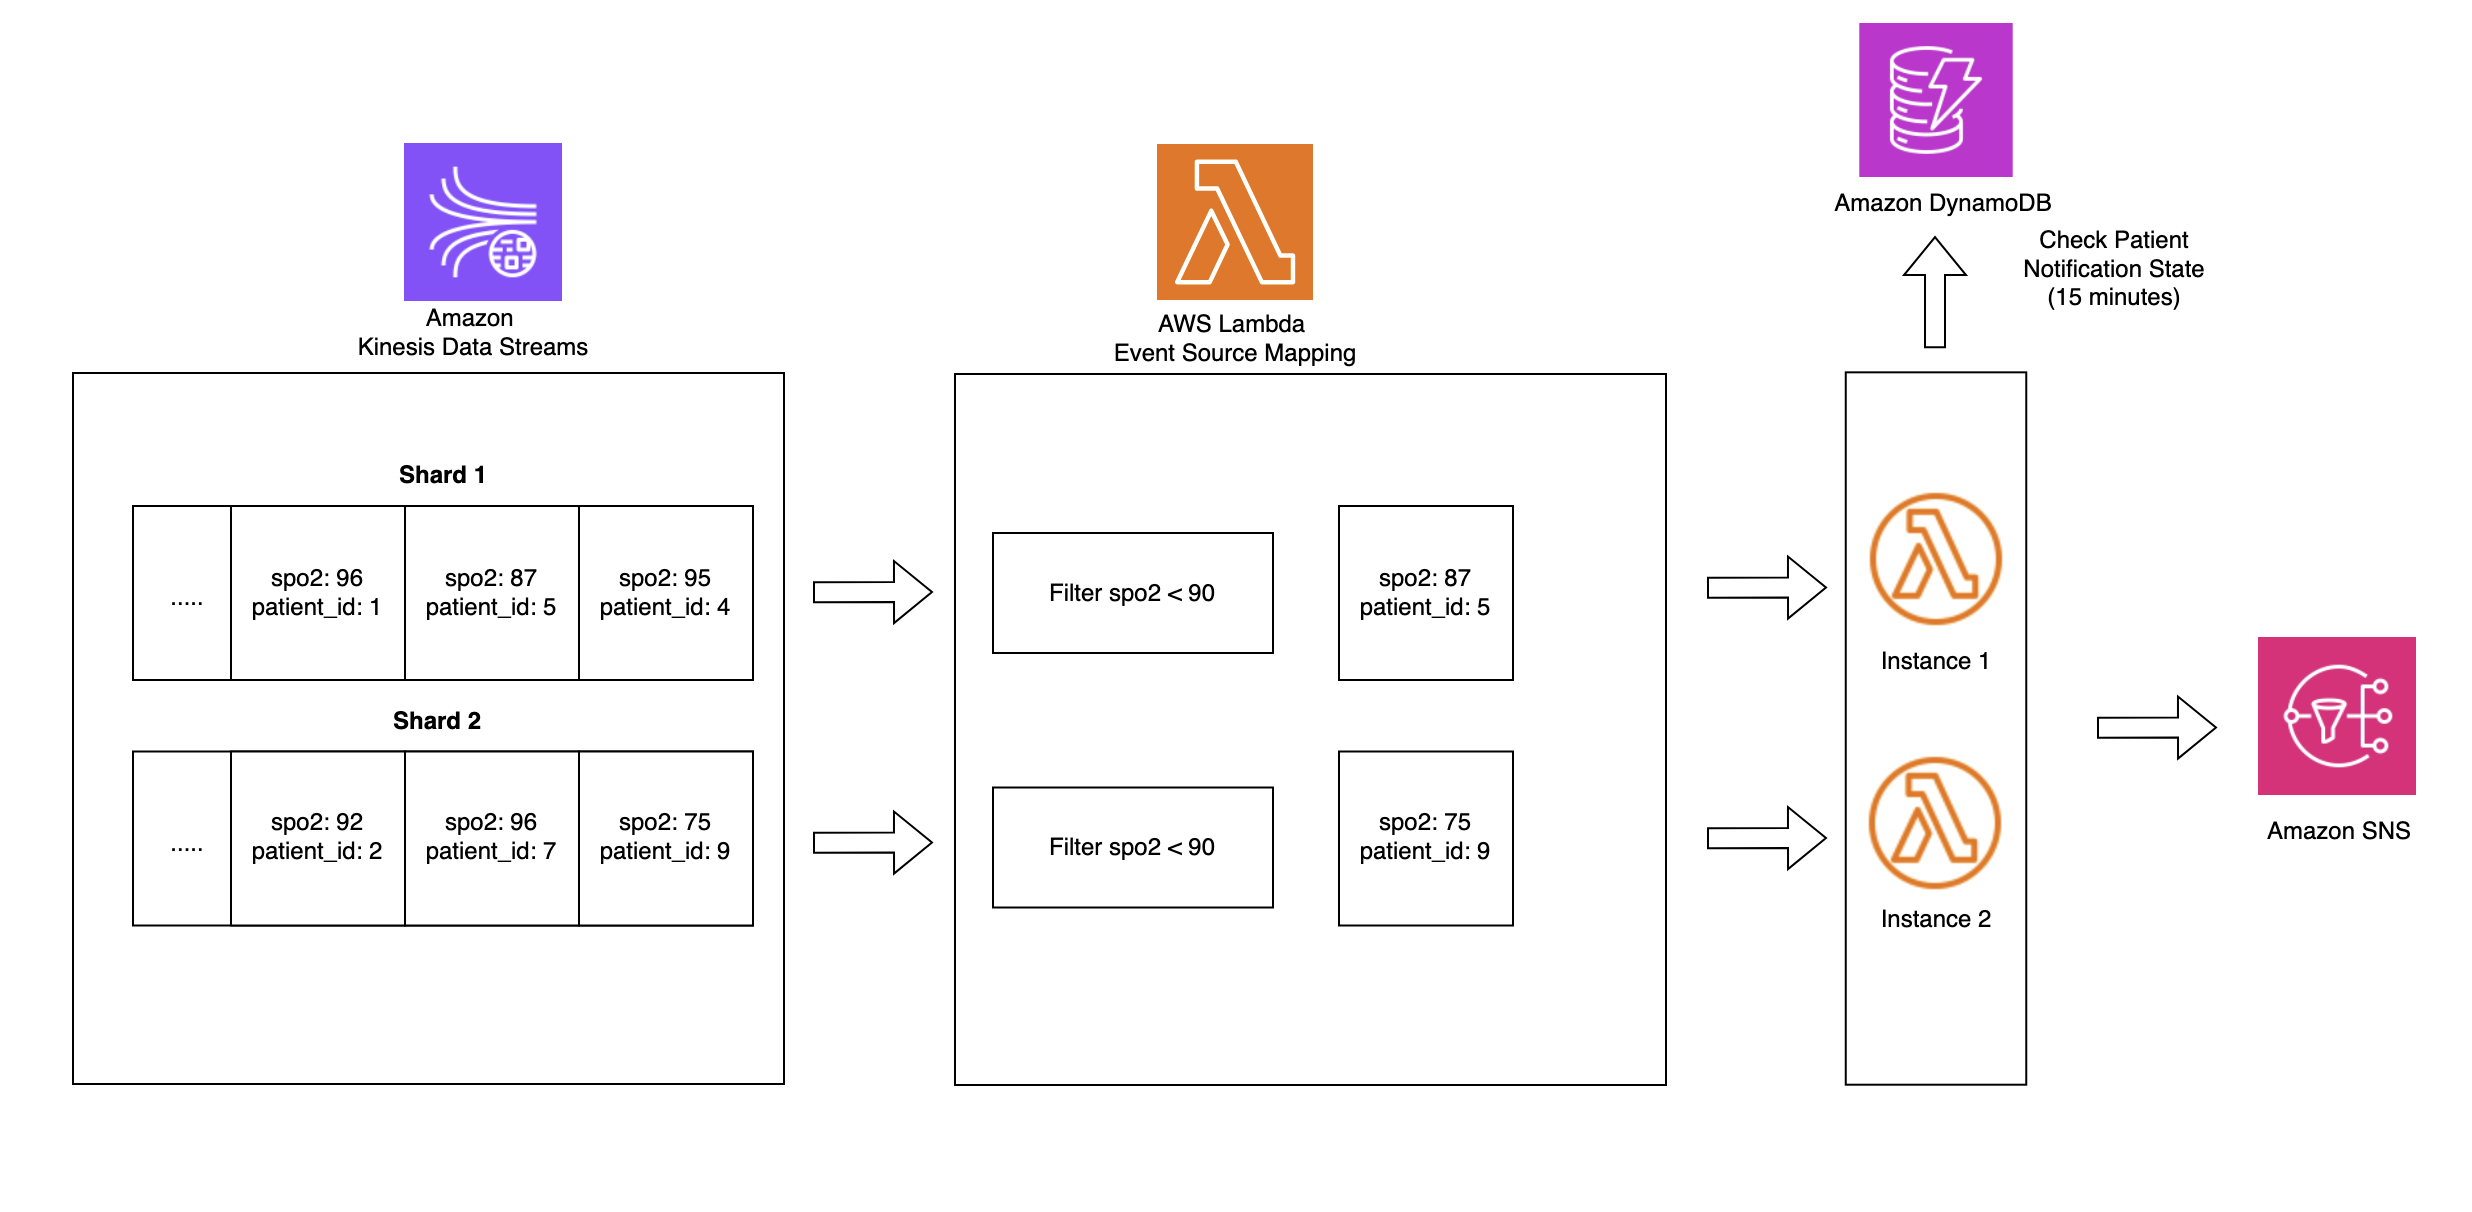
Lambda event source mapping with filtering optimizes data processing from sources like Amazon Kinesis by applying JSON pattern filtering before function invocation. This is demonstrated in the ICU patient monitoring solution, where the system filters for SpO2 readings from Kinesis Data Streams that are below 90%. Instead of processing all incoming data, the filtering capability is used to selectively processes only critical readings, significantly reducing costs and processing overhead. The solution uses DynamoDB for sophisticated state management, tracking low SpO2 events through a schema combining PatientID and timestamp-based keys within defined monitoring windows.
This state-aware implementation balances clinical urgency with operational efficiency by sending immediate Amazon SNS notifications when critical conditions are first detected while implementing a 15-minute alert suppression window to prevent alert fatigue among healthcare providers. By maintaining state across multiple Lambda invocations, the system helps ensure rapid response to potentially life-threatening situations while minimizing unnecessary notifications for the same patient condition. The integration of Lambda’event filtering, DynamoDB state management, and reliable alert delivery provided by Amazon SNS creates a robust, scalable healthcare monitoring solution that exemplifies how AWS services can be strategically combined to address complex requirements while balancing technical efficiency with clinical effectiveness.

Filter sensor data Lambda code snippet:
To generate an alert notification through the deployed solution, update the preceding simulator code by setting the SpO2 value to less than 90 and run it again. Within 1 minute, you should receive an alert notification at the email address you provided during stack creation. The following image is an example of an alert notification generated by the deployed solution.

Clean up
To avoid ongoing costs after completing this tutorial, delete the CloudFormation stack that you deployed earlier in this post. This will remove most of the AWS resources created for this solution. You might need to manually delete objects created in Amazon S3, because CloudFormation won’t remove non-empty buckets during stack deletion.
Conclusion
As demonstrated in this post, you can build a serverless real-time analytics pipeline for healthcare monitoring by using AWS IoT Core, Amazon S3 buckets with iceberg format, and Amazon Kinesis Data Streams integration with AWS Lambda event source mapping. This architectural approach eliminates the need for complex code while enabling rapid critical patient care alerts and data aggregation for analysis using Lambda. The solution is particularly valuable for healthcare organizations looking to modernize their patient monitoring systems with real-time capabilities. The architecture can be extended to handle various medical devices and sensor data streams, making it adaptable for different healthcare monitoring scenarios. This post presents one implementation approach, and organizations adopting this solution should ensure the architecture and code meets their specific application performance, security, privacy, and regulatory compliance needs.
If this post helps you or inspires you to solve a problem, we would love to hear about it!