AWS Compute Blog
Building well-architected serverless applications: Understanding application health – part 1
This series of blog posts uses the AWS Well-Architected Tool with the Serverless Lens to help customers build and operate applications using best practices. In each post, I address the nine serverless-specific questions identified by the Serverless Lens along with the recommended best practices. See the Introduction post for a table of contents and explaining the example application.
Question OPS1: How do you evaluate your serverless application’s health?
Evaluating your metrics, distributed tracing, and logging gives you insight into business and operational events, and helps you understand which services should be optimized to improve your customer’s experience. By understanding the health of your Serverless Application, you will know whether it is functioning as expected, and can proactively react to any signals that indicate it is becoming unhealthy.
Required practice: Understand, analyze, and alert on metrics provided out of the box
It is important to understand metrics for every AWS service used in your application so you can decide how to measure its behavior. AWS services provide a number of out-of-the-box standard metrics to help monitor the operational health of your application.
As these metrics are generated automatically, it is a simple way to start monitoring your application and can also be augmented with custom metrics.
The first stage is to identify which services the application uses. The airline booking component uses AWS Step Functions, AWS Lambda, Amazon SNS, and Amazon DynamoDB.
When I make a booking, as shown in the Introduction post, AWS services emit metrics to Amazon CloudWatch. These are processed asynchronously without impacting the application’s performance.
There are two default CloudWatch dashboards to visualize key metrics quickly: per service and cross service.
Per service
To view the per service metrics dashboard, I open the CloudWatch console.
Per service metrics dashboard
I select a service where Overview is shown, such as Lambda. Now I can view the metrics for all Lambda functions in the account.
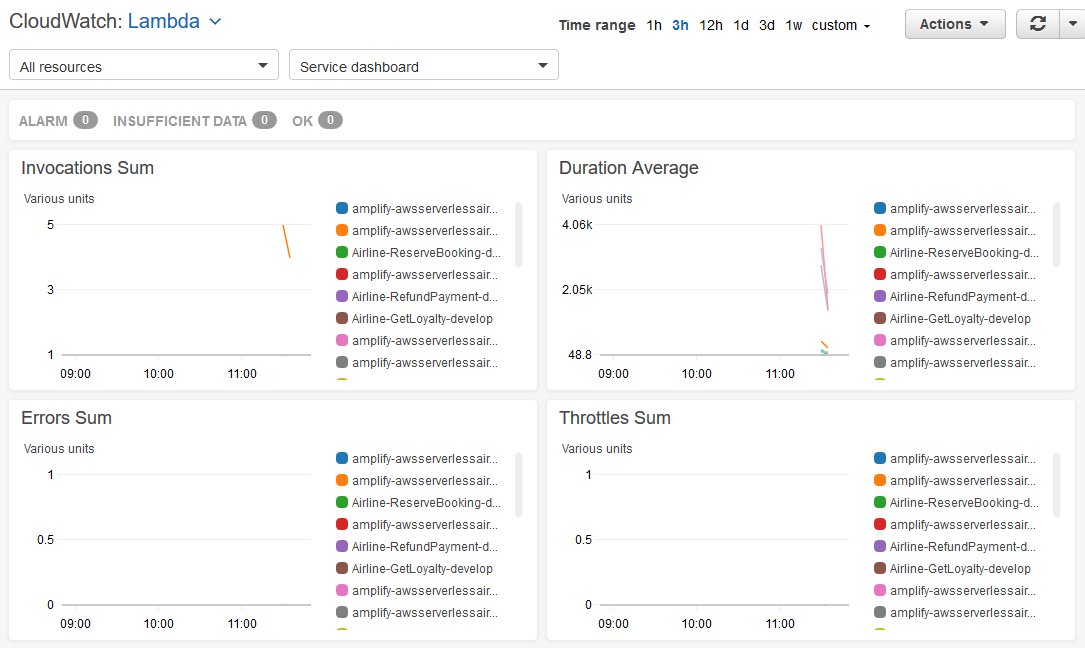
Per service metrics for lambda
Cross service
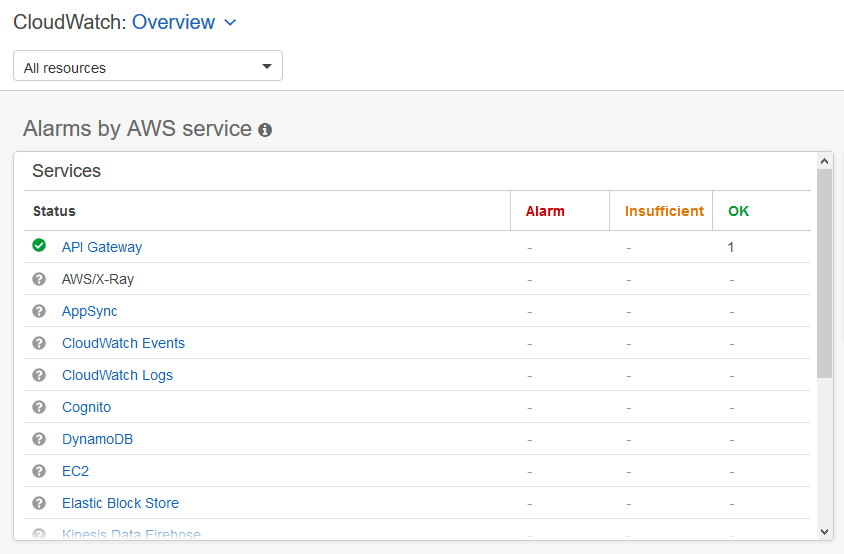
To see an overview of key metrics across all AWS services, open the CloudWatch console and choose View cross service dashboard.

Cross service metrics dashboard
I see a list of all services with one or two key metrics displayed. This provides a good overview of all services your application uses.
Alerting
The next stage is to identify the key metrics for comparison and set up alerts for under- and over-performing services. Here are some recommended metrics to alarm on for a number of AWS services.
Alerts can be configured manually or via infrastructure as code tools such as the AWS Serverless Application Model, AWS CloudFormation, or third-party tools.
To configure a manual alert for Lambda function errors using CloudWatch Alarms:
- I open the CloudWatch console and select Alarms and select Create Alarm.
- I choose Select Metric and from AWS Namespaces, select Lambda, Across All Functions and select Errors and select Select metric.

Add metric to alert
- I change the Statistic to Sum and the Period to 1 minute.
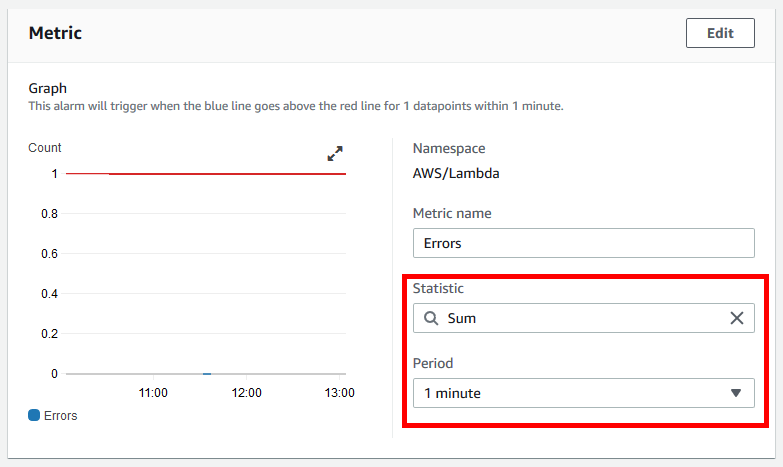
Metric values
- Under Conditions, I select a Static threshold Greater than 1 and select Next.

Metric Conditions
Alarms can also be created using anomaly detection rather than static values if there is a discernible pattern or trend. Anomaly detection looks at past metric data and uses machine learning to create a model of expected values. Alerts can then be configured if they fall outside this band of “normal” values. I use a Static threshold for this alarm.
- For the notification, I set the trigger to alarm to an existing SNS topic with my email address, then choose Next.

Metric Notification
- I enter a descriptive alarm name such as serverlessairline-lambda-prod-errors > 1, select Next, and choose Create alarm.
I have now manually set up an alarm.
Use CloudWatch composite alarms to combine multiple alarms to reduce noise and focus on critical issues. For example, a single alarm could trigger if there are both Lambda function errors as well as high Lambda concurrent executions.
It is simpler and more scalable to include alerting within infrastructure as code. Here is an example of alerting programmatically using CloudFormation.
I view the out of the box standard metrics and in this example, manually create an alarm for Lambda function errors.
Improvement plan summary
- Understand what metrics and dimensions each managed service used provides.
- Configure alerts on relevant metrics for when services are unhealthy.
Good practice: Use structured and centralized logging
Central logging provides a single place to search and analyze logs. Structured logging means selecting a consistent log format and content structure to simplify querying across multiple components.
To identify a business transaction across components, such as a particular flight booking, log operational information from upstream and downstream services. Add information such as customer_id along with business outcomes such as order=accepted or order=confirmed. Make sure you are not logging any sensitive or personal identifying data in any logs.
Use JSON as your logging output format. Log multiple fields in a single object or dictionary rather than many one line messages for simpler searching.
Here is an example of a structured logging format.
The airline booking component, which is written in Python, currently uses a shared library with a separate log processing stack.
Embedded Metrics Format is a simpler mechanism to replace the shared library and use structured logging. CloudWatch Embedded Metrics adds environmental metadata such as Lambda Function version and also automatically extracts custom metrics so you can visualize and alarm on them. There are open-source client libraries available for Node.js and Python.
I then add embedded metrics to the individual confirm booking module with the following steps:
- I install the aws-embedded-metrics library using the instructions.
- In the function init code, I import the module and create a metric_scope with the following code
from aws_embedded_metrics import metric_scope
@metric_scope- In the function handler, I log the generated bookingReference with the following code.
metrics.set_property("BookingReference", ret["bookingReference"])In this example I also log the entire incoming event details.
metrics.set_property("event", event)It is best practice to only log what is required to avoid unnecessary costs. Ensure the event does not have any sensitive or personal identifying data which is available to anyone who has access to the logs.
To avoid the duplicate logging in this example airline application which adds cost, I remove the existing shared library logger.*() lines.
When I make a booking, the CloudWatch log message is in structured JSON format. It contains the properties I set event, BookingReference, as well as function metadata.

Structure log example
I can then search for all log activity related to a specific booking across multiple functions with booking_id. I can track customer activity across multiple bookings using customer_id.
Logging is often created as a shared library resource which all functions reference. Another option is using Lambda Layers, which lets functions import additional code such as external libraries. Multiple functions can share this code.
Improvement plan summary
- Log request identifiers from downstream services, component name, component runtime information, unique correlation identifiers, and information that helps identify a business transaction.
- Use JSON as the logging output. Prefer logging entire objects/dictionaries rather than many one line messages. Mask or remove sensitive data when logging.
- Minimize logging debugging information to a minimum as they can incur both costs and increase noise to signal ratio
Conclusion
Evaluating serverless application health helps understand which services should be optimized to improve your customer’s experience. I cover out of the box metrics and alerts, as well as structured and centralized logging.
This well-architected question continues in part 2 where I look at custom metrics and distributed tracing.