AWS Compute Blog
Building well-architected serverless applications: Understanding application health – part 2
This series of blog posts uses the AWS Well-Architected Tool with the Serverless Lens to help customers build and operate applications using best practices. In each post, I address the nine serverless-specific questions identified by the Serverless Lens along with the recommended best practices. See the Introduction post for a table of contents and explaining the example application.
Question OPS1: How do you evaluate your serverless application’s health?
This post continues part 1 of this Operational Excellence question. Previously, I covered using Amazon CloudWatch out-of-the-box standard metrics and alerts, and structured and centralized logging with the Embedded Metrics Format.
Best practice: Use application, business, and operations metrics
Identifying key performance indicators (KPIs), including business, customer, and operations outcomes, in additional to application metrics, helps to show a higher-level view of how the application and business is performing.
Business KPIs measure your application performance against business goals. For example, if fewer flight reservations are flowing through the system, the business would like to know.
Customer experience KPIs highlight the overall effectiveness of how customers use the application over time. Examples are perceived latency, time to find a booking, make a payment, etc.
Operational metrics help to see how operationally stable the application is over time. Examples are continuous integration/delivery/deployment feedback time, mean-time-between-failure/recovery, number of on-call pages and time to resolution, etc.
Custom Metrics
Embedded Metrics Format can also emit custom metrics to help understand your workload health’s impact on business.
The airline booking service uses AWS Step Functions, AWS Lambda, Amazon SNS, and Amazon DynamoDB.
In the confirm booking module function handler, I add a new namespace and dimension to associate this set of logs with this application and service.
metrics.set_namespace("ServerlessAirlineEMF")metrics.put_dimensions({"service":"confirm_booking"})Within the try statement within the try/except block, I emit a metric for a successful booking:
metrics.put_metric("BookingSuccessful", 1, "Count")And within the except statement within the try/except block, I emit a metric for a failed booking:
metrics.put_metric("BookingFailed", 1, "Count")Once I make a booking, within the CloudWatch console, I navigate to Logs | Log groups and select the Airline-ConfirmBooking-develop group. I select a log stream and find the custom metric as part of the structured log entry.

Custom metric structured log entry
I can also create a custom metric graph. Within the CloudWatch console, I navigate to Metrics. I see the ServerlessAirlineEMF Custom Namespace is available.

Custom metric namespace
I select the Namespace and the available metric.

Available metric
I select a Line graph, add a name, and see the successful booking now plotted on the graph.
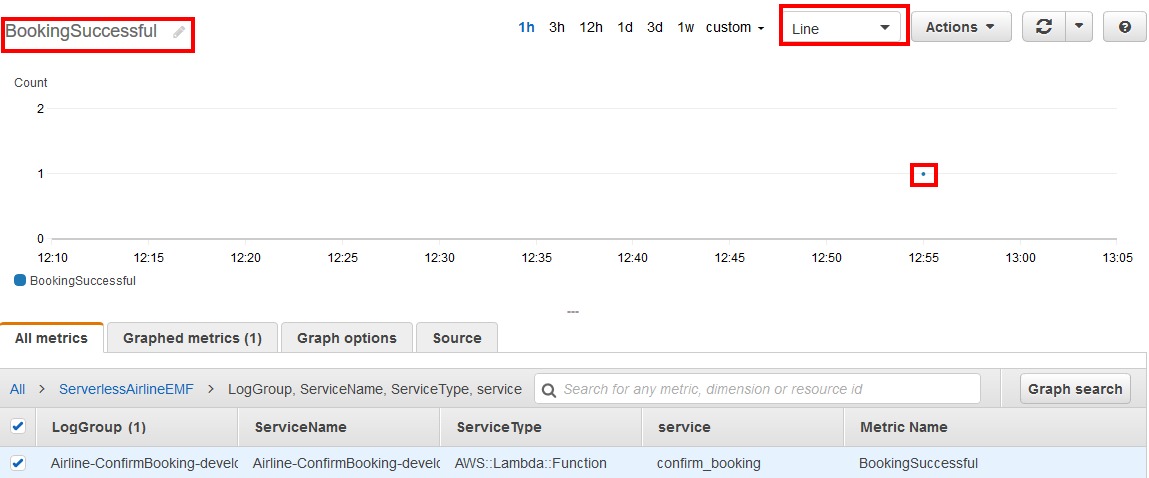
Plotted CloudWatch metric
I can also visualize and analyze this metric using CloudWatch Insights.
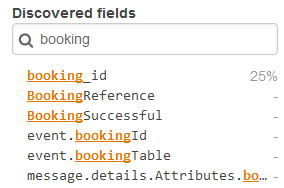
Once a booking is made, within the CloudWatch console, I navigate to Logs | Insights. I select the /aws/lambda/Airline-ConfirmBooking-develop log group. I choose Run query which shows a list of discovered fields on the right of the console.
I can search for discovered booking related fields.
 I then enter the following in the query pane to search the logs and plot the sum of BookingReference and choose Run Query:
fields @timestamp, @message

 | stats sum(@BookingReference)

CloudWatch Insights query
There are a number of other component metrics that are important to measure. Track interactions between upstream and downstream components such as message queue length, integration latency, and throttling.
Improvement plan summary
- Identify user journeys and metrics from each customer transaction.
- Create custom metrics asynchronously instead of synchronously for improved performance, cost, and reliability outcomes.
- Emit business metrics from within your workload to measure application performance against business goals.
- Create and analyze component metrics to measure interactions with upstream and downstream components.
- Create and analyze operational metrics to assess the health of your continuous delivery pipeline and operational processes.
Good practice: Use distributed tracing and code is instrumented with additional context
Logging provides information on the individual point in time events the application generates. Tracing provides a wider continuous view of an application. Tracing helps to follow a user journey or transaction through the application.
AWS X-Ray is an example of a distributed tracing solution, there are a number of third-party options as well. X-Ray collects data about the requests that your application serves and also builds a service graph, which shows all the components of an application. This provides visibility to understand how upstream/downstream services may affect workload health.
For the most comprehensive view, enable X-Ray across as many services as possible and include X-Ray tracing instrumentation in code. This is the list of AWS Services integrated with X-Ray.
X-Ray receives data from services as segments. Segments for a common request are then grouped into traces. Segments can be further broken down into more granular subsegments. Custom data key-value pairs are added to segments and subsegments with annotations and metadata. Traces can also be grouped which helps with filter expressions.
AWS Lambda instruments incoming requests for all supported languages. Lambda application code can be further instrumented to emit information about its status, correlation identifiers, and business outcomes to determine transaction flows across your workload.
X-Ray tracing for a Lambda function is enabled in the Lambda Console. Select a Lambda function. I select the Airline-ReserveBooking-develop function. In the Configuration pane, I select to enable X-Ray Active tracing.

X-Ray tracing enabled
X-Ray can also be enabled via CloudFormation with the following code:
TracingConfig:
  Mode: Active
Lambda IAM permissions to write to X-Ray are added automatically when active tracing is enabled via the console. When using CloudFormation, Allow the Actions xray:PutTraceSegments and xray:PutTelemetryRecords
It is important to understand what invocations X-Ray does trace. X-Ray applies a sampling algorithm. If an upstream service, such as API Gateway with X-Ray tracing enabled, has already sampled a request, the Lambda function request is also sampled. Without an upstream request, X-Ray traces data for the first Lambda invocation each second, and then 5% of additional invocations.
For the airline application, X-Ray tracing is initiated within the shared library with the code:
from aws_xray_sdk.core import models, patch_all, xray_recorderSegments, subsegments, annotations, and metadata are added to functions with the following example code:
segment = xray_recorder.begin_segment('segment_name')
# Start a subsegment
subsegment = xray_recorder.begin_subsegment('subsegment_name')
# Add metadata and annotations
segment.put_metadata('key', dict, 'namespace')
subsegment.put_annotation('key', 'value')
# Close the subsegment and segment
xray_recorder.end_subsegment()
xray_recorder.end_segment()
For example, within the collect payment module, an annotation is added for a successful payment with:
tracer.put_annotation("PaymentStatus", "SUCCESS")CloudWatch ServiceLens
Once a booking is made and payment is successful, the tracing is available in the X-Ray console.
I explore how Amazon CloudWatch ServiceLens connects metrics, logs and the X-Ray tracing. Within the CloudWatch console, I navigate to ServiceLens | Service Map.
I can visualize all application resources and dependencies where X-Ray is enabled. I can trace performance or availability issues. If there was an issue connecting to SNS for example, this would be shown.
I select the Airline-CollectPayment-develop node and can view the out-of-the-box standard Lambda metrics.
I can select View Logs to jump to the CloudWatch Logs Insights console.

CloudWatch Insights Service map
I select View dashboard to see the function metrics, node map, and function details.
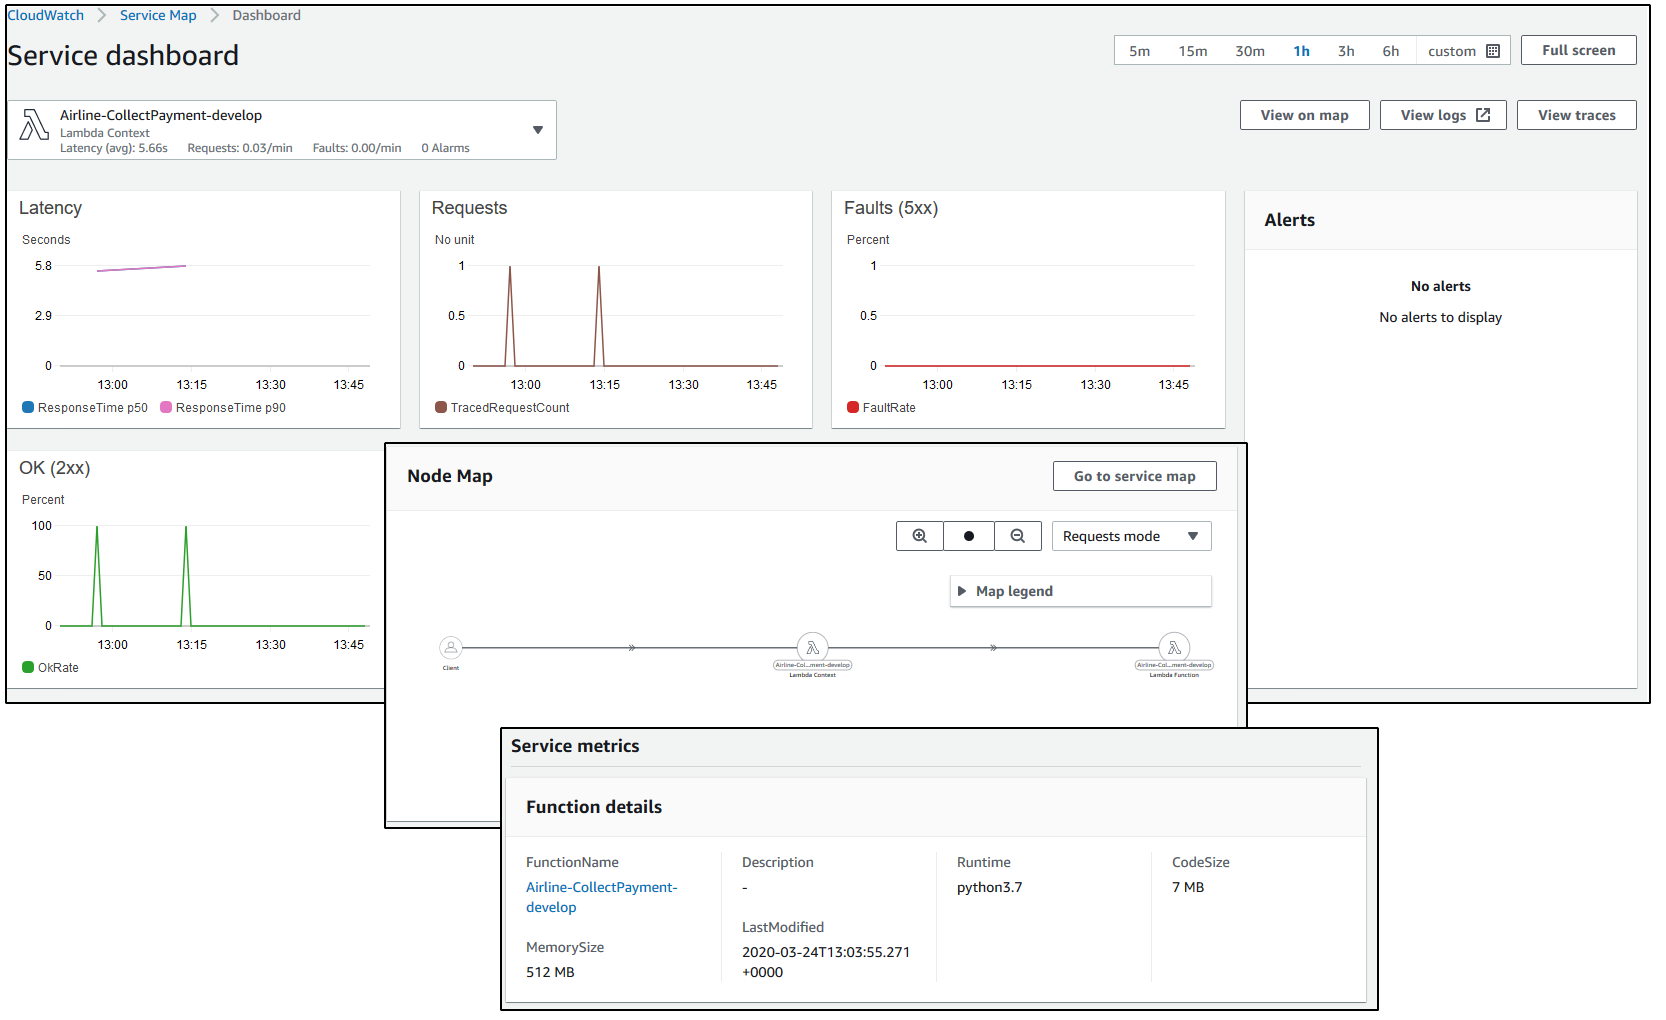
CloudWatch Insights Service Map dashboard
I select View traces and can filter by the custom metric PaymentStatus. I select SUCCESS and chose Add to filter. I then select a trace.

CloudWatch Insights Filtered traces
I see the full trace details, which show the full application transaction of a payment collection.
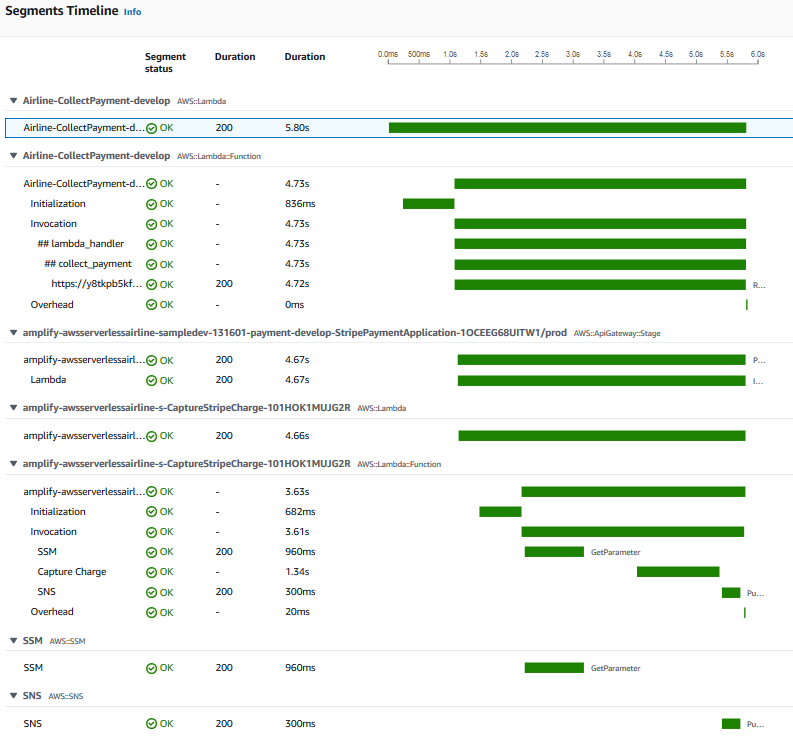
Segments timeline
Selecting the Lambda handler subsegment – ## lambda_handler, I can view the trace Annotations and Metadata, which include the business transaction details such as Customer and PaymentStatus.

X-Ray annotations
Trace groups are another feature of X-Ray and ServiceLens. Trace groups use filter expressions such as Annotation.PaymentStatus = "FAILED" which are used to view traces that match the particular group. Service graphs can also be viewed, and CloudWatch alarms created based on the group.
CloudWatch ServiceLens provides powerful capabilities to understand application performance bottlenecks and issues, helping determine how users are impacted.
Improvement plan summary
- Identify common business context and system data that are commonly present across multiple transactions.
- Instrument SDKs and requests to upstream/downstream services to understand the flow of a transaction across system components.
Recent announcements
There have been a number of recent announcements for X-Ray and CloudWatch to improve how to evaluate serverless application health.
- CloudWatch ServiceLens – a “single pane of glass” monitoring tool
- CloudWatch Synthetics – Generate “canary” tests for your APIs and other services
- Cloudwatch composite alarms – Combine multiple alarms to reduce alerting noise.
- Embedded Metric Format for CloudWatch Logs
- CloudWatch Contributor Insights – Identify top talkers, common patterns in logs
- X-Ray Trace Maps – Map a single event though your distributed application
- X-Ray integration with CloudWatch Synthetics
Conclusion
Evaluating application health helps you identify which services should be optimized to improve your customer’s experience. In part 1, I cover out-of-the-box standard metrics and alerts, as well as structured and centralized logging. In this post, I explore custom metrics and distributed tracing and show how to use ServiceLens to view logs, metrics, and traces together.
In the next post in the series, I cover the second Operational Excellence question from the Well-Architected Serverless Lens – Approaching application lifecycle management – part 1.