AWS Database Blog
Reducing storage initialization impact in Amazon RDS for PostgreSQL after snapshot restore
When you restore an Amazon Relational Database Service (Amazon RDS) for PostgreSQL instance from a snapshot, the underlying Amazon Elastic Block Store (Amazon EBS) volume is available for use immediately. You don’t wait for a full copy of your data before the instance comes online. This is a core benefit of how Amazon EBS restores from snapshots: data blocks are durably held in Amazon Simple Storage Service (Amazon S3) and the Amazon EBS volume hydrates in the background, pulling any not-yet-copied block on first access. This process is called lazy loading or storage initialization. Background hydration begins at restore time and progresses continuously, so the volume becomes steadily more performant on its own. The tradeoff is a one-time, first-access cost. If a query runs before hydration completes, any blocks for the tables or indexes it touches that haven’t yet been copied to Amazon EBS are fetched from Amazon S3 on demand. During this window, affected queries can run 10x to 15x slower, as shown in the test results later in this post. Latency is uneven because some queries hit hydrated blocks (fast) while others hit non-hydrated blocks (slow). This window typically lasts hours depending on storage type. Importantly, it’s fully mitigable: with the prewarming techniques in this post, you can pay that cost upfront in a controlled way so production queries stay predictable.
While Amazon EBS offers Fast Snapshot Restore (FSR) to remove lazy loading by fully initializing a volume at creation time, FSR isn’t available for RDS managed Amazon EBS volumes. Because RDS manages the Amazon EBS volumes on your behalf, those controls aren’t customer-exposed in RDS. This is why manual prewarming strategies are necessary for RDS customers who need predictable performance immediately after restore.
Lazy loading applies to snapshot restores, point-in-time recovery (PITR), new read replica creation, Single-Availability Zone (AZ) to Multi-AZ conversion, and Blue/Green deployments.
Note: Throughout this post, the terms hydration, lazy loading, and storage initialization are used interchangeably to refer to the same background process of copying data blocks from Amazon S3 to the Amazon EBS volume.
In this post, we walk through strategies to speed up RDS for PostgreSQL storage initialization after a snapshot restore. We cover PostgreSQL-native prewarming with pg_prewarm, the limitations of VACUUM ANALYZE for hydration, and how to monitor progress using the new StorageOperationStatus and StorageOperationPercentProgress API fields.
Approaches to reduce lazy loading time
The following table ranks approaches by impact:
| Technique | Hydrates heap | Hydrates indexes | Hydrates TOAST | Speed | Recommended when |
| pg_prewarm | Targeted | Targeted | Targeted | Fast | Critical tables/indexes |
| SELECT * / COUNT(*) | Heap only | No | Partial | Medium | Heap-only hydration needed |
| VACUUM ANALYZE | Partial | Partial | Partial | Medium | Statistics refresh is primary goal |
| export using pg_dump | All heap | No | All heap | Medium | Full database heap hydration in one operation |
Using the pg_prewarm extension
pg_prewarm is the most targeted PostgreSQL-native prewarming method. It explicitly loads table heap blocks, index blocks, and TOAST tables into the buffer cache.
pg_prewarm modes
| Mode | I/O behavior | Recommended for |
| prefetch | Asynchronous – Queues multiple I/O requests in parallel | Fastest for hydration |
| read | Synchronous – One block at a time | Sequential reads. Moderate speed |
| buffer | Loads into PostgreSQL shared_buffers |
Cache warming post-hydration |
Recommendation: Use prefetch mode for hydration. Optionally run buffer mode on hot tables after hydration completes.
Sample commands for prewarming a table and its associated objects
A complete prewarm requires warming four components: the table heap (main data), the table’s indexes, the TOAST table, and the TOAST index.
Permission requirement: The user running pg_prewarm must have SELECT privilege on the target tables.
VACUUM ANALYZE: Statistics refresh with limited hydration benefit
VACUUM ANALYZE is a recommended post-restore operation, but its role in hydration is more limited than commonly assumed.
What VACUUM actually does (and does not do)
PostgreSQL maintains a visibility map alongside each table that tracks which pages contain only visible tuples. Standard VACUUM typically skips pages marked as visible. On mostly static tables, the visibility map marks the majority of pages as visible. VACUUM generally skips them, hydrating very few blocks.
VACUUM isn’t reliable for hydration. How much it helps depends entirely on the dead-tuple ratio when the snapshot was taken.
What ANALYZE actually does
ANALYZE collects statistics for the query planner by sampling a limited subset of table rows. It does not perform a full sequential scan. Even for tables with hundreds of millions of rows, ANALYZE reads only a small fraction of pages. The sample size is proportional to the default_statistics_target parameter (default: 100) and does not scale with table size.
ANALYZE’s value post-restore is genuine but for a different reason: It refreshes planner statistics that might have drifted if the snapshot was taken during a period of unusual data distribution. Accurate statistics lead to optimal query plans immediately after restore.
| Operation | Hydration value | Other value |
| VACUUM | Limited – Skips all visible pages | Reclaims dead tuples, updates FSM |
| ANALYZE | Minimal – Samples only | Refreshes planner statistics |
Monitoring hydration progress: RDS storage initialization visibility
Amazon RDS now provides native visibility into storage initialization through two new fields in DescribeDBInstances: StorageOperationStatus (returns Initializing while in progress) and StorageOperationPercentProgress (returns percentage complete). RDS removes both fields when hydration is complete.
Monitoring via AWS CLI
Use the following AWS Command Line Interface (AWS CLI) command to check the current hydration status and progress of your RDS instance.
Sample output:
Monitoring with the Amazon RDS console
You can also track initialization progress from the Configuration tab of your RDS instance on the AWS Management Console. The storage initialization status and percentage are displayed directly on the console view.
Test results and measurements
The following is a test scenario to evaluate the impact of lazy loading on RDS for PostgreSQL instances. It also demonstrates how prewarming with pg_prewarm can improve database performance after restoring from a snapshot.
This example includes two RDS for PostgreSQL instances restored from the same snapshot. One instance was prewarmed with pg_prewarm using 15 parallel sessions immediately after restore, and the second instance was kept running without prewarming. Both instances had the same configuration: db.m5.4xlarge with a 1,200 GiB database on gp3 storage (20,000 IOPS, 600 MiBps throughput).
The following table compares the time to full hydration for both instances.
Hydration completion
| Instance name | Time to full hydration | Notes |
| pg-prewarmed-instance100 | ~5 hours | 15 parallel pg_prewarm sessions |
| pg-lazyloading-instance100 | >24 hours (estimated) | Only 23% complete after 5 hours |
After prewarming completed on the first instance, we ran identical queries on both instances to measure the performance difference.
Query performance (after prewarming completed)
| Query | Prewarmed | Non-prewarmed | Improvement |
| Large table scan | 44 sec | 571 sec | ~13x faster |
| Complex join | 123 sec | 1,531 sec | ~12x faster |
| ReadLatency | 2–3 ms | Up to 40 ms | ~15x lower |
ReadLatency comparison
The following graph compares ReadLatency for both instances during post-prewarm query execution (14:45–15:35).
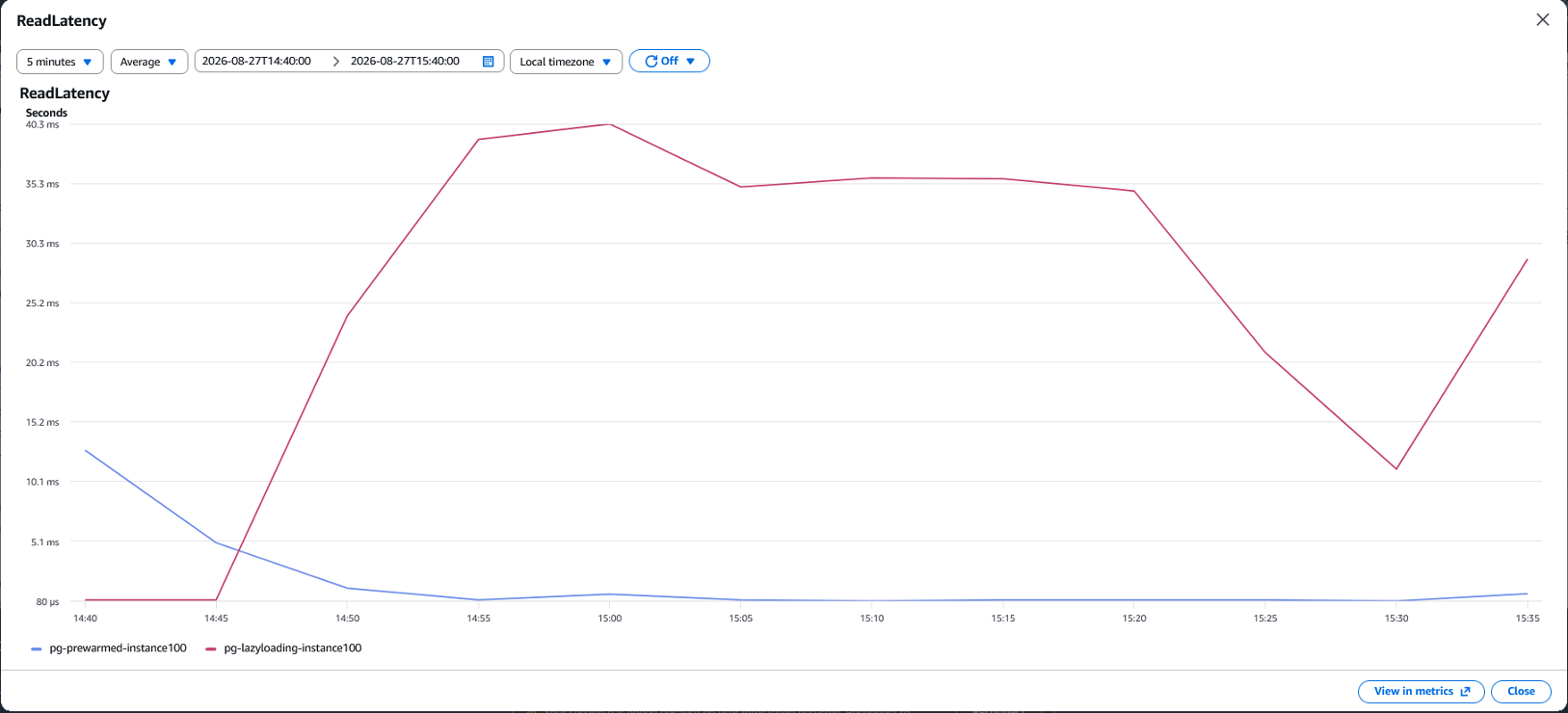
Figure 1: ReadLatency comparison during post-prewarm query execution. The prewarmed instance maintains near-zero latency while the non-prewarmed instance spikes to 35–40 ms.
ReadLatency and WriteLatency during prewarming
The following graph shows ReadLatency and WriteLatency across both instances during the prewarming phase (09:45–14:45), followed by SELECT query testing and load testing.
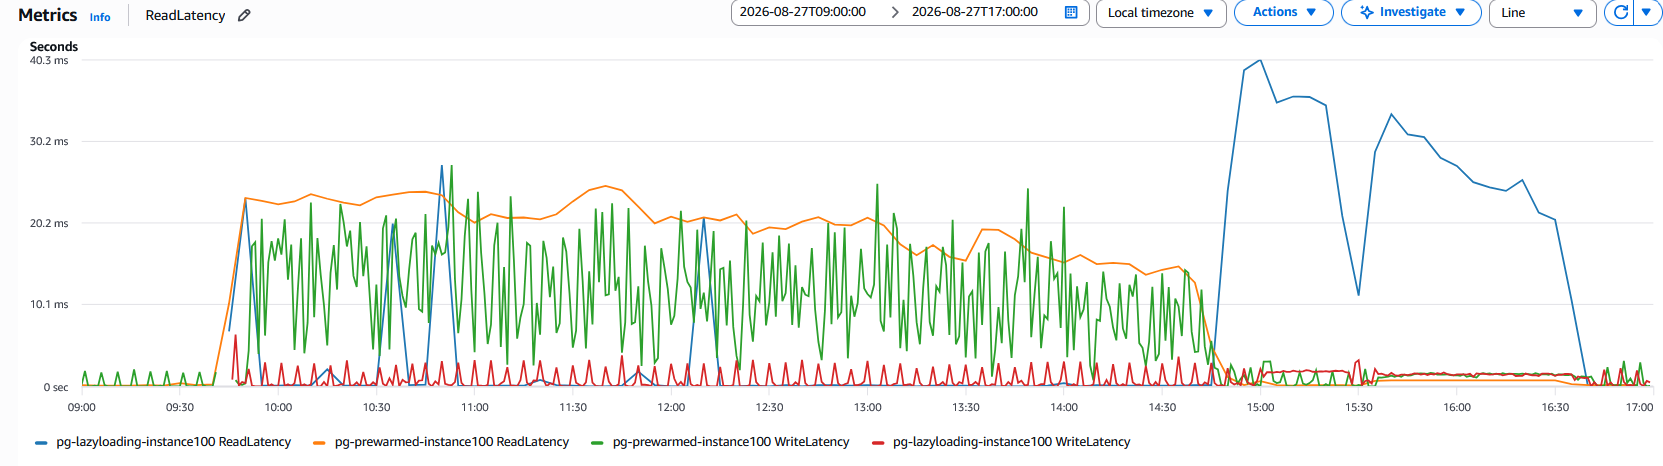
Figure 2: ReadLatency and WriteLatency during the prewarming phase, SELECT query testing, and load testing.
The prewarmed instance shows sustained elevated ReadLatency during active prewarming. This is expected and intentional. The non-prewarmed instance spikes sharply when query load hits non-hydrated blocks.
The elevated ReadLatency during prewarming shows you’re paying the cost upfront by intentionally triggering lazy loading in a controlled manner. This approach avoids unpredictable latency spikes during production queries. After prewarming completes at approximately 14:45, the prewarmed instance drops to 2–3 ms latency and stays there.
The following results were observed during testing on a db.m5.4xlarge instance with a 1,200 GiB database, 20,000 Provisioned IOPS, and 600 MiBps throughput:
| Hydration approach | Hydration time | Notes |
| gp3 (with pg_prewarm) | ~5 hours | Reference baseline |
| gp3 (no prewarming) | >24 hours | Passive hydration only |
All test variables (instance type, database size, storage type, IOPS, and throughput) were held constant. Only the hydration approach was changed.
Note: Results are representative of our test configuration. Actual times might vary by environment, AWS Region, and workload.
Conclusion
Amazon EBS lazy loading provides the benefit of data being available soon, with the tradeoff of queries taking longer until the volume is fully hydrated. For production workloads, disaster recovery (DR) scenarios, and environment refreshes where predictable performance matters, proactive prewarming removes this uncertainty. Here are the key takeaways from our testing:
- pg_prewarm in prefetch mode is the most effective PostgreSQL-native tool – It hydrates both heap and index blocks with asynchronous I/O.
- Monitor with StorageOperationPercentProgress – The new API field gives you certainty. You know precisely when hydration is complete.
For production-critical DR scenarios: We recommend io1/io2 storage types for production workloads to achieve higher throughput and reduced latency. Additionally, run pg_prewarm for critical tables, execute VACUUM ANALYZE for statistics refresh, and monitor with StorageOperationPercentProgress until 100 percent.