.NET on AWS Blog
.NET Observability with OpenTelemetry – Part 3: Distributed Tracing using AWS X-Ray
Traces capture requests through services and components, and are essential for understanding application workflows. They are key for pinpointing bottlenecks and identifying hotspots. Particularly vital in microservices, traces reveal the interplay in modern applications, aiding developers and operators in visualizing request paths for effective issue diagnosis.
In the first post of this series, we instrumented an ASP.NET application for metrics. The second post focused on the implementation of logs via Fluent Bit and Amazon OpenSearch Service. In this final post of the series, we will instrument an ASP.NET application hosted on a managed container service using OpenTelemetry and AWS X-Ray.
Although this post targets Amazon Elastic Container Service (Amazon ECS), you can use the same concept with Amazon Elastic Kubernetes Service (Amazon EKS).
Solution architecture overview
This post uses a sample ASP.NET application hosted in the aws-samples GitHub repository. The application will run in an Amazon ECS cluster using the Amazon EC2 launch type.
To collect and export traces, the AWS Distro for OpenTelemetry (ADOT) collector is deployed as a service on AWS Fargate.
AWS Distro for OpenTelemetry (ADOT) is a secure, production-ready, AWS-supported distribution of the Cloud Native Computing Foundation (CNCF) OpenTelemetry project. OpenTelemetry (OTel) provides open-source APIs, libraries, and agents to collect logs, metrics, and traces.
With ADOT, you can instrument your applications once and send correlated logs, metrics, and traces to one or more observability backends such as Amazon Managed Service for Prometheus, Amazon CloudWatch, AWS X-Ray, Amazon OpenSearch, or any OpenTelemetry Protocol (OTLP) compliant backend. You can instrument automatically using available libraries or manually instrument your application yourself. Figure 1 shows the solution architecture. A user interacts with the application which sends traces to AWS X-Ray.
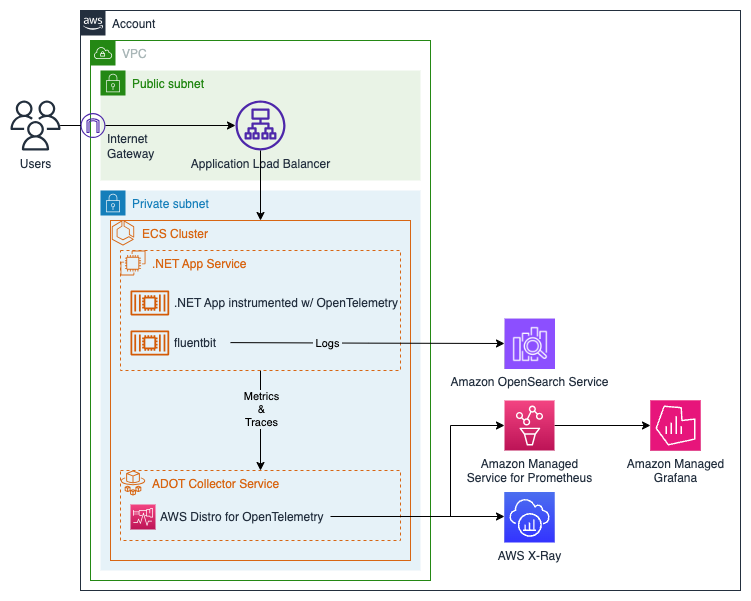
Figure 1: Solution architecture
Prerequisites
The following prerequisites are required on your system to test and deploy this solution:
- .NET 8.0 Software Development Kit (SDK)
- AWS Command Line Interface (AWS CLI)
- AWS CDK v2
- Docker
- Visual Studio (or your preferred IDE)
- AWS credentials for your AWS account configured locally
- Git
- AWS Organizations configured through AWS IAM Identity Center (Successor to AWS Single Sign-On).
Walkthrough
With the prerequisites satisfied, follow these steps to deploy the application and an ADOT Collector ECS service to collect and export traces.
Download the aws-dotnet-ecs-contains-observability sample. It contains an instrumented sample application that generates traffic by making a simple HTTP GET call to aws.amazon.com. It also contains the AWS CloudFormation template to deploy the required resources into your account, which are detailed in the next section.
Prepare your Environment
You will use the CloudFormation template found in the project files to deploy the following resources in your account:
- Amazon ECS cluster to run ECS Services.
- Elastic Load balancer (ELB) configurated as an Application Load Balancer (ALB) and a target group to distribute traffic to the application.
- Amazon Managed Service for Prometheus workspace to store metrics from the ADOT collector.
- Amazon OpenSearch Service to store logs from the AWS for Fluent Bit sidecar.
- Amazon Managed Grafana workspace to aggregate and visualize metrics
- AWS Identity and Access Management (IAM) roles to provide Amazon ECS tasks with write permissions to AWS X-Ray, Amazon Managed Service for Prometheus, and Amazon OpenSearch Service.
Browse to the location where you downloaded the sample code. In a command or terminal window, navigate to the BlogSample-ASPDotNetApp/BlogResources folder and run the following command to deploy the CloudFormation template. We recommend deploying this in a test environment to not interfere with production workloads.
aws cloudformation deploy --template-file ./blog-cf-template.yml --stack-name blog-solution-stack --capabilities CAPABILITY_NAMED_IAM
Navigate to the CloudFormation service in the AWS management console and browse your new stack to see the outputs that we will use in the upcoming steps. The CloudFormation stack will take up to 15 minutes to complete the provisioning of the resources.
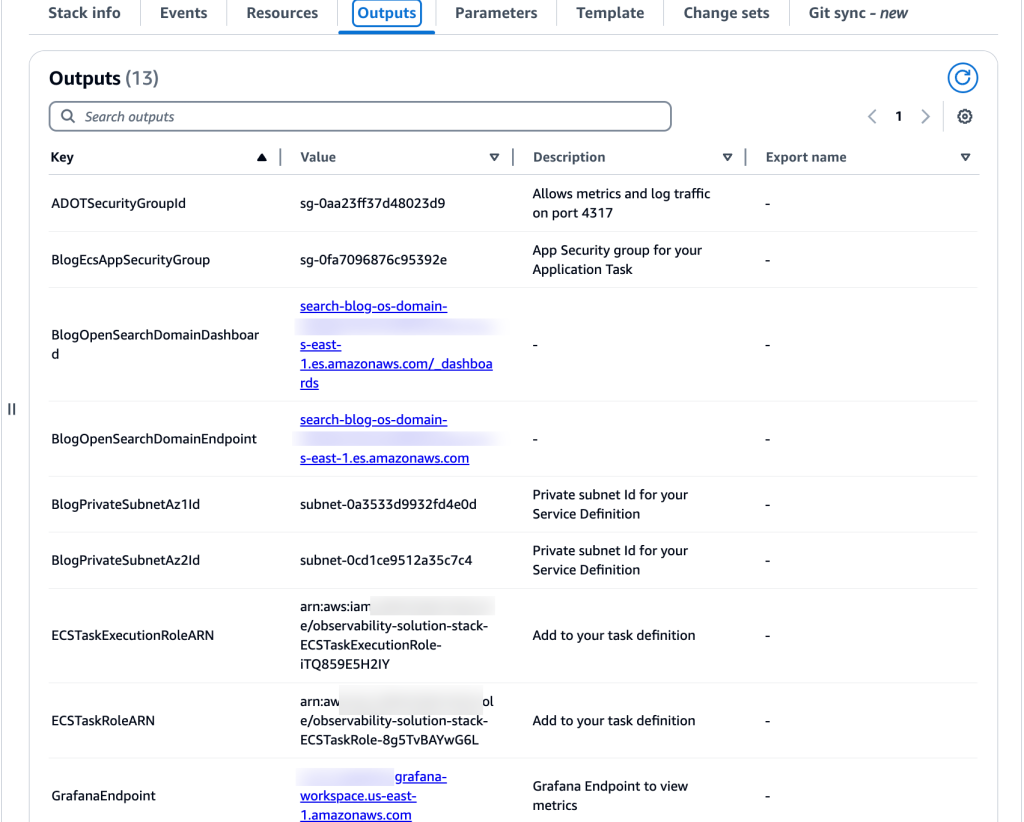
Figure 2: Outputs generated by the CloudFormation stack
Inspecting our .NET Application
You will use OpenTelemetry to generate and collect traces from your application. In this section, inspect OpenTelemetry integration in the sample .NET application.
The application is available as a container image on the Amazon Elastic Container Registry (Amazon ECR) public gallery for the deployment.
Inspect the NuGet Packages
Browse to the location where you downloaded the sample application. Open the BlogSample-ASPDotNet.sln solution file using Visual Studio or your preferred IDE. You can find the solution file in the main folder of the sample application. Inside the solution, there is a Startup.cs file that includes essential packages and code for sending data to the ADOT collector. If you’re interested in creating your own solution, examine the packages specified in the project file for reference.
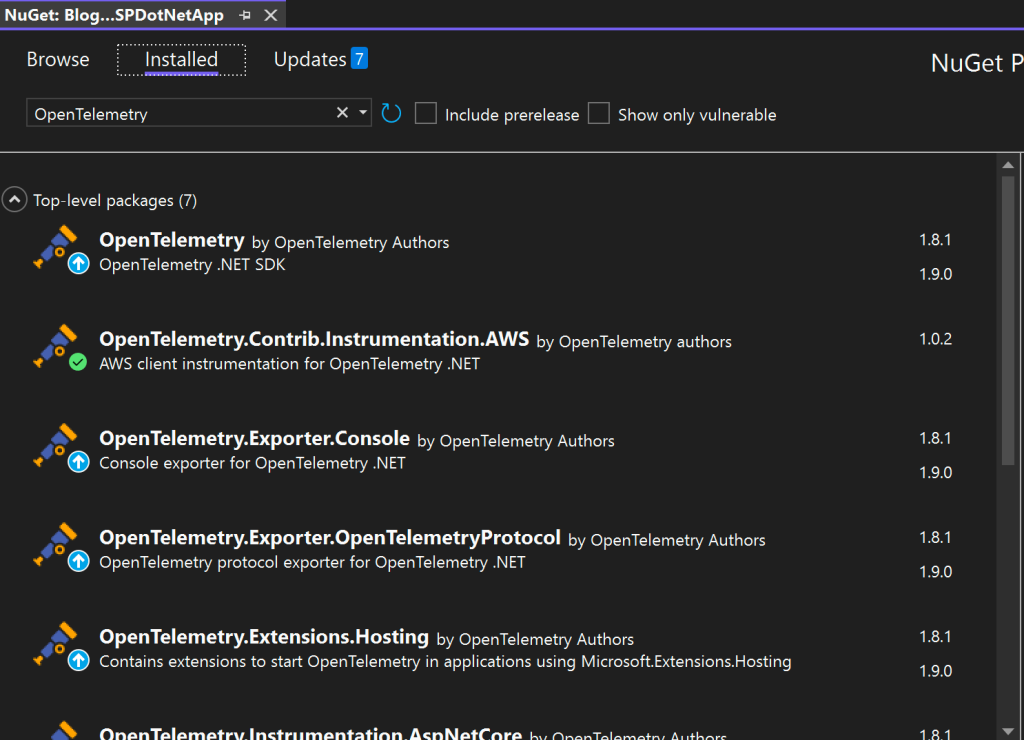
Figure 3: Adding the required OpenTelemetry NuGet packages
Inspect the code used to instrument the application with OpenTelemetry
Simply adding the packages does not instrument your application. OpenTelemetry services are required in your project on startup. In the sample application, this is done in Startup.cs, however, implement this code where you configure your IServiceCollection.
The provided code sets up OpenTelemetry tracing for the .NET application. It defines the service name and version, creates a resource with these attributes, and configures the tracing using AddOpenTelemetry().WithTracing(). The tracing configuration includes adding a console exporter for debugging, an OTLP exporter for sending traces to a specified endpoint, a trace source, and associating the resource with the traces.
Additionally, the code enables automatic instrumentation for AWS SDK operations, outgoing HTTP requests made with HttpClient, and incoming HTTP requests and middleware in ASP.NET Core. Since October 2023, AWS X-Ray supports W3C trace IDs generated by OpenTelemetry and no longer requires adding a separate X-Ray compatible trace id when using the ADOT collector version 0.34.0 or newer.
...

        var serviceName = "sample-app";
        var serviceVersion = "1.0";

        var appResourceBuilder = ResourceBuilder.CreateDefault()
                .AddService(serviceName: serviceName, serviceVersion: serviceVersion);

        //Configure important OpenTelemetry settings, the console exporter, and instrumentation library

 …

  services.AddOpenTelemetry()
    .WithTracing(tracerProviderBuilder =>

    tracerProviderBuilder
        .AddSource(serviceName)
        .SetResourceBuilder(appResourceBuilder.AddTelemetrySdk())
        .AddAWSInstrumentation()
        .AddAspNetCoreInstrumentation()
        .AddHttpClientInstrumentation()
        .AddConsoleExporter()
        .AddOtlpExporter(options =>
        {
            options.Protocol = OtlpExportProtocol.Grpc;
            options.Endpoint = new Uri(Environment.GetEnvironmentVariable("OTEL_EXPORTER_OTLP_ENDPOINT"));

        }));


...
Deploy the ADOT Collector to Amazon ECS Fargate
This section describes how to configure the ADOT collector Fargate service to receive traces from your .NET app, and export them to AWS X-Ray.
Inspect the ADOT Collector Configuration
To start, the ADOT collector requires a configuration to ingress and egress telemetry signals. Note the traces pipeline highlighted in the configuration. This is required for receiving and exporting traces.
Following is the collector configuration found in Parameter Store, a capability of AWS Systems Manager. Parameter Store provides secure, hierarchical storage for configuration data management and secrets management.
The collector will pull the configuration directly from SSM instead of the local filesystem, removing the need to make a custom image. This approach is documented in Use custom OpenTelemetry configuration file from SSM Parameter.
receivers:
   otlp:
     protocols:
       grpc:
         endpoint: 0.0.0.0:4317


 processors:
   batch:


 exporters:
   prometheusremotewrite:
     endpoint: <YOUR-APS-WORKSPACE-ENDPOINT>/api/v1/remote_write
     auth:
       authenticator: sigv4auth
   awsxray:
    region: <YOUR-REGION>
   logging:
     loglevel: debug


 extensions:
   sigv4auth:
     region: <YOUR-REGION>

 service:
   extensions: [sigv4auth]
   pipelines:
     traces:
       receivers:  [otlp]
       processors: [batch]
       exporters:  [awsxray]
     metrics:
       receivers:  [otlp]
       processors: [batch]
       exporters:  [prometheusremotewrite]
Launch ADOT Fargate Service
Find the service definition adot-service under the service-definitions folder. Update the subnets and securityGroups keys with the IDs of your private subnets and the security group IDs. Retrieve these IDs from the output tab of our stack in the CloudFormation console.
{
     "cluster": "BlogCluster",
     "deploymentConfiguration": {
         "maximumPercent": 200,
         "minimumHealthyPercent": 0
     },
     "deploymentController": {
         "type": "ECS"
     },
     "desiredCount": 1,
     "enableECSManagedTags": true,
     "enableExecuteCommand": true,
     "launchType": "FARGATE",
     "networkConfiguration": {
         "awsvpcConfiguration": {
             "assignPublicIp": "ENABLED",
             "securityGroups": [
                "<ADOTSecurityGroupId>"
             ],
             "subnets": [
          "<BlogPrivateSubnetAz1Id>",
          "<BlogPrivateSubnetAz2Id>"
             ]
            }
     },
    ...
Launch the ADOT service through the console or using the following command:
aws ecs create-service --cluster BlogCluster --cli-input-json file://adot-service.json
After the completion of this command, you will see the ADOT collector service running on your cluster.

Figure 4: The ADOT service running on a ECS cluster
Deploy your Application Service
The next step is to deploy the application service on ECS. Open the sample-app-service.json and update the “targetGroupArn” to the target group found in the CloudFormation stack outputs.
The next step is to deploy the application service on ECS. Open the sample-app-service.json and update the “targetGroupArn” to the target group found in the CloudFormation stack outputs.
...
         "loadBalancers": [
         {

            "targetGroupArn": "<TARGET-GROUP-ARN>",
             "loadBalancerName": "",
             "containerName": "sample-app",
             "containerPort": 8080
         }
     ],
 ...
Launch application service either through the console or by navigating into the service-definitions folder and run the following command:
aws ecs create-service --cluster BlogCluster --cli-input-json file://sample-app-service.json
For inter-service communication, we use AWS CloudMap. Cloud Map allows you to register application resources, such as databases, queues, microservices, and other cloud resources, with custom names. Cloud Map then constantly checks the health of those resources to make sure the location is up-to-date. Under the hood, it uses Amazon Route 53 and creates DNS records in a private hosted zone for each registered task. If everything is configured properly then both services will be running.

Figure 5 : Both Services Running on the cluster
Access and Navigate the Application
This section explains how to access and navigate to the application and generate traces to send to the endpoints.
Open the cluster in the Amazon ECS console and select app-service. Select the networking tab and then copy the DNS name of the load balancer to access your application. Paste the URL in your browser to access the application and begin generating traces.
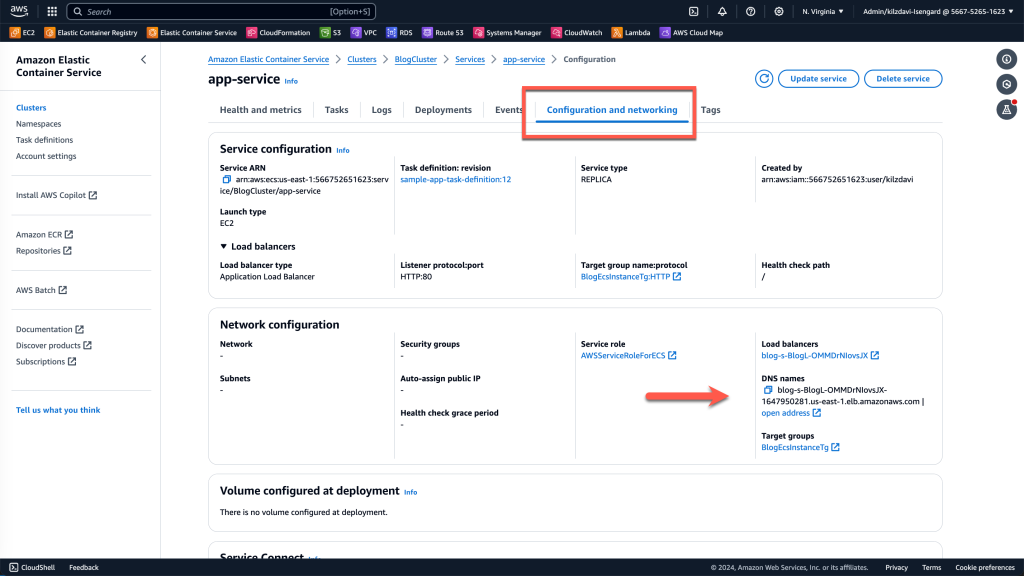
Figure 6: Access the load balancer endpoint

Figure 7: The application home page
Generate Logs and Traces
On the application site, hit the Call API link in the top-level navigation bar to generate traffic to aws.amazon.com.
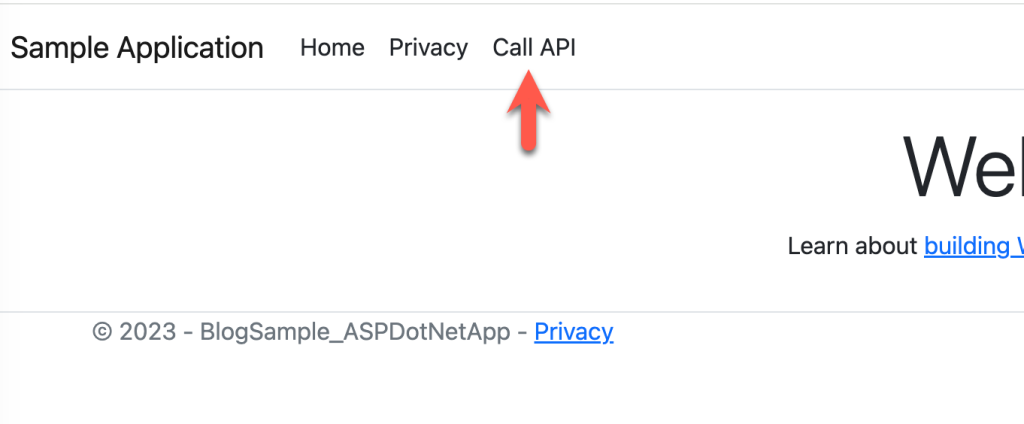
Figure 8: Call the API

Figure 9: A successful API call
View your Application’s Traces in AWS X-Ray
Trace signals from our application are sent to AWS X-Ray. AWS X-Ray provides a complete view of requests as they travel through your application and filters visual data across functions, services, and APIs. Visit this link to learn about AWS X-Ray concepts.
In the AWS CloudWatch Console, find X-Ray traces in the side bar. There you will find your trace signals service map for your requests.
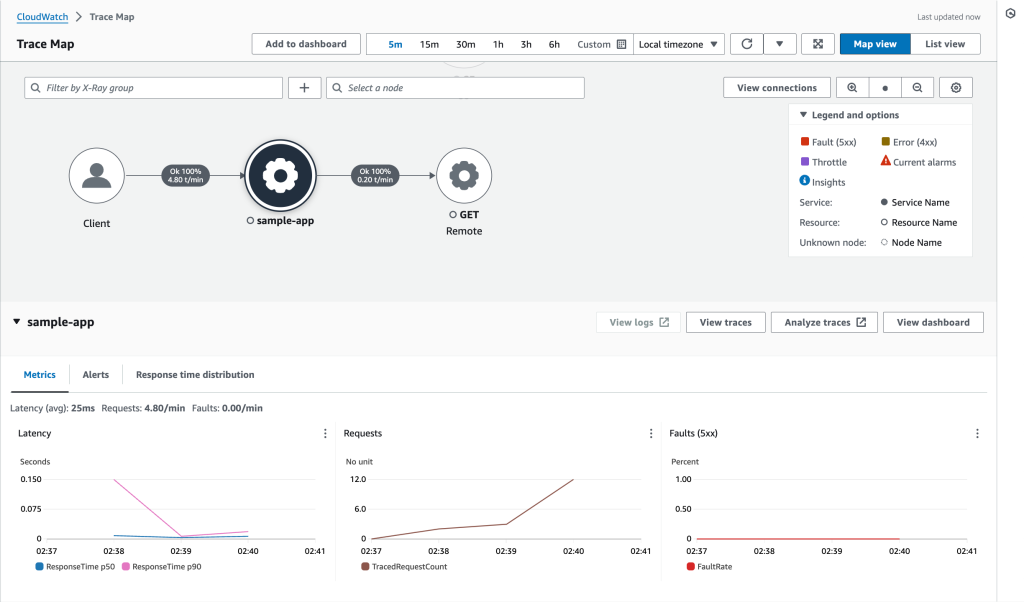
Figure 10: AWS X-Ray service map which displays the request from the client.
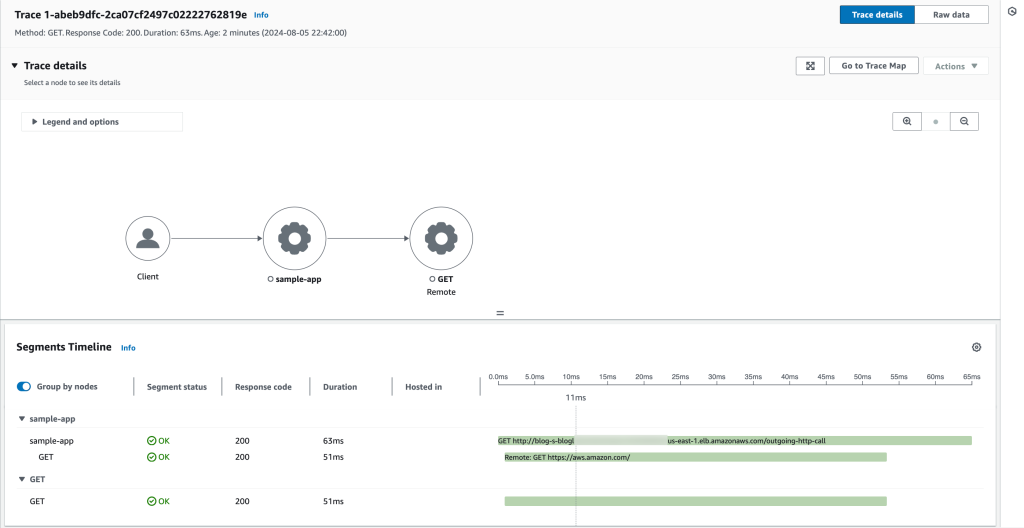
Figure 11: Details of the outgoing-http-call
Find the outgoing-http-call in the list of traces to reveal information such as the number of requests, the duration, response codes, and a map of that call.
Clean Up
Clean up the resources created in this tutorial. It is a good practice to delete resources that you are no longer using. By deleting a resource you’ll also stop incurring charges for that resource.
- Open the Amazon ECS console stop the App and adot services on your Cluster.
- Open CloudFormation in the AWS console and delete the template deployed earlier. This will delete the resources provisioned which can take 10-15 minutes. If any resources fail to delete, they can be manually deleted.
Conclusion
In this final post in the .NET Observability with OpenTelemetry series, we showed how to instrument a .NET application with OpenTelemetry to generate traces. We then demonstrated how to use ADOT to send traces to AWS X-Ray for analysis.
To learn about instrumenting metrics using OpenTelemetry or logging using Fluent Bit, read the other two posts in the series: .NET Observability with OpenTelemetry – Part 1: Metrics using Amazon Managed Prometheus and Grafana and .NET Observability – Part 2: Logs using Fluent Bit and Amazon OpenSearch.
Observability doesn’t stop at instrumenting your .NET application with metrics, logs, and traces. With AWS X-Ray and OpenTelemetry, you can identify performance bottlenecks, analyze error rates, and visualize the dependencies between different services to optimize application performance and reliability. Visit the AWS X-Ray Features pages to learn more.