Application Observability (APM)
Spot and fix application issues before they impact your customers
Overview
Prevent, optimize, and resolve application issues faster with Amazon CloudWatch Application Signals. Get one-click setup with automatic instrumentation across Amazon ECS, EKS, Lambda, EC2, and more—plus instant, automated insights from prebuilt dashboards that highlight your most critical telemetry.

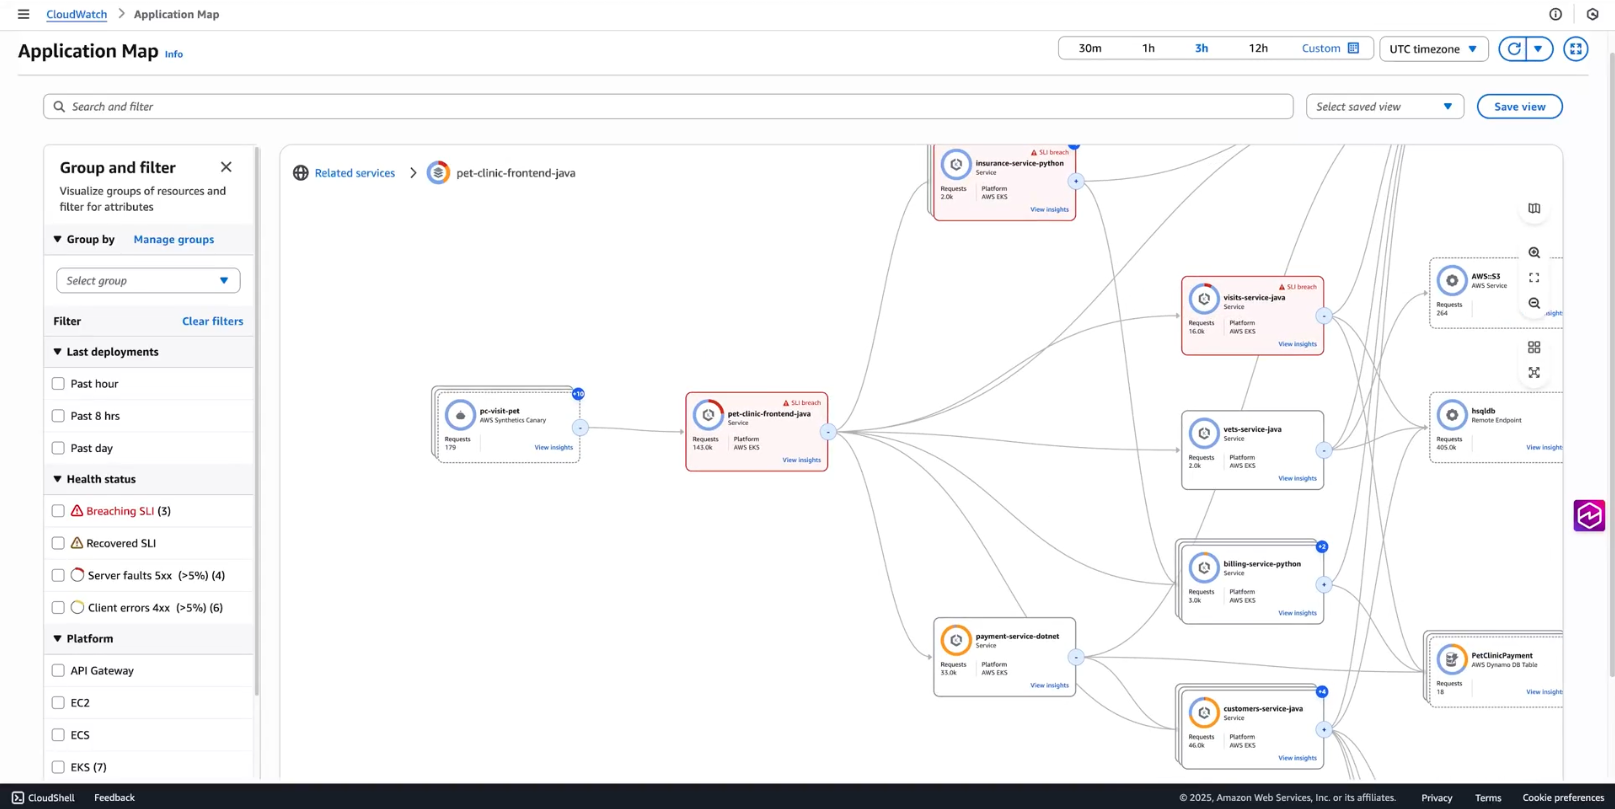
From chaos to clarity
Visualize and troubleshoot your entire system architecture with zero configuration. Understand dependencies and resolve issues faster with automatic discovery of instrumented and uninstrumented services, automatic mapping of distributed applications across AWS accounts and regions, cross-account visibility, automatic operational audits for common issues, and recent changes to your application.
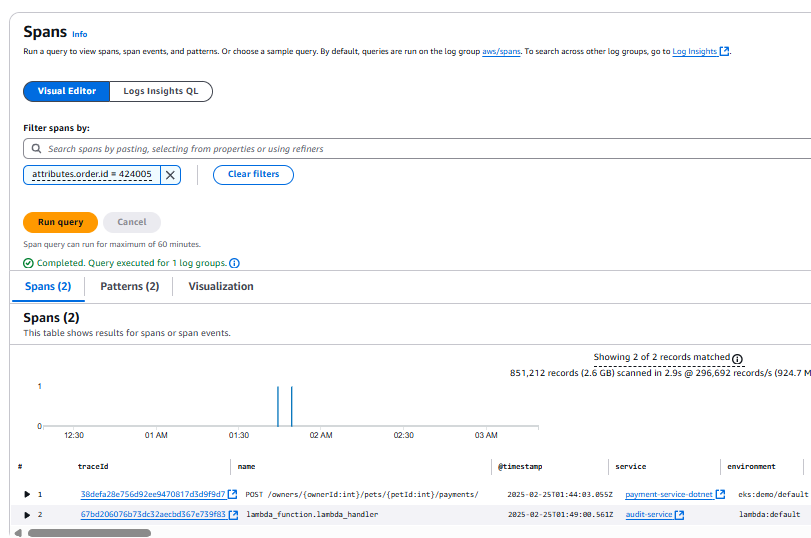
Business insights from every trace
Simplify transaction analysis using an intuitive visual query builder. Surface business insights connect transaction tracing to business objectives. Instantly gain an end-to-end view of business-critical transactions with minimal setup and no setup and one-click analytics.
Production telemetry with your source code
Investigate production issues using natural language directly in your IDE such as Kiro or GitHub without switching tools or learning query languages. Ask plain English questions like "Why is my billing service failing to process payments successfully?" and get AI-powered analysis that examines firing alarms, investigates log anomalies, correlates metrics with deployments, and points to the exact code causing issues in seconds. By using @awsapm in GitHub issues, you can trigger automatic analysis of live telemetry alongside source code, receive detailed fixes, and let AI submit pull requests with precise solutions—bringing production telemetry directly where you write code.
Learn more about CloudWatch MCP servers
Learn more about Application Observability for AWS GitHub Action integration

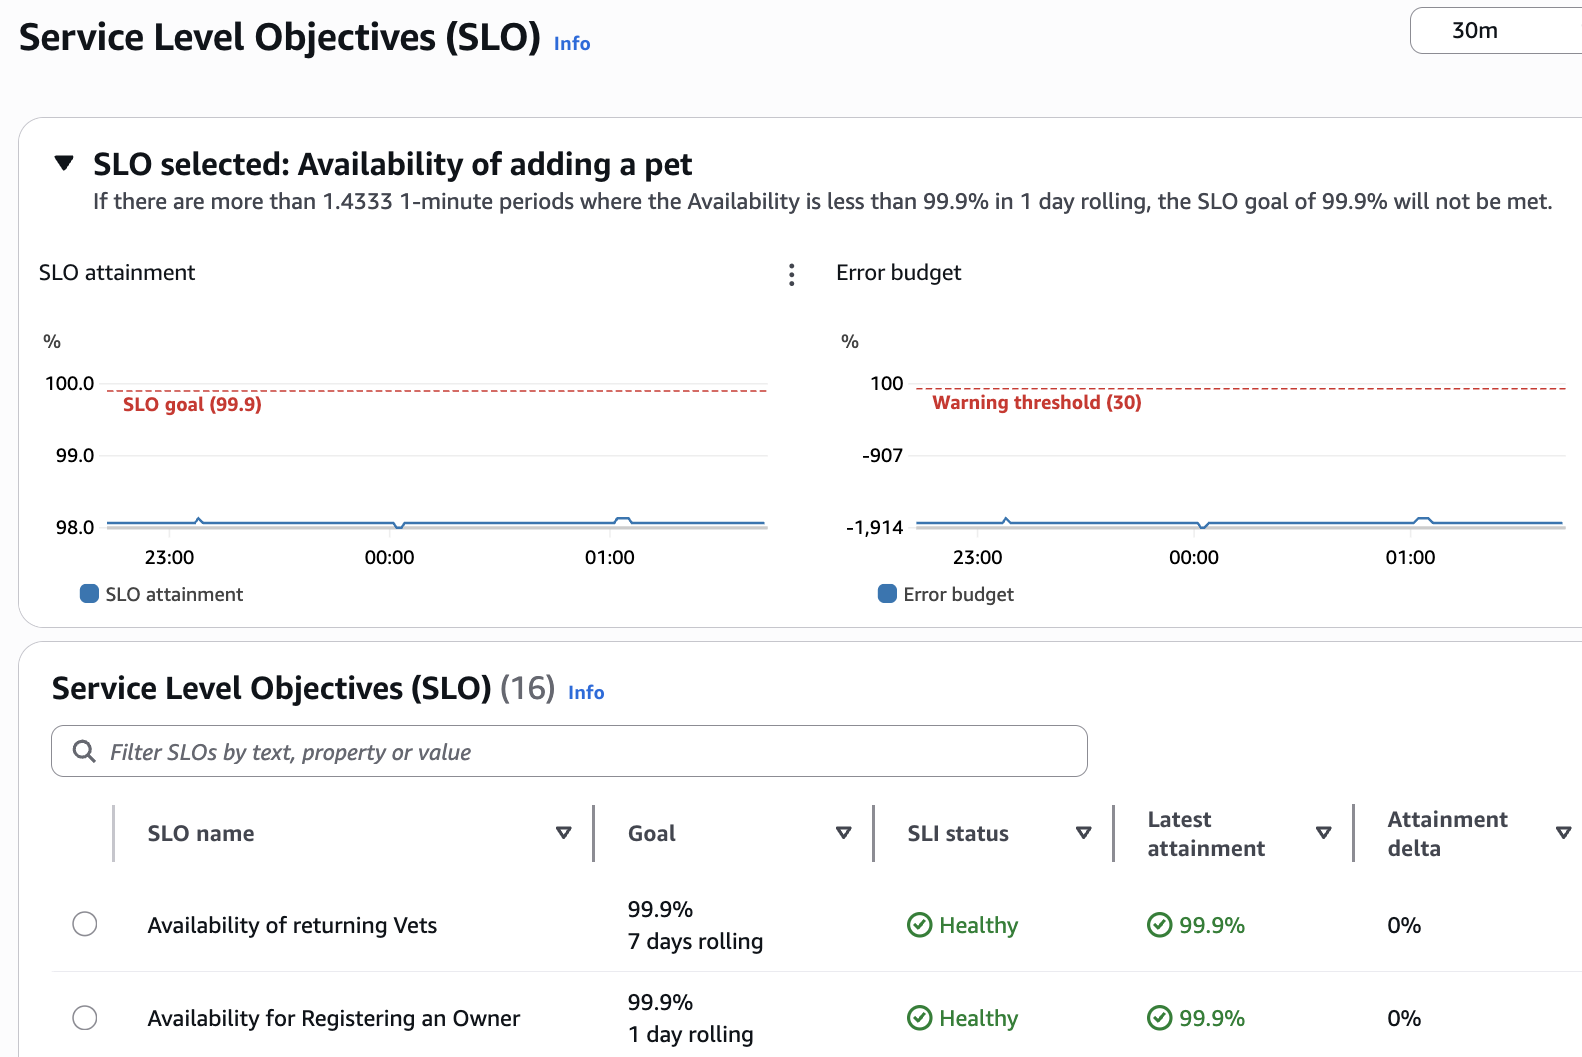
Keep your customers happy and your service up
Keep your customers happy by tracking service reliability using SLOs and SLIs. Deliver consistent service quality using CloudWatch's unified console to track real-time SLO status and compliance. Prevent customer frustration by setting business-focused SLO alerts in CloudWatch before reliability issues occur.
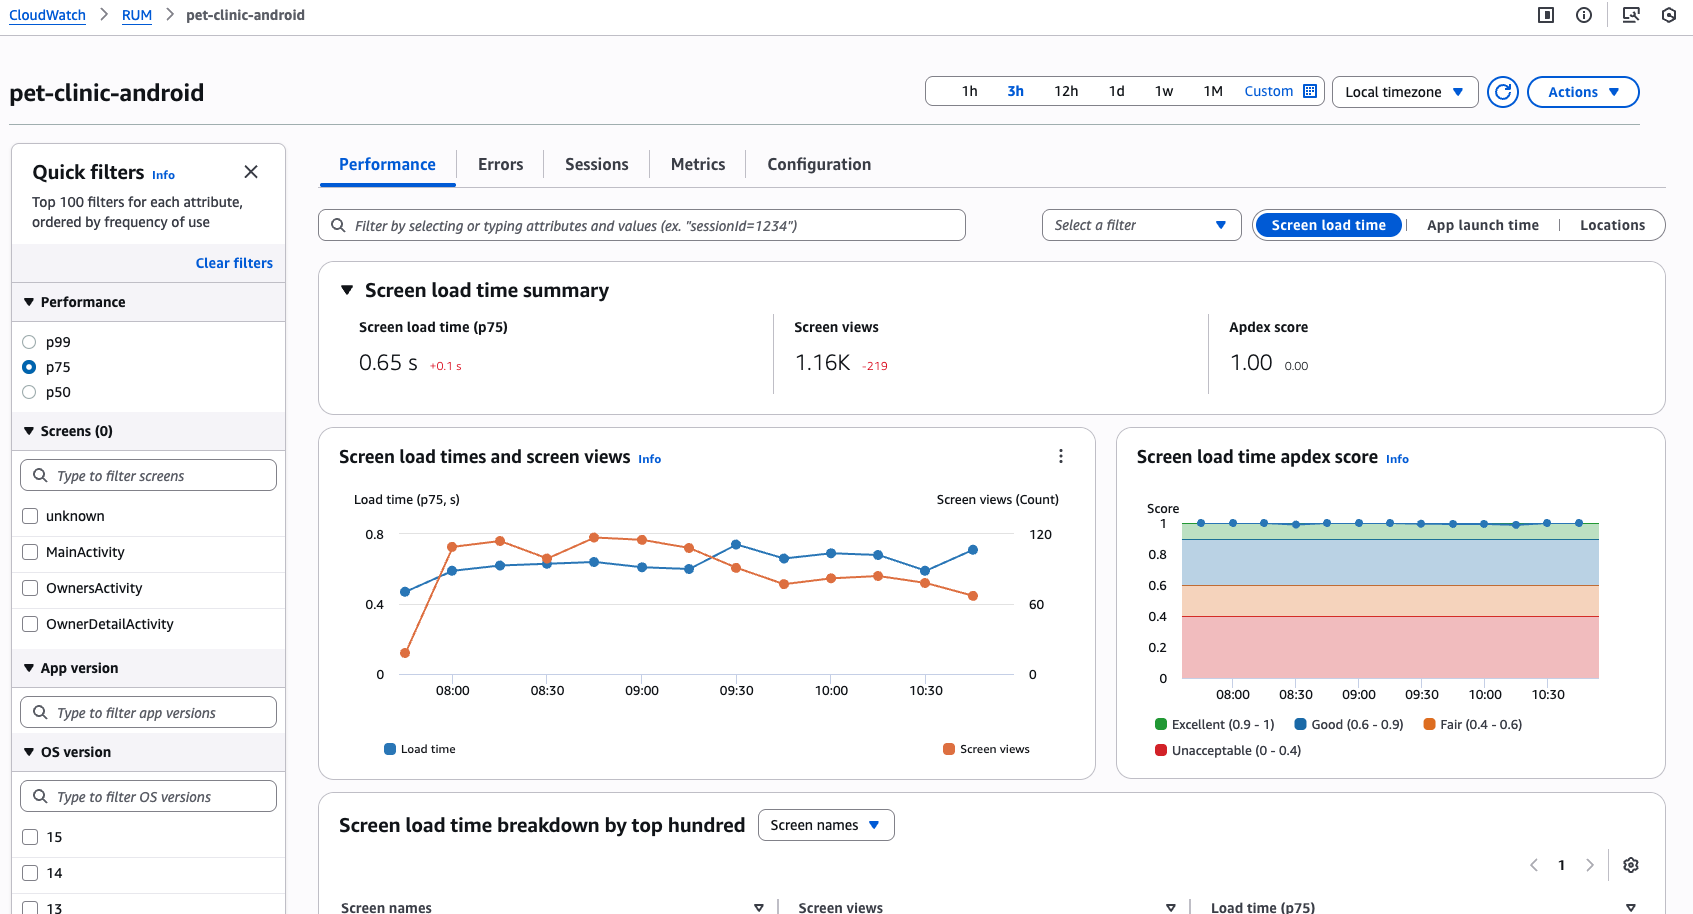
Know your user behavior
Understand exactly how customers experience your site by tracking real user monitoring (RUM) for your web and mobile applications. Catch site problems before customers do by running synthetic monitoring (canaries) that simulate critical customer journeys in CloudWatch. Make faster decisions to improve your customer experience using CloudWatch's built-in dashboards that highlight performance issues and trends instantly.
Featured Services and Solutions
Customers
PBS Improves Cost and Utility After Migration to Amazon CloudWatch
"The Amazon CloudWatch team has been indispensable in our migration away from our previous observability solution, motivated by cost and usability concerns. Our transition includes using CloudWatch Synthetics for TLS certificate monitoring and API endpoint surveillance, alongside application instrumentation via OpenTelemetry (OTEL) and the PHP SDK for tracing. Crucial performance metrics like Response Time; Error Rate which is derived from Error Count and Request Count; and Transaction Count are meticulously monitored. Anomaly detection systems are in place to spot irregularities in response time and error rates. We've also integrated PagerDuty and an SNS topic for issue alerts. Our partnership with CloudWatch transcends typical customer relationships, emphasizing collaboration and their remarkable responsiveness, exemplified when they rapidly implemented tailored solutions. This underscores the extraordinary value of our partnership with AWS and the CloudWatch team."
Brian Link, Director of Technical Operations
CCC Intelligent Solutions Streamlines and Accelerates Team Collaboration Using Amazon CloudWatch Application Signals
"The CloudWatch observability platform has improved our team's visibility into application performance, streamlining and speeding collaboration for our team. It delivers real-time insights into application performance and offers thorough end-to-end analytics, empowering teams to make more informed, data-driven decisions. As a result, we can more efficiently and proactively maintain and manage performance, allowing our teams to focus on innovation and excellence and helping shape a world where life just works better for our teams and customers."
Subrat Mishra, VP of Technology & Database Operations, Site Reliability Engineering, CCC