AWS for Games Blog
Game integrity and cheat detection using AWS Game Analytics Pipeline, Amazon Quick, and Kiro agentic IDE
Cheating in online games erodes player trust, damages competitive integrity, and can drive players away. Game studios need a scalable analytics pipeline to detect anomalous player behavior. In this post, we show how to build a game integrity proof of concept (POC) using the Guidance for Game Analytics Pipeline on AWS, Amazon Athena, and Amazon Quick. Walking through each phase with the Kiro prompts used, you’ll learn how to set this up for yourself.
Walkthrough overview
This guide extends the Game Analytics Pipeline with cheat detection capabilities across four phases:
- Data collection – Enrich game events with integrity metrics using a modified handler.py
- Data transformation – Create Athena SQL views to flatten, analyze, and flag data
- Data transportation – Import Athena datasets into Amazon Quick Sight
- Data analysis – Build machine learning (ML)-powered dashboards to surface cheating patterns
You’ll build an ML-powered dashboard that automatically detects cheating spikes across platforms.
The following diagram shows the four-phase flow from event generation through analysis. Game events flow from handler.py into Amazon Simple Storage Service (Amazon S3), are transformed by Athena SQL views (flattening, aggregation, and Z-score analysis), and are visualized in Quick Sight with ML insights and dashboards.
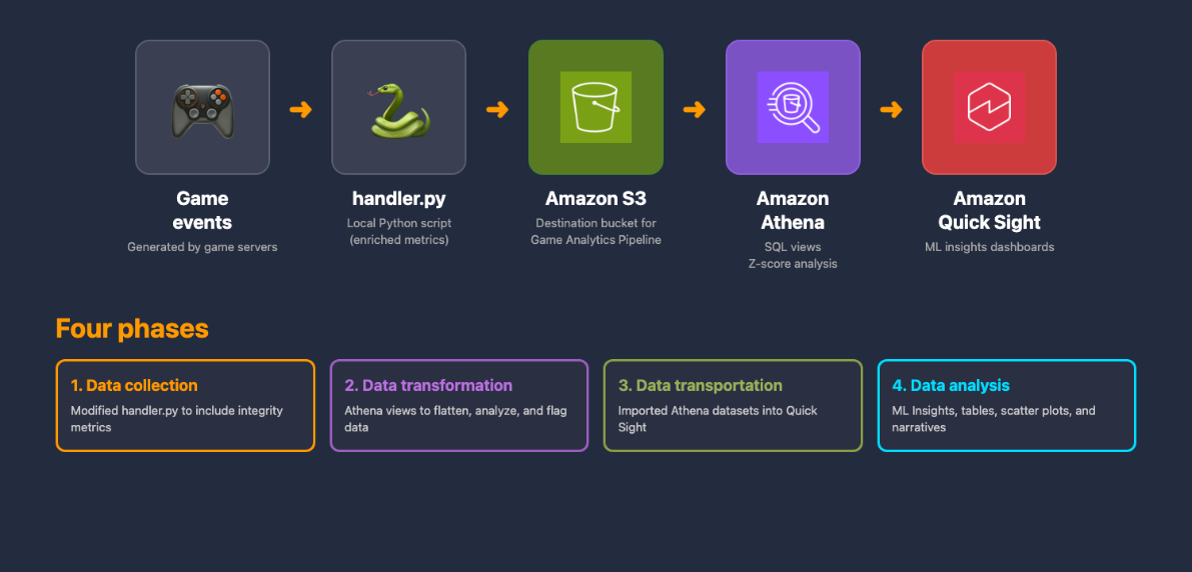
Figure 1: Architecture diagram
Prerequisites
To complete this walkthrough, you need the following:
- An AWS account with the Game Analytics Pipeline deployed
- Amazon Athena configured to query the pipeline’s S3 bucket
- Amazon Quick Sight. For more information, refer to the Amazon Quick Sight User Guide
- Python 3.9 or later for running the data generator
- Kiro (optional, but used throughout this guide)
- Familiarity with SQL and basic AWS Management Console navigation is helpful but not required
This walkthrough uses Amazon Kinesis and Amazon S3 for data ingestion and storage, Athena for SQL analytics, and Quick Sight for visualization and ML.
Data collection
The Game Analytics Pipeline includes a handler.py script (available in the GitHub repository) that generates simulated game events such as logins, purchases, and match results. By default, the match_end event contains only basic gameplay fields: match ID, map, result, experience gained, and spell used. To detect cheating, add metrics that capture suspicious behavior.
Add integrity metrics
After deploying the Game Analytics Pipeline, open its directory in Kiro:
- Under File, choose Open Folder.
- Select the cloned
guidance-for-game-analytics-pipeline-on-awsrepository. - Navigate to
source/services/events/handler.py. This is the script that generates simulated game events.
Use the following Kiro prompt:
Kiro prompt: I’m building a game integrity / cheat detection proof of concept using the Game Analytics Pipeline. The handler.py generates match events but doesn’t have the metrics I need for detecting cheating. I want to add fire-rate violations, max acceleration, reaction time, recoil patterns, and other integrity metrics to the match_end events. Also add a player_id field and a platform field (randomly chosen from PC, Xbox 360, iOS) for per-player and per-platform analysis. Increase the match_end event weight from 0.03 to 0.30 to generate more match data.
Kiro modified the match_end event to include new integrity metrics covering four cheat categories. Aim assist (aimbot) detection uses recoil_score, shots_per_sec, and avg_reaction_ms. Movement modification detection relies on max_accel, slope_violations, and air_control_ratio. Wallhack indicators include shots_no_los and shots_through_walls. Fire-rate exploit detection tracks fire_rate_violations, ammo_mismatch, and reload_cancels.
Kiro might generate slightly different variable names on each run (for example, fire_rate_violations or fireRateViolations). This is expected. Use whatever names Kiro generates and keep them consistent across subsequent phases. The exact names matter less than aligning them across your handler, SQL views, and Quick Sight datasets.
Spread timestamps for ML
ML insights need historical data spread over time to detect patterns. Use the following prompt:
Kiro prompt: The match_end events are all happening in a very short time window. There aren’t enough data points for ML insights to detect patterns. Spread the event timestamps randomly across the past 60 days instead of using the current time, and generate events in batches of 100.
Kiro modified generate_event() to assign each event a random timestamp within the past 60 days instead of using the current time. This gives ML insights enough historical data to build anomaly models.
Inject anomaly spikes
To validate that ML insights can detect cheating patterns, the data needs clear anomalies. Prompt Kiro:
Kiro prompt: I want to add anomaly spikes to the data so that ML insights have clear patterns to detect as anomalous. Create three distinct spike windows on different day ranges, each simulating a different cheat type (for example, aimbot, speed hacks, fire-rate exploits) with dramatically elevated metrics compared to the normal baseline.
Kiro added platform-specific anomaly spike windows to handler.py consisting of three distinct temporal clusters, each with a different cheat signature. For example, one window might simulate an aimbot wave with inhuman accuracy, another might simulate modded controllers with elevated fire-rate violations, and a third might simulate speed hacks with extreme acceleration values.
The exact day ranges, platforms, and metric values Kiro generates might differ from run to run. What matters is that you have three clearly separated spike windows with metrics well beyond the normal baseline. This gives ML insights clean separation between normal and anomalous patterns. After making these changes, run handler.py to send the enriched events to the pipeline.
Data transformation
Raw event data in Amazon S3 stores game metrics inside a nested JSON event_data field. To simplify repeated analysis and provide clean datasets for Quick Sight, create views that flatten and analyze the data.
- Input – Raw JSON events in Amazon S3 with nested
event_datafields - Output – Seven Athena views providing flattened metrics, Z-score anomaly flags, and aggregated summaries
- Why – Views provide reusability, proper type casting, and a clean interface for Quick Sight import
To flatten nested event data, in Kiro, prompt:
Kiro prompt: The event_data in the raw_events table is a nested JSON object. I need to be able to query the individual fields like fire_rate_violations, reaction time, etc. Give me the raw SQL to run in the Athena query editor. Don’t modify any project files.
Kiro created a gaming_events_flattened view using json_extract_scalar to extract each metric from the nested JSON with proper type casting. It also added derived columns: reaction_time_category (Fast, Average, or Slow), recoil_control_rating (Excellent, Good, Fair, or Poor), and total_violations (combined fire-rate and slope violations).
Fix timestamps
Prompt Kiro:
Kiro prompt: The event_timestamp is in Unix epoch format. ML insights need a proper datetime format to work correctly. Give me the raw SQL to run in the Athena query editor. Don’t modify any project files.
Kiro created a gaming_events_flattened_with_time view that converts Unix timestamps to a proper datetime column and extracts the platform field for grouping.
Build anomaly detection
Ask Kiro for the most effective approach:
Kiro prompt: What would be the most effective ways to represent the data to find anomalies? Give me the raw SQL to run in the Athena query editor. Don’t modify any project files.
Kiro recommended the Z-score method and created the anomalous_matches view, which calculates how many standard deviations each player’s metrics deviate from the population mean. Matches are flagged as CRITICAL (|z| > 3), SUSPICIOUS (|z| > 2), or NORMAL across four metrics: violations, reaction time, recoil score, and shots per second.
Create remaining views
Prompt Kiro for additional analysis views:
Kiro prompt: Now that we have the flattened gaming data with integrity metrics, what Athena views would be most useful for analyzing cheat detection patterns and player behavior? Give me the raw SQL to run in the Athena query editor. Don’t modify any of the project files.
Kiro recommended and created four additional views. The daily_platform_metrics view provides a daily rollup by platform that feeds ML insights anomaly detection directly. The player_performance_summary view aggregates per-player stats and violation totals. The map_performance_analysis view reveals per-map violation patterns and win rates. Finally, event_type_distribution offers a data composition overview. Create each view in the Athena query editor by running the SQL that Kiro generates.
Data transportation
With the Athena views in place, connect them to Quick Sight:
- On the Amazon Quick console, add Athena as a new data source.
- Select the database containing your views and import four datasets:
anomalous_matches,gaming_events_flattened_with_time,daily_platform_metrics, andplayer_performance_summary. - Create a new Quick Sight analysis to build visualizations from these datasets.
Quick Sight SPICE ingests the Athena results for fast, interactive exploration without re-querying Amazon S3 on every interaction.
Data analysis
With the datasets loaded, use Kiro to guide the visualization strategy.
ML insights: Anomaly detection by platform
Prompt Kiro:
Kiro prompt: I want to use ML insights to detect anomalies in total violations by platform over time.
Kiro recommended using the daily_platform_metrics dataset with event_date as the time dimension, platform as the category, and sum_total_violations as the metric. ML insights automatically detected these three injected spike windows without any manual threshold configuration. The following graph shows these results.
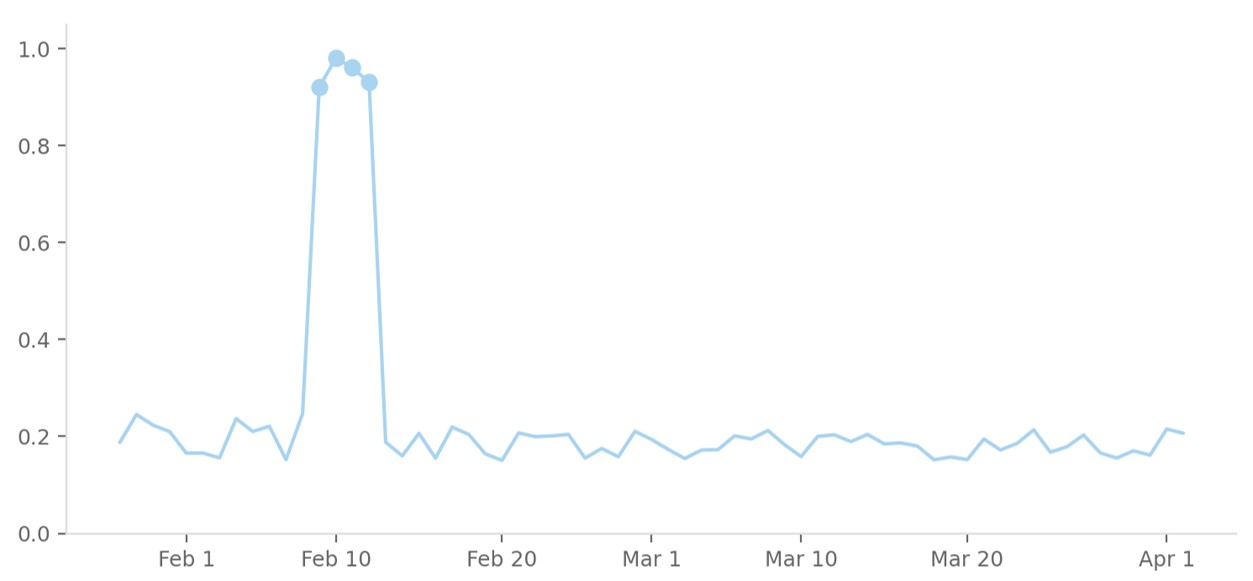
Figure 2: ML insights
We were able to detect the PC anomaly spike (days 10–12), with accuracy score jumping from a baseline of approximately 0.2 to nearly 1.0. Xbox 360 and iOS spikes were also detected at their respective windows.
Scatter plot
Prompt Kiro:
Kiro prompt: I want to visually see the relationship between recoil score and fire-rate violations across platforms to confirm the Xbox 360 modded controller spike.
Kiro recommended a scatter plot with fire_rate_violations on the X-axis and recoil_score on the Y-axis, colored by anomaly flag and sized by total_violations. The scatter plot visually separates normal players (clustered at low fire-rate violations and moderate recoil scores) from outliers. Players with both abnormally high recoil scores and excessive fire-rate violations are a hallmark of modded controller hardware. The following scatter plot shows up to 2,500 data points indicating normal players, clustered at center, and critical outliers with high Z-scores, separated by anomaly flag label.
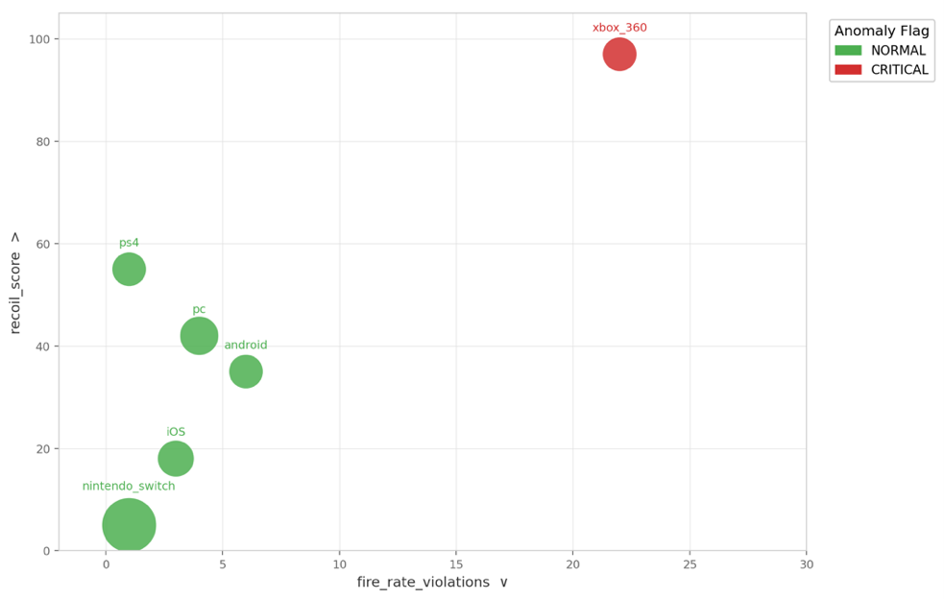
Figure 3: Recoil score and fire rate violations scatter plot
Violation table
Prompt Kiro:
Kiro prompt: The ML insights show platform-wide spikes, but I need to identify which specific players are cheating.
Kiro recommended a table ranking players by total_violations descending from the anomalous_matches view, with critical-flagged players at the top. Kiro explained that although ML insights detect anomaly spikes across platforms over time, the violations table is the only way to drill down to individual cheaters. Therefore, you can surface specific player IDs responsible for the flagged behavior.
The following table ranks players by highest total_violations and was generated from the anomalous_matches view. Although ML insights detect platform-wide spikes over time, the violations table is the only way to identify individual cheaters. It surfaces specific player IDs and their critical anomaly flags for viewing.
| player_id | platform | total_violations |
|---|---|---|
| 606e804c-ea00-4320-95ad-8e53820f3d28 | iOS | 50 |
| ad97be51-ad0f-4ab5-9c58-c692bd2c53e9 | iOS | 46 |
| 626bc429-da56-4638-a2e7-7d110f051483 | xbox_360 | 42 |
| c289504d-7d06-4667-afe1-4e825e547ee0 | iOS | 36 |
Narratives
Prompt Kiro:
Kiro prompt: I want a high-level summary of the data for stakeholders.
Kiro recommended adding Quick Sight narrative visuals that generate natural language summaries, including total violations across platforms, which platforms show the highest anomaly rates, and key statistical highlights. Narratives update dynamically as the underlying data changes.
For example, a narrative might surface: “PC platform showed 6x normal violation rate during days 10–12, driven primarily by fire_rate_violations.” This would give security engineers immediate, actionable context without manual chart interpretation.
Cleaning up
To avoid ongoing charges:
- Delete the Quick Sight analysis and datasets.
- Drop the seven Athena views (
gaming_events_flattened,gaming_events_flattened_with_time,anomalous_matches,daily_platform_metrics, player_performance_summary,map_performance_analysis, andevent_type_distribution). - If you deployed the pipeline for this guide, follow the cleanup instructions to delete the stack.
Conclusion
This proof of concept extends the Game Analytics Pipeline with custom integrity metrics, Z-score anomaly detection in Athena, and ML-powered dashboards in Amazon Quick Sight. Kiro accelerated each phase: Python data generator changes, complex SQL view authoring, and visualization strategy recommendations.
To get started, visit the Game Analytics Pipeline solution page and the GitHub repository. If you have questions or suggestions, leave a comment on this post.