AWS Cloud Operations Blog
Log analysis with facets, correlation, enrichment, and automation in Amazon CloudWatch Log Analytics
Teams working with distributed applications accumulate logs across multiple log groups, including application logs, access logs, and audit trails. When something needs investigating, an engineer opens the console and starts writing queries from scratch. The same query gets written differently by different people. The results lack context because the log event does not contain who owns the service or what environment it belongs to. Checking two log groups means running two separate queries and manually comparing results. And when the investigation is done, the query disappears from the console history. These are common friction points when working with logs at scale. The Log Analytics feature in Amazon CloudWatch now includes capabilities that address them directly.
- Facets for exploring log data visually without writing a query.
- Lookup tables for enriching query results with external metadata.
- Parameterized queries for saving reusable templates with fill-in variables.
- JOIN and sub-queries for correlating data across log groups in a single query.
- Scheduled queries for running queries automatically and delivering results to Amazon Simple Storage Service (Amazon S3) or Amazon EventBridge.
This post walks through each capability with working examples, showing the customer problem each one solves, how to set it up, and how to save it for your team. A short example at the end shows how the capabilities compose together.
Where these features fit in your observability strategy
The AWS Observability Maturity Model defines four stages of observability maturity. The features in this post support Stage 3 (Advanced Observability), where teams correlate signals across sources, detect anomalies, and gain contextual understanding of issues. They complement the tools you use at earlier stages.
| Stage | Focus | AWS tools |
|---|---|---|
| Stage 1: Foundational | Collecting telemetry (metrics, logs, traces) | Amazon CloudWatch metrics, Amazon CloudWatch Logs, AWS X-Ray |
| Stage 2: Intermediate | Analysis, alerting, visualization | Amazon CloudWatch alarms, Amazon CloudWatch dashboards, Amazon GuardDuty |
| Stage 3: Advanced | Cross-signal correlation, contextual enrichment, anomaly detection | Amazon CloudWatch (Log Analytics features: JOIN, sub-queries, lookup, parameterized queries, scheduled queries) |
| Stage 4: Proactive | AI/ML-driven root cause, automated remediation | Amazon CloudWatch anomaly detection |
At Stage 3, teams move beyond individual metrics and traces to correlate data across multiple sources with custom logic. The features in this post facilitate that correlation within your log data. The Log Analytics features covered here are for log analysis that spans multiple log groups. They apply your organization’s business rules and produce reusable templates your team can share.
Prerequisites
- To follow this walkthrough, you need: An AWS account with structured logs flowing to at least two Amazon CloudWatch log groups (the examples use
/demo/security/api-activityand/demo/security/access-logs). - AWS Identity and Access Management (IAM) permissions for the following actions:
logs:PutQueryDefinition,logs:StartQuery,logs:DescribeQueryDefinitions,logs:GetQueryResults,logs:PutIndexPolicy,logs:DeleteQueryDefinition,logs:DeleteIndexPolicy - AWS CLI version 2.34.56 or later installed and configured.
- Node.js 18 or later and AWS Cloud Development Kit (AWS CDK) version 2.100 or later installed.
- Basic familiarity with CloudWatch Logs Insights query syntax (fields, filter, stats, sort).
To deploy the example environment with sample log data, use the companion CDK stack in the sample-cloudwatch-logs-advanced-analysis-environment GitHub repository.
The stack creates both log groups (/demo/security/api-activity and /demo/security/access-logs) and pushes sample events matching the schemas used in this post. Clone the repository and deploy the stack using the following commands.
The cdk bootstrap command is required only once per account and region. After the stack deploys successfully (approximately 5 minutes), the log groups begin receiving sample events. Wait 2–3 minutes for log data to accumulate before running the queries in this post.
Set your Region for this terminal session so you can omit --region from the CLI commands that follow:
export AWS_REGION=<your-region>
Replace <your-region> with the region where you deployed the CDK stack. This variable persists for the current terminal session only.
Alternatively, if you already have structured logs flowing to CloudWatch, you can skip the deployment and use your own log groups throughout the walkthrough.
Example environment
Figure 1 shows the example environment used throughout this post. The example environment has two log groups.
- The first (
/demo/security/api-activity) contains API activity events with fields likeeventSource,eventName,sourceIPAddress,errorCode, anduserIdentity_principalId. - The second (
/demo/security/access-logs) contains application access logs with fields likeuserId,resource,action, andsourceIP. - A lookup table (which you will create in the Lookup tables section) maps account IDs to organizational metadata.
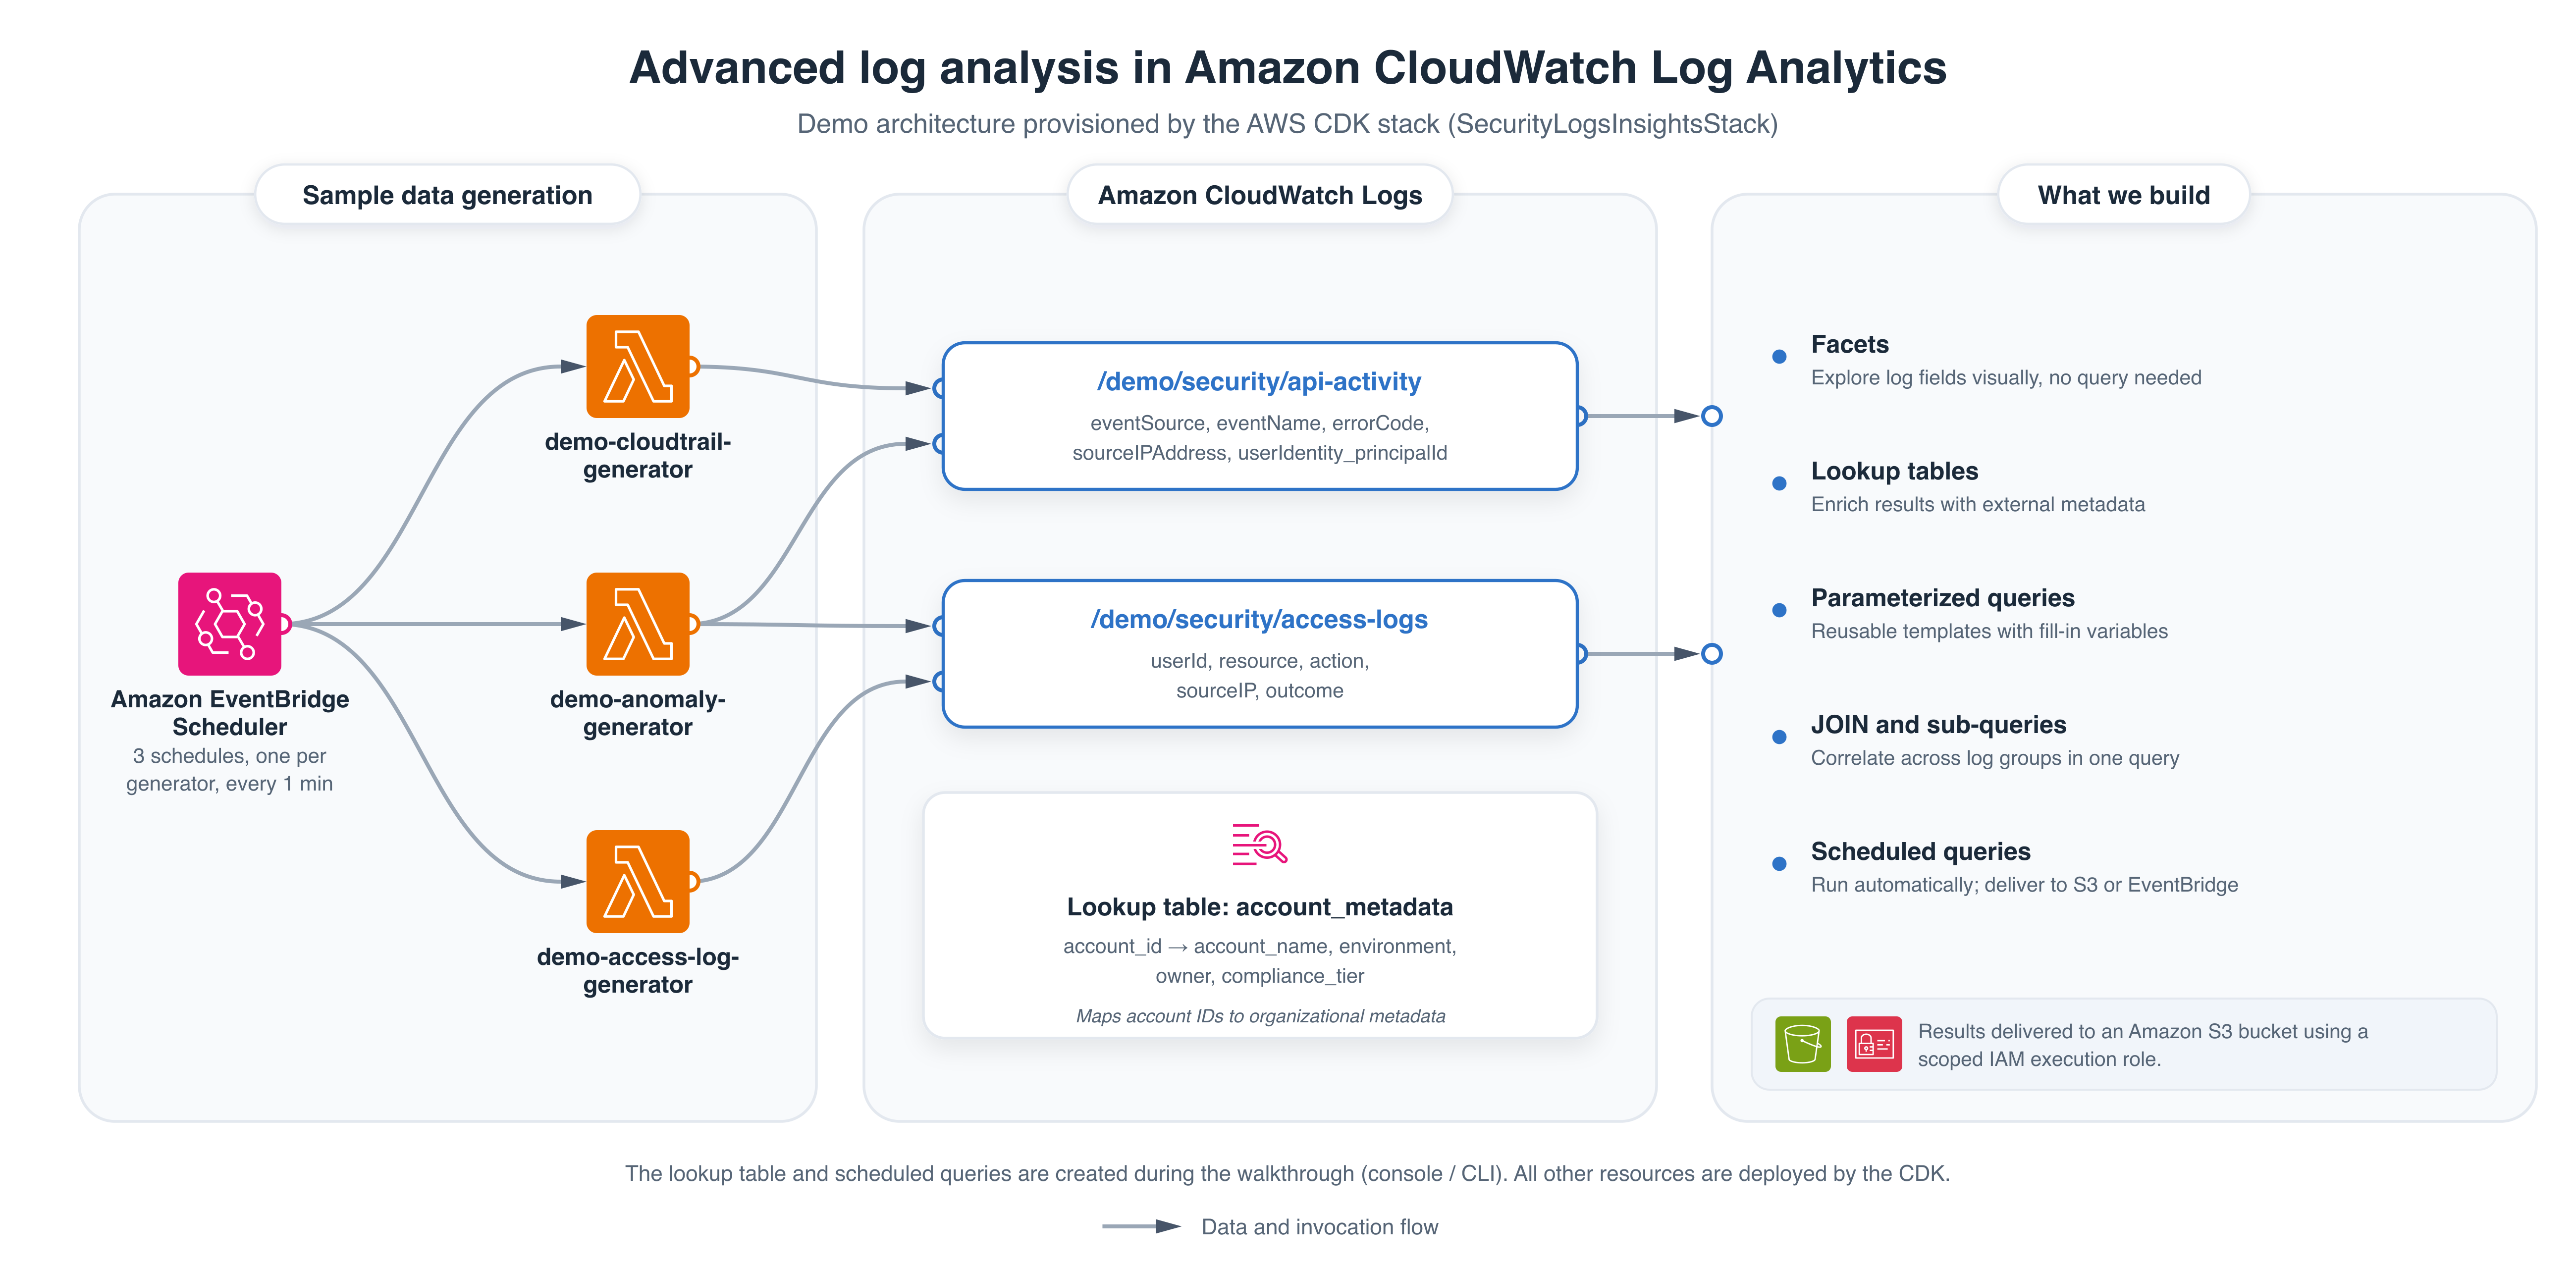
Figure 1: Example environment showing log sources, key fields, and lookup table
Facets for visual exploration
Problem: “I want to see what patterns exist in my logs before I write a query. I do not know what to filter on yet.”
With facets, you first run a query to load log events, and CloudWatch Log Analytics displays interactive facets in the right panel based on your indexed fields. Each facet shows the distribution of values for that field. You can select a facet value to add it as a filter, then run the query again to see only the matching results.
Explore logs with facets
To explore your logs with facets, follow these steps:
- Open the CloudWatch console and under Logs, select Log Analytics.
- In Log Analytics, run the following query which includes the
errorCodefacet filtered toAccessDenied. Replace123456789012with your AWS account number:
- Run the query. The results now show only events where
errorCodeisAccessDenied, displaying the correlatedsourceIPAddressvalues for each denied request.
Figure 2 shows the errorCode facet filtered to AccessDenied, with the results displaying the correlated sourceIPAddress values.
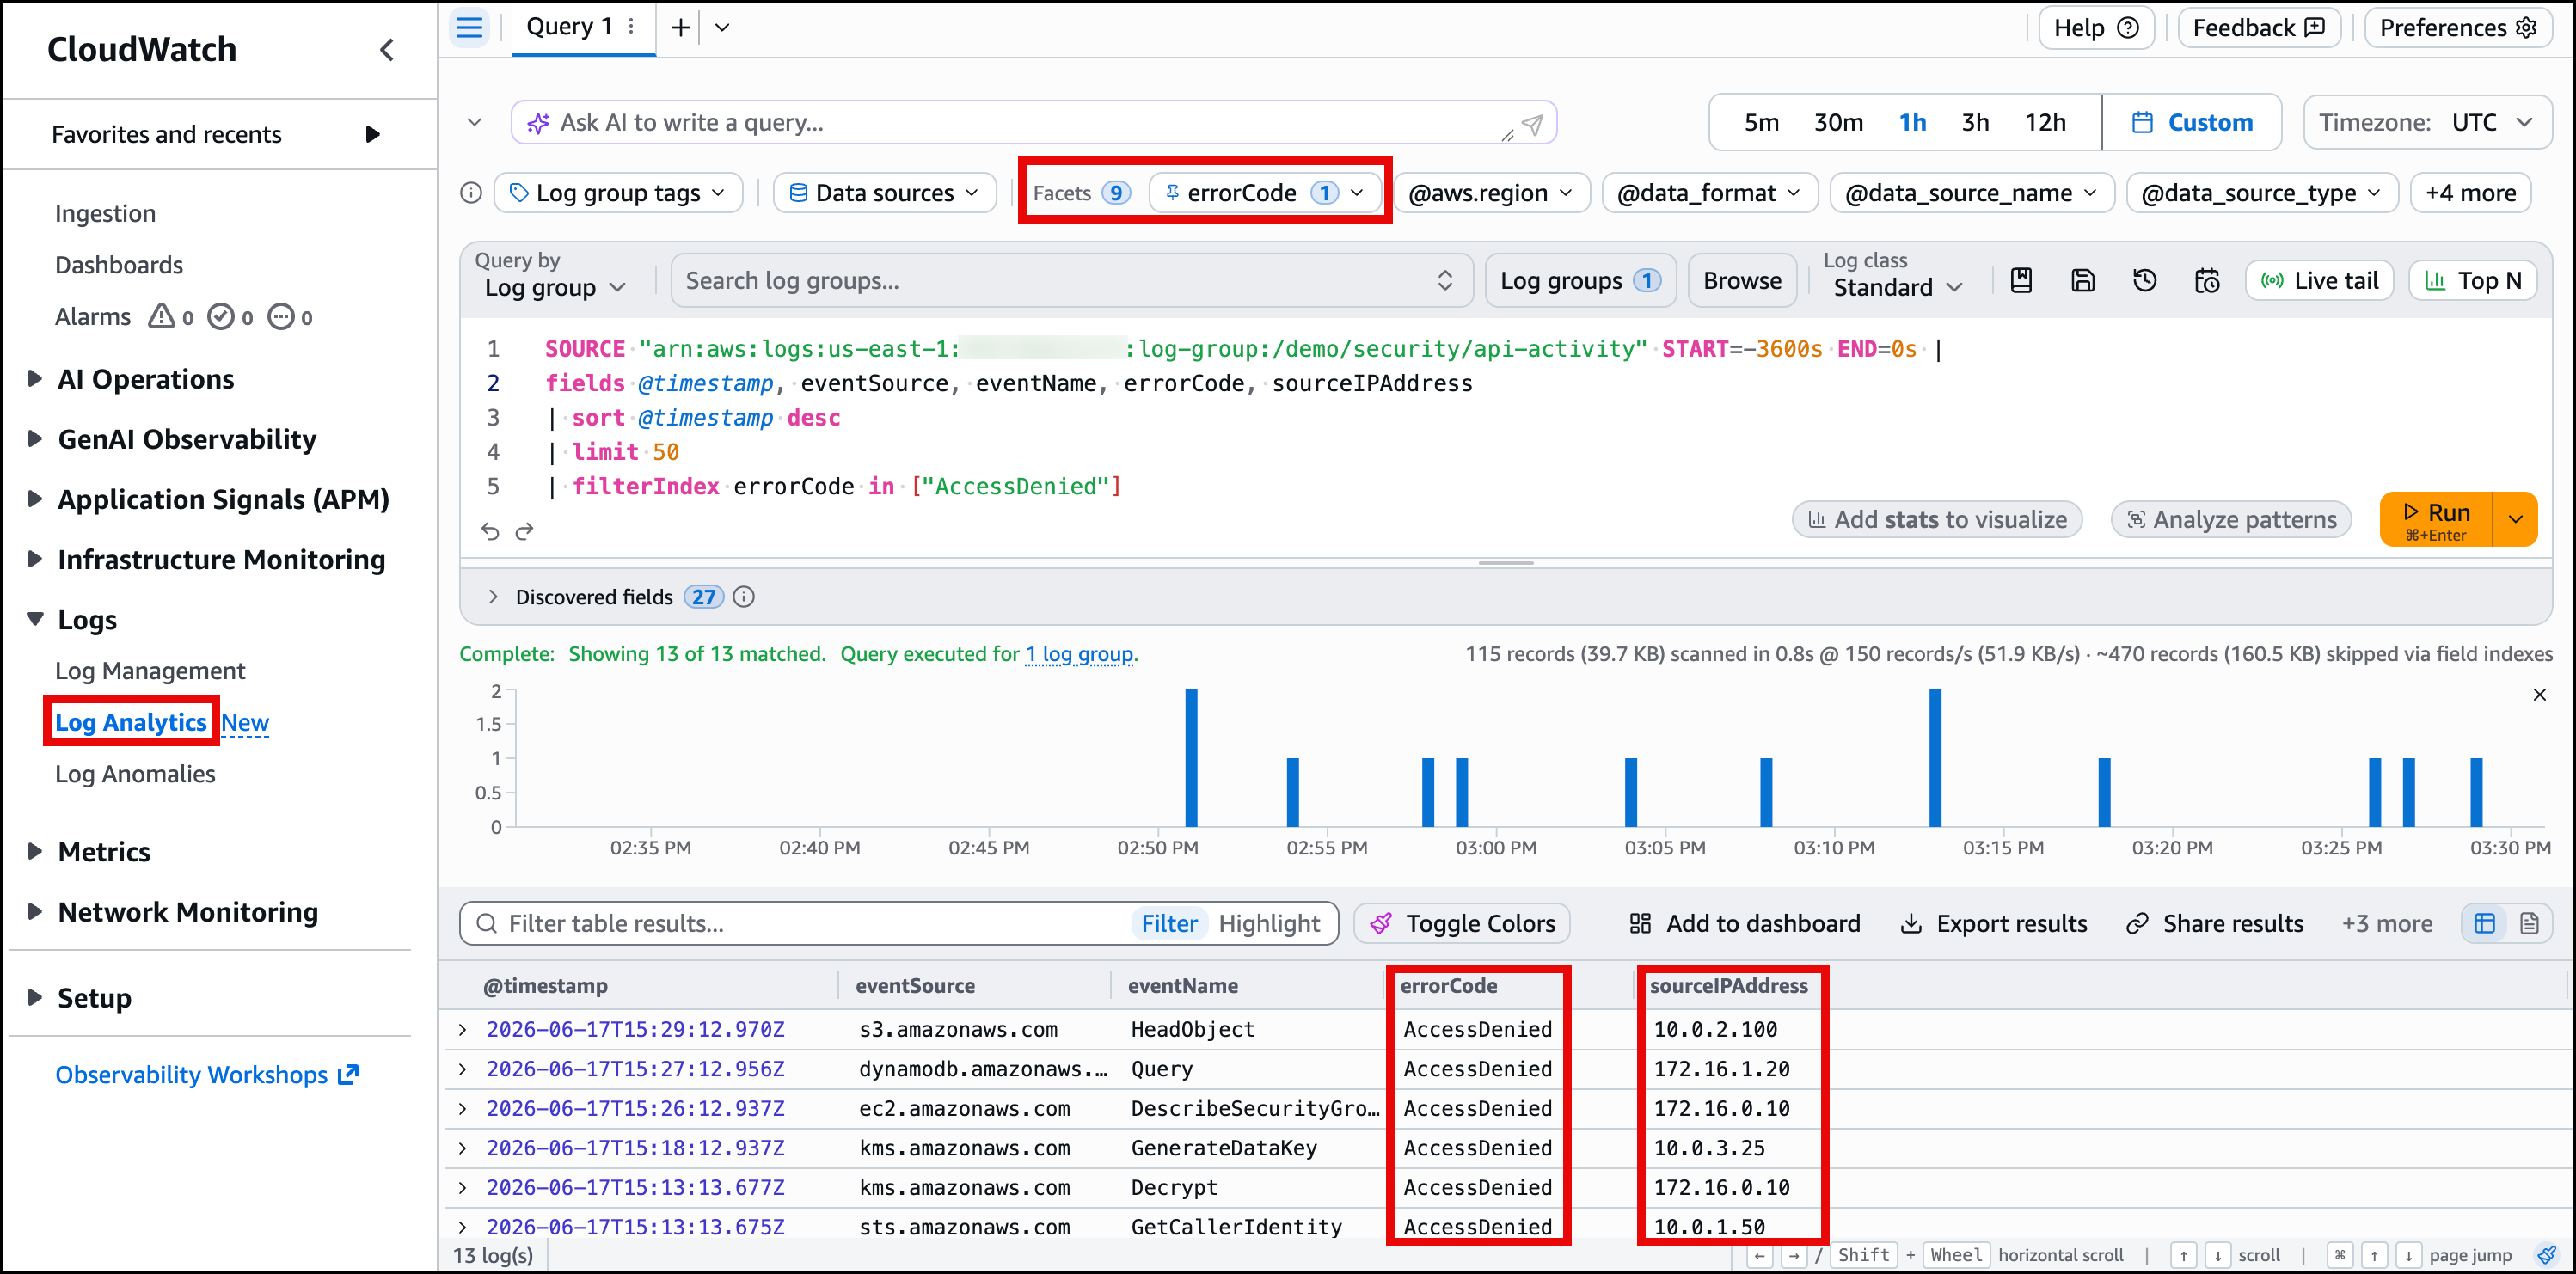
Figure 2: Facets showing errorCode distribution with AccessDenied selected as a filter
Default facets
Every log group includes four default facets.
@aws.region, the AWS Region that generated the log event@data_format, the log data format@data_source_name, the log group name@data_source_type, the log source type (for example, Lambda, ECS, EC2)
These work out of the box. No configuration required. Figure 3 shows how the default facets appear in the Log Analytics console before any custom index policies are applied.
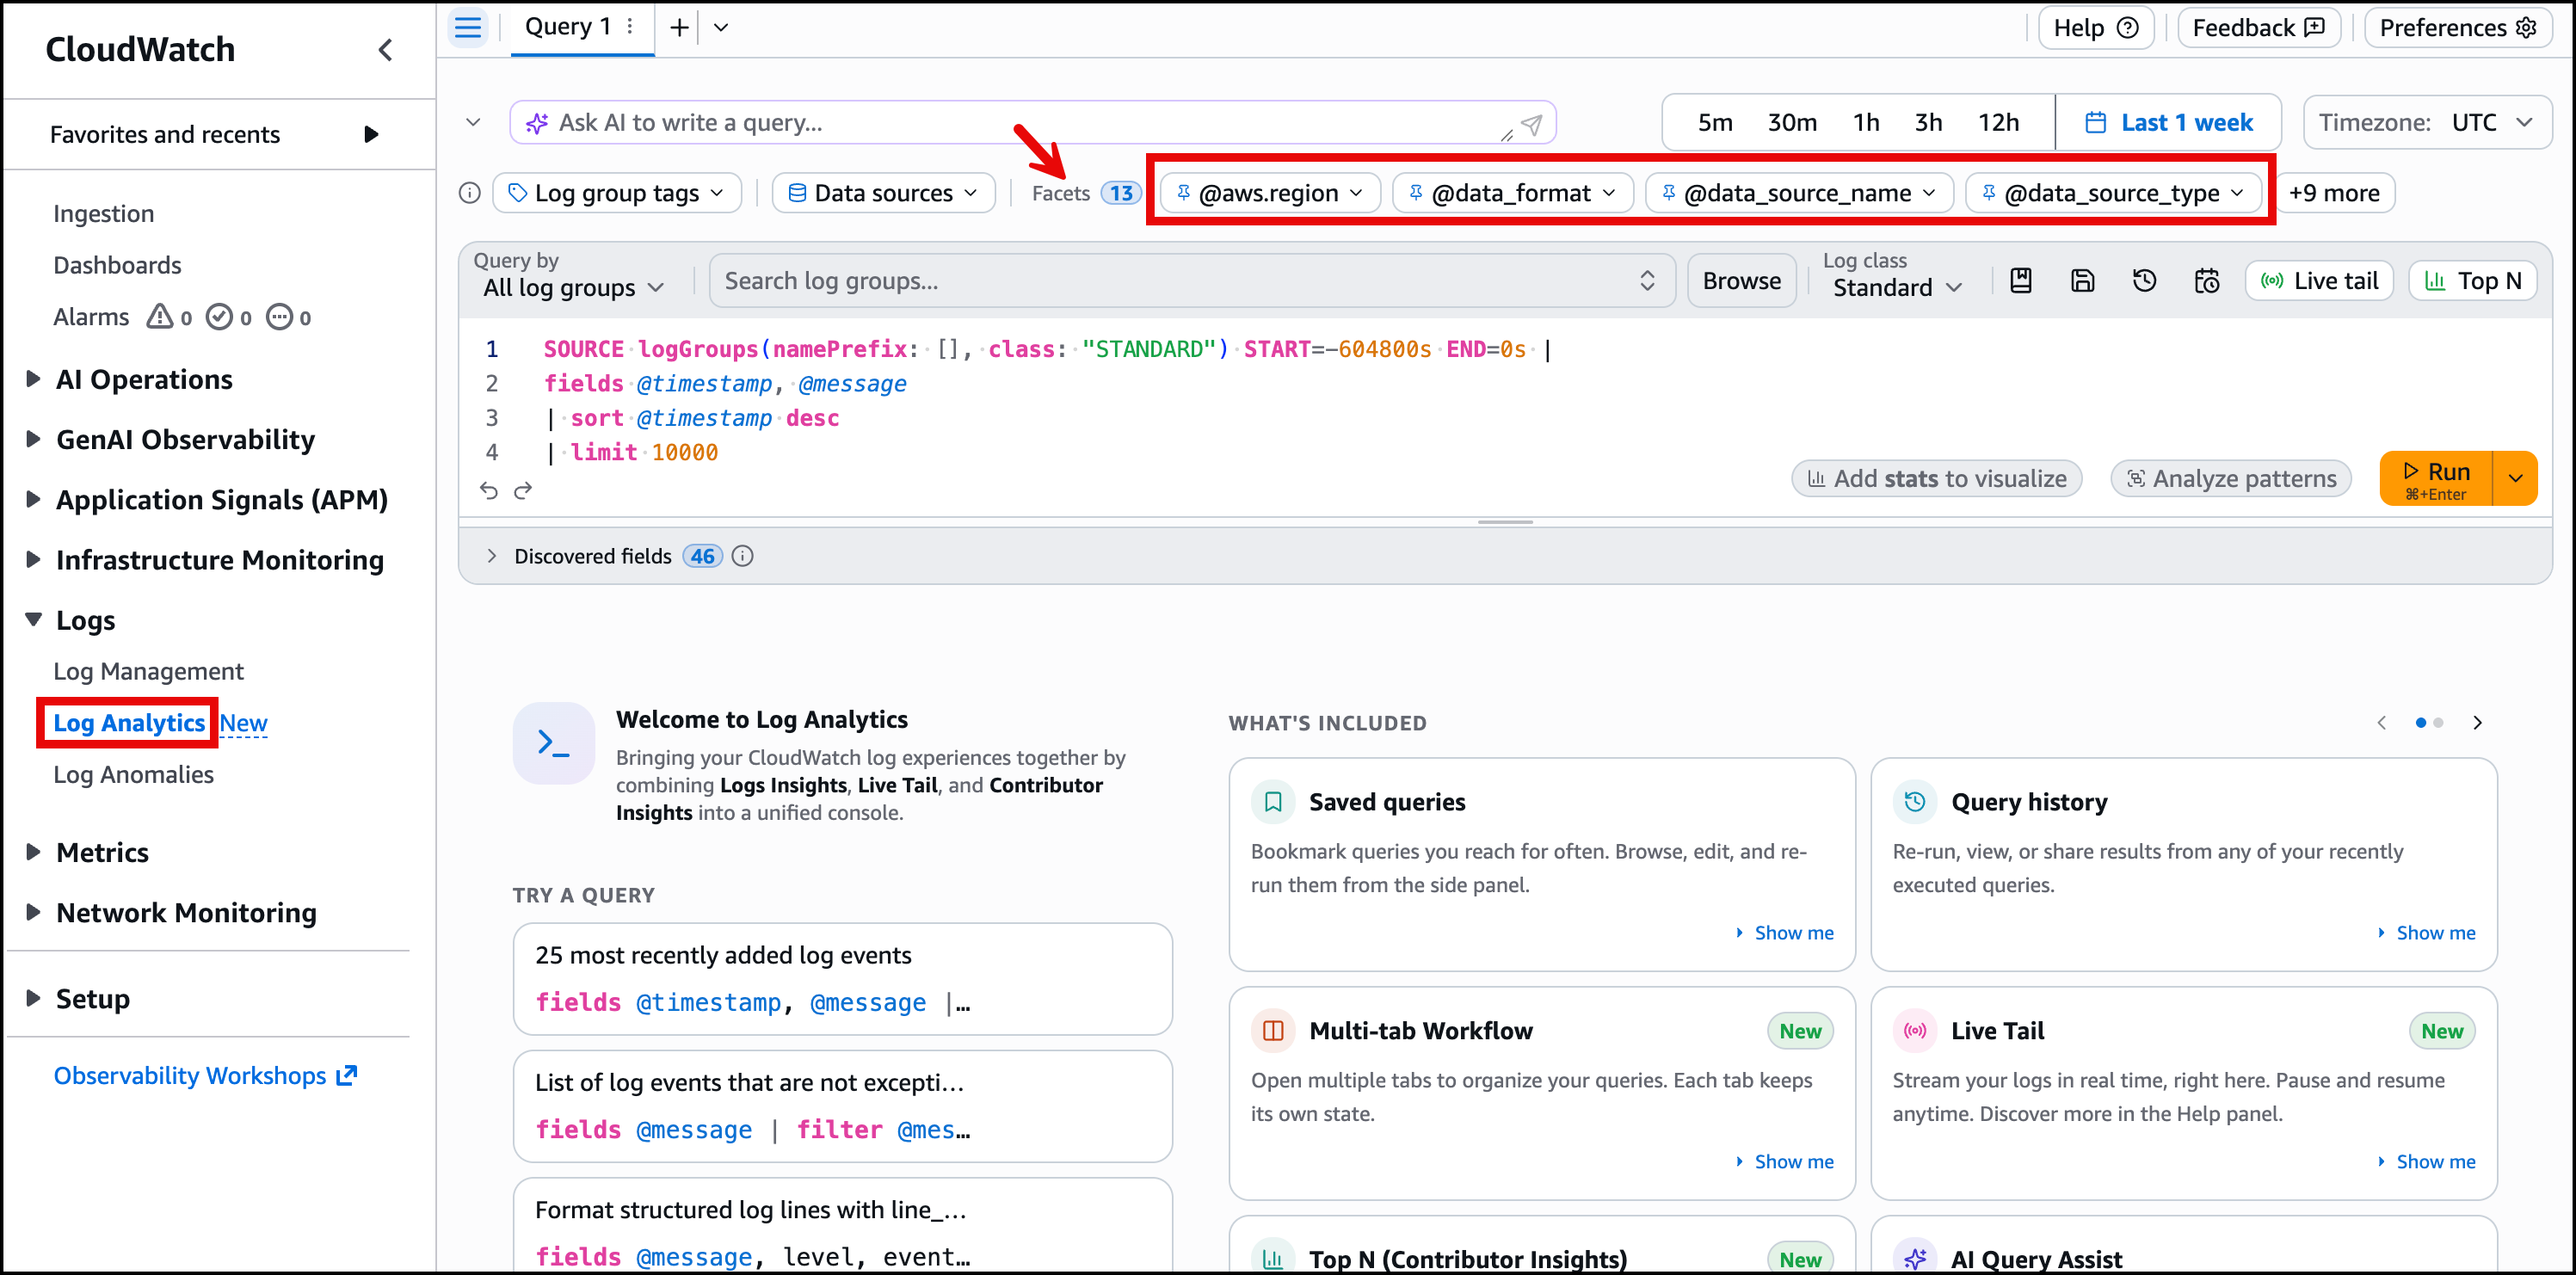
Figure 3: Default facets panel showing @aws.region, @data_format, @data_source_name, and @data_source_type
Creating custom facets using index policies
If you deployed the companion CDK stack, the index policies for (/demo/security/api-activity and /demo/security/access-logs) are already in place. The commands below show what the stack created, so you can inspect or replicate them in your own environment.
Default facets are useful but generic. For your application logs, you want facets on fields that matter to your team. You define index policies per log group, so create one for each of your two log groups with fields relevant to their content. For the API activity log group, index the fields like eventSource, eventName, errorCode, and sourceIPAddress.
For the access logs group, index fields are useful for tracking who accessed what.
After a few minutes, these fields appear as selectable facets in the Log Analytics console. An engineer can run a query, then chooses errorCode in the right facet panel to see the distribution of values. Selecting a specific value like AccessDenied adds it as a filter. Running the query again returns only matching events, without the engineer needing to manually rewrite the query syntax.
Best practice for facet field selection
Index policies work best on low-cardinality fields. Facets with more than 100 unique values each day are classified as high-cardinality, and their values are not displayed in the console. In this example, eventSource, errorCode, and userIdentity_accountId were chosen because they have a small number of distinct values and are useful for visual exploration. For more information on facet field selection, see Use facets to group and explore logs.
Lookup tables for contextual enrichment
Problem: “My log events contain a service name or account ID, but I need to know who owns it, what environment it belongs to, and who to contact. That information lives in a spreadsheet, not in the logs.”
With lookup tables, you can enrich query results with external metadata. Upload a CSV once, and any query can reference it to add columns that do not exist in the original log event.
Downloading the CSV file
In this example, the lookup table maps account IDs to organizational context. Download the account-metadata.csv file from the companion GitHub repository and save it to your computer.
Uploading the lookup table
Upload the CSV file as a lookup table named account_metadata using the following steps:
- Open the CloudWatch console.
- In the navigation pane, choose Settings.
- Choose the Logs tab.
- Scroll to Lookup tables.
- Choose Manage.
- Choose Create lookup table.
- Enter
account_metadataas the table name. - Upload the
account-metadata.csvfile you downloaded earlier. - Choose Create lookup table.
You can verify the table is queryable. In Log Analytics, run the following query which includes the /demo/security/api-activity log group. Replace 123456789012 with your AWS account number:
If account_name, environment, and owner populate in the results, the table is working. Figure 4 shows the query output with the enriched organizational columns alongside the original log fields.
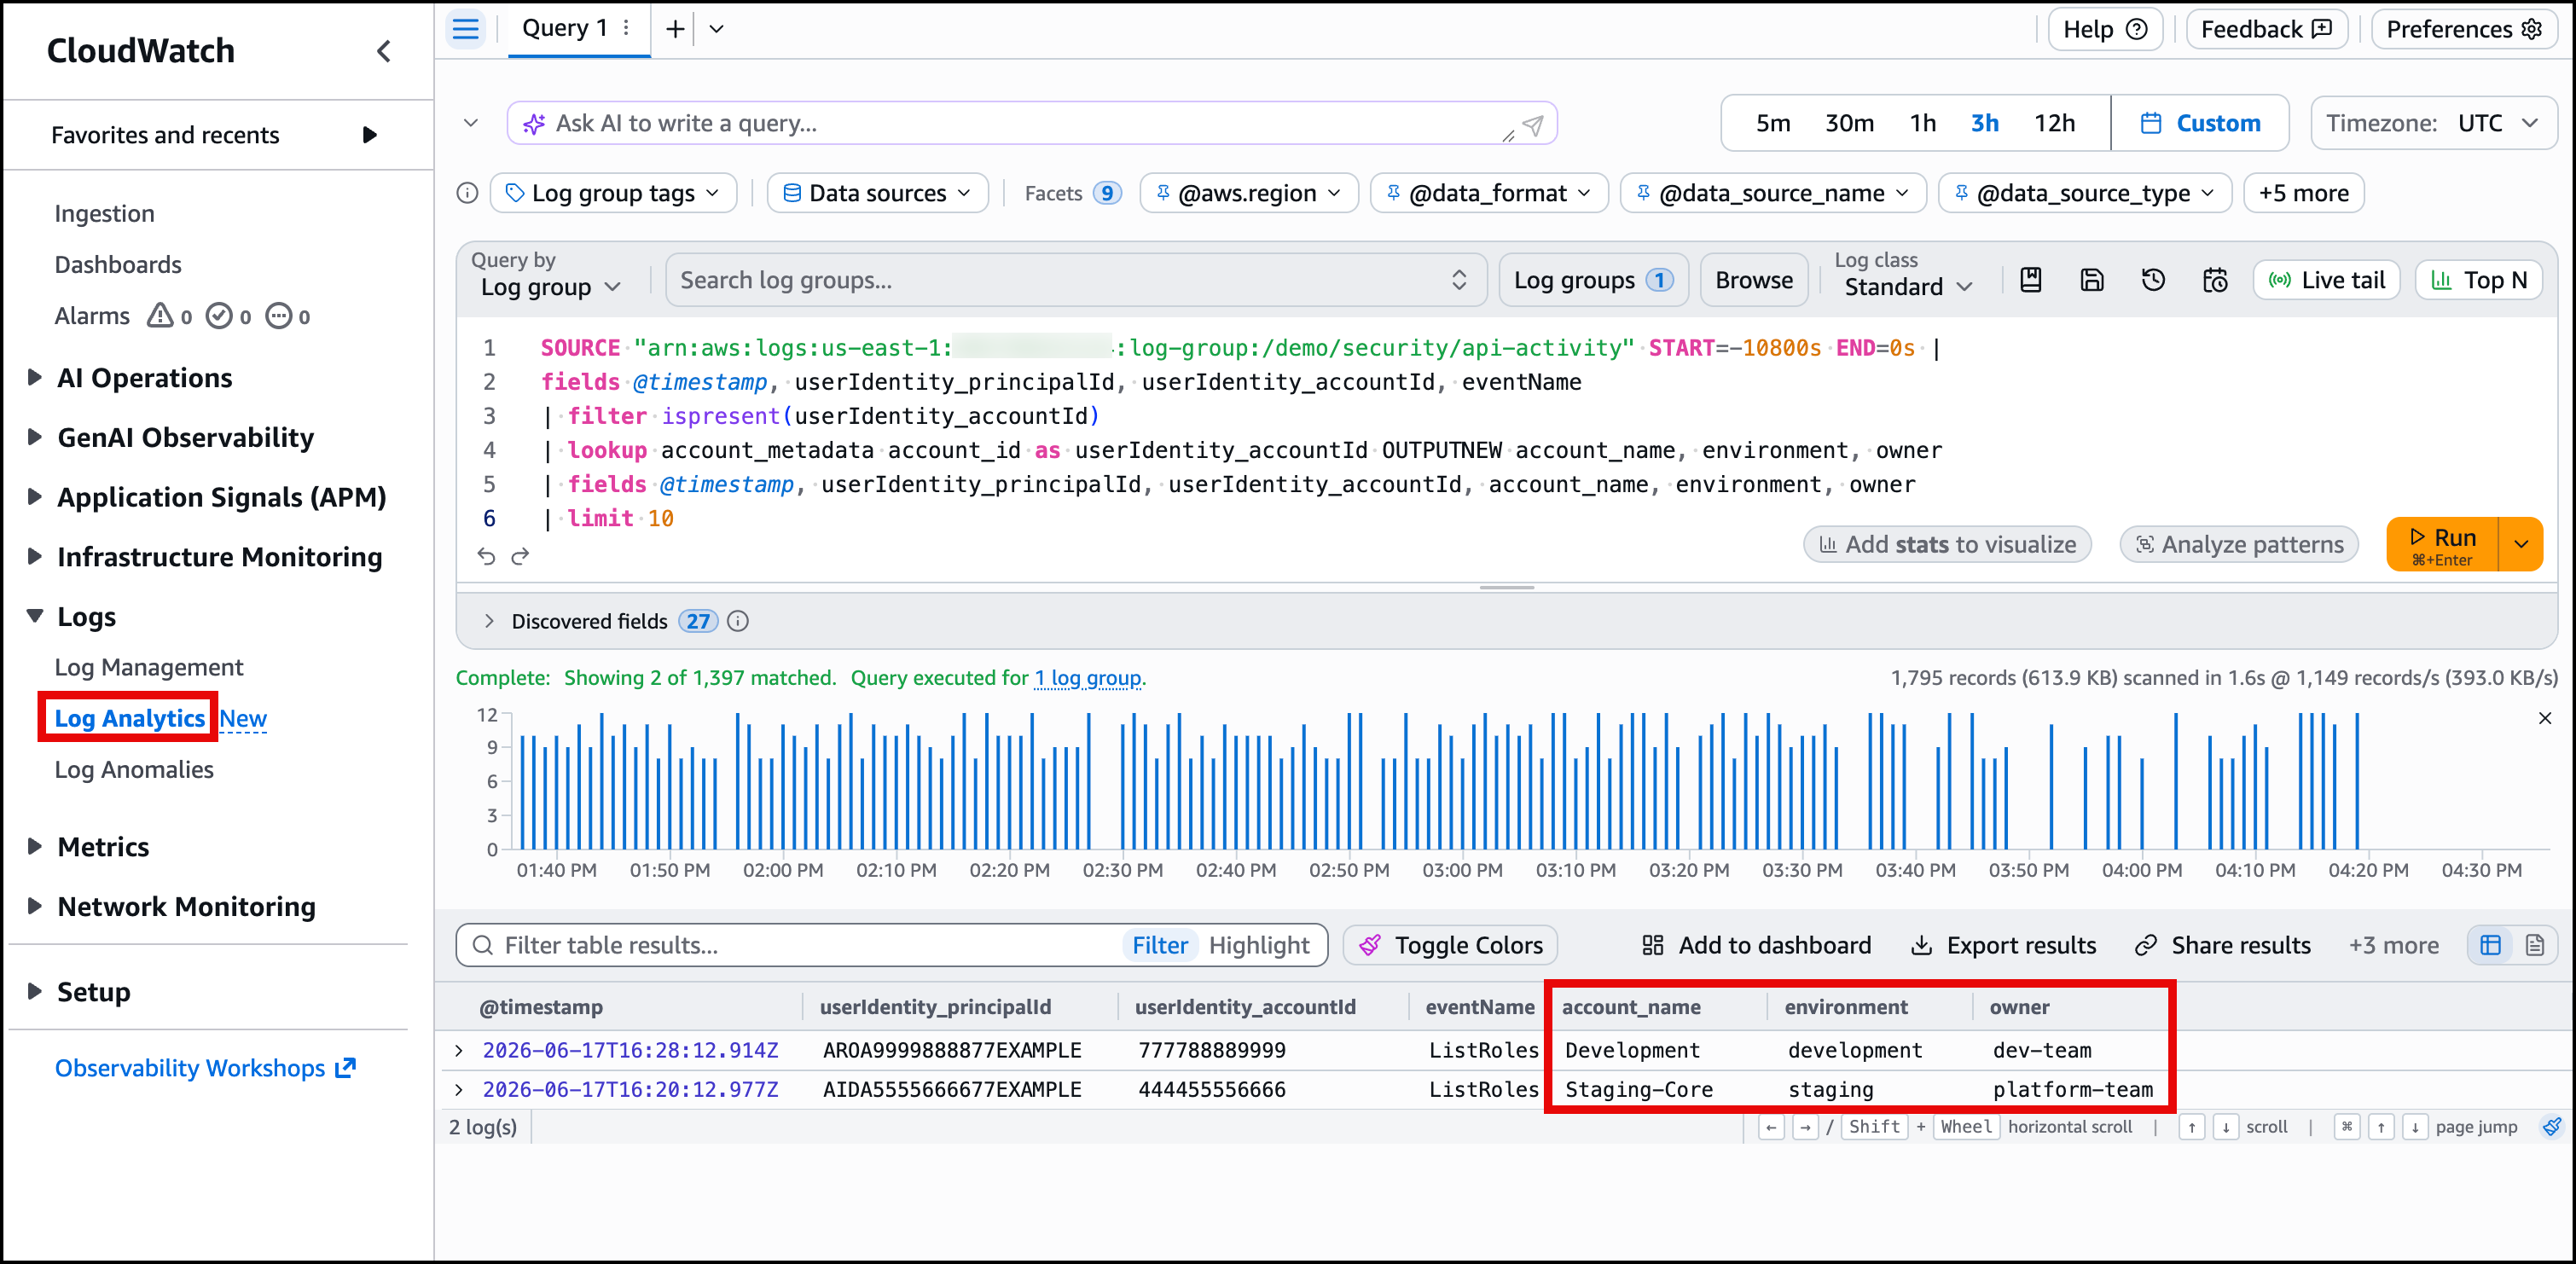
Figure 4: Lookup query results showing account_name and owner columns enriched from the CSV
Parameterized queries for reusable templates
Problem: “I write the same query every time with different values. New team members do not know what queries to run. There is no shared library of useful queries.”
With parameterized queries, you save a query template with {{parameter_name}} placeholders. When someone loads the saved query from the console, the parameters are replaced with default values that they can adjust before running. The query appears in the Saved and sample queries panel, discoverable by the whole team.
Creating a parameterized query
If you deployed the companion CDK stack, the Security/PrincipalActivityAudit query definition is already created. The command below shows what the stack deployed, so you can inspect or replicate it in your own environment.
In this example, create a query that shows all activity for a given principal, enriched with account metadata from the lookup table. The {{principalId}} parameter lets any team member run this query for any principal without rewriting it.
Parameters
| Parameter | Description | Default value |
|---|---|---|
principalId |
The principal ID to investigate | AIDA1234567890EXAMPLE |
To make this query available to your team, save it as a query definition using the following CLI command.
To see the saved query, open Saved and sample queries in the Log Analytics console, navigate to the Security folder, and choose PrincipalActivityAudit. The query loads with the principalId parameter input field pre-filled with the default value AIDA1234567890EXAMPLE. Figure 5 shows this view.
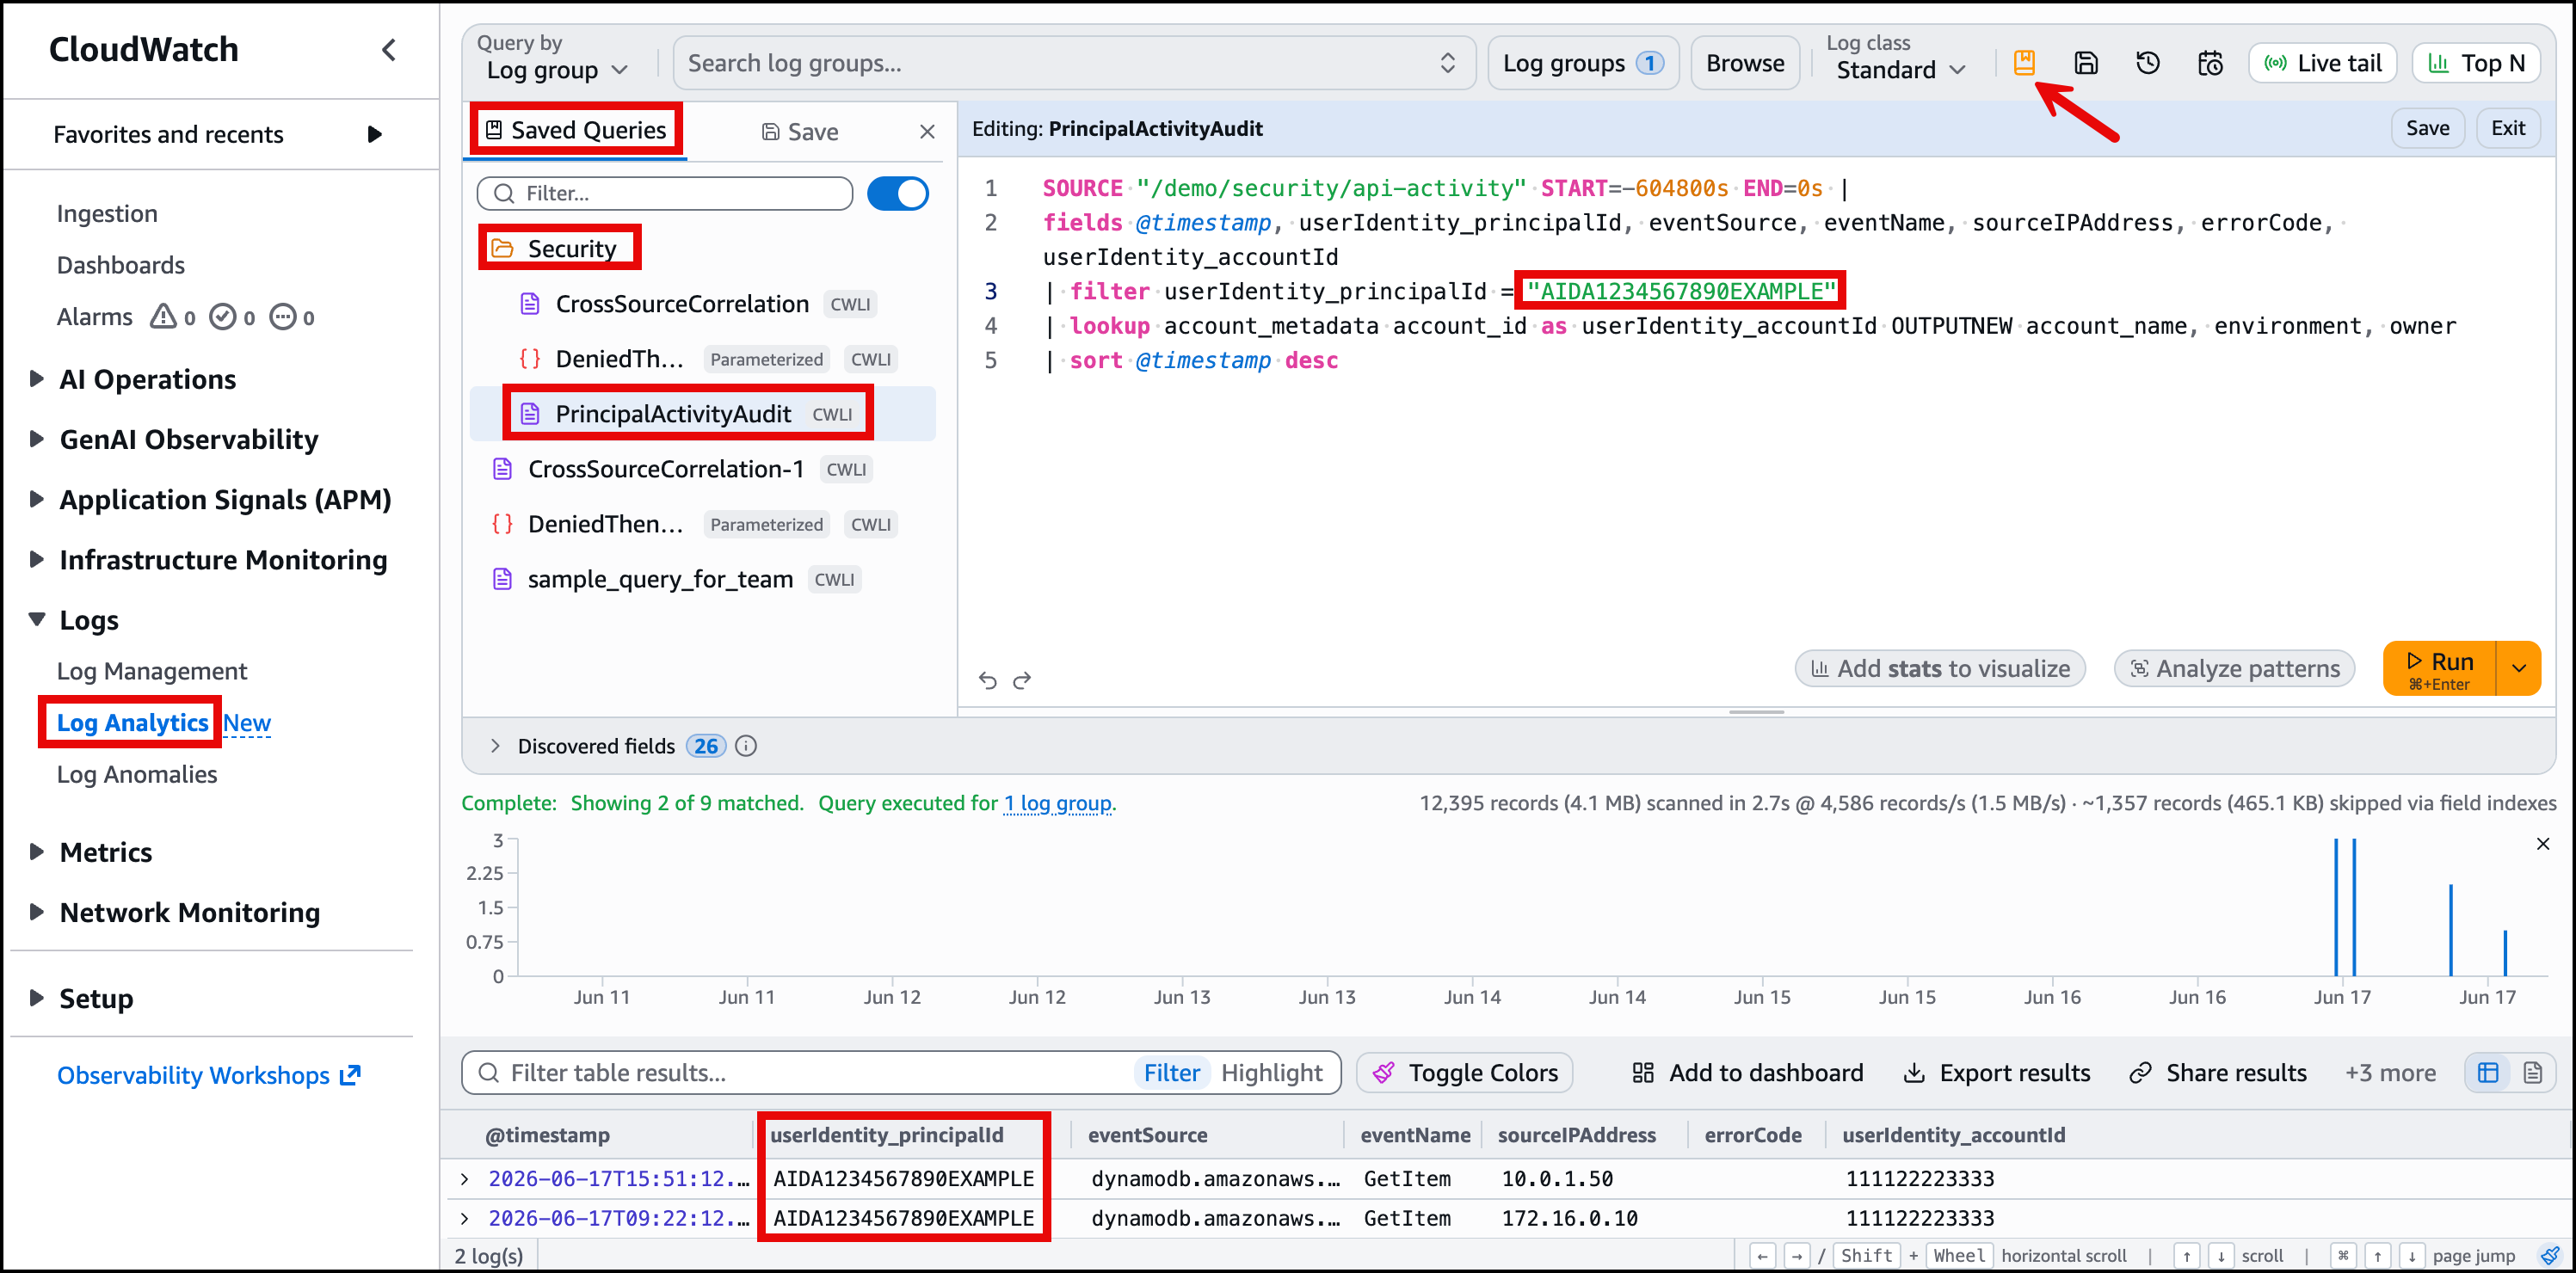
Figure 5: Saved parameterized query showing the principalId input field in the Log Analytics console
Any team member can now open Saved and sample queries, find the Security folder, choose PrincipalActivityAudit, adjust the principal ID, and run it. No query writing required.
Enabling correlated anomaly data
The remaining sections (JOIN, Sub-queries, and Scheduled queries) correlate data across both log groups. For meaningful results, all three log generators need anomaly mode enabled so they produce correlated events from IP 198.51.100.42. Run the following commands in AWS CloudShell in the same Region as you have deployed the CDK stack.
Wait 5–10 minutes for correlated events to accumulate before proceeding to the JOIN section.
JOIN for cross-log-group correlation
Problem: “I need to see data from two log groups together. Right now, I run two separate queries and manually compare the results.”
With JOIN, you can correlate events across log groups in a single query. The primary query runs against one log group. The JOIN pulls matching events from a second log group based on a shared field, such as an IP address, user ID, or request ID.
Creating a JOIN query
This shows both what API calls were made and what application resources were accessed from a given IP, in one result set. In Log Analytics, run the following query which uses /demo/security/api-activity as the log group. Replace 123456789012 with your AWS account number:
Parameters
| Parameter | Description | Default value |
|---|---|---|
suspiciousIP |
IP address to investigate across log sources | 198.51.100.42 |
Save this query as a reusable definition using the put-query-definition CLI command.
Figure 6 shows the JOIN results in the console. Each row displays the API call alongside the corresponding application access event from the same IP.
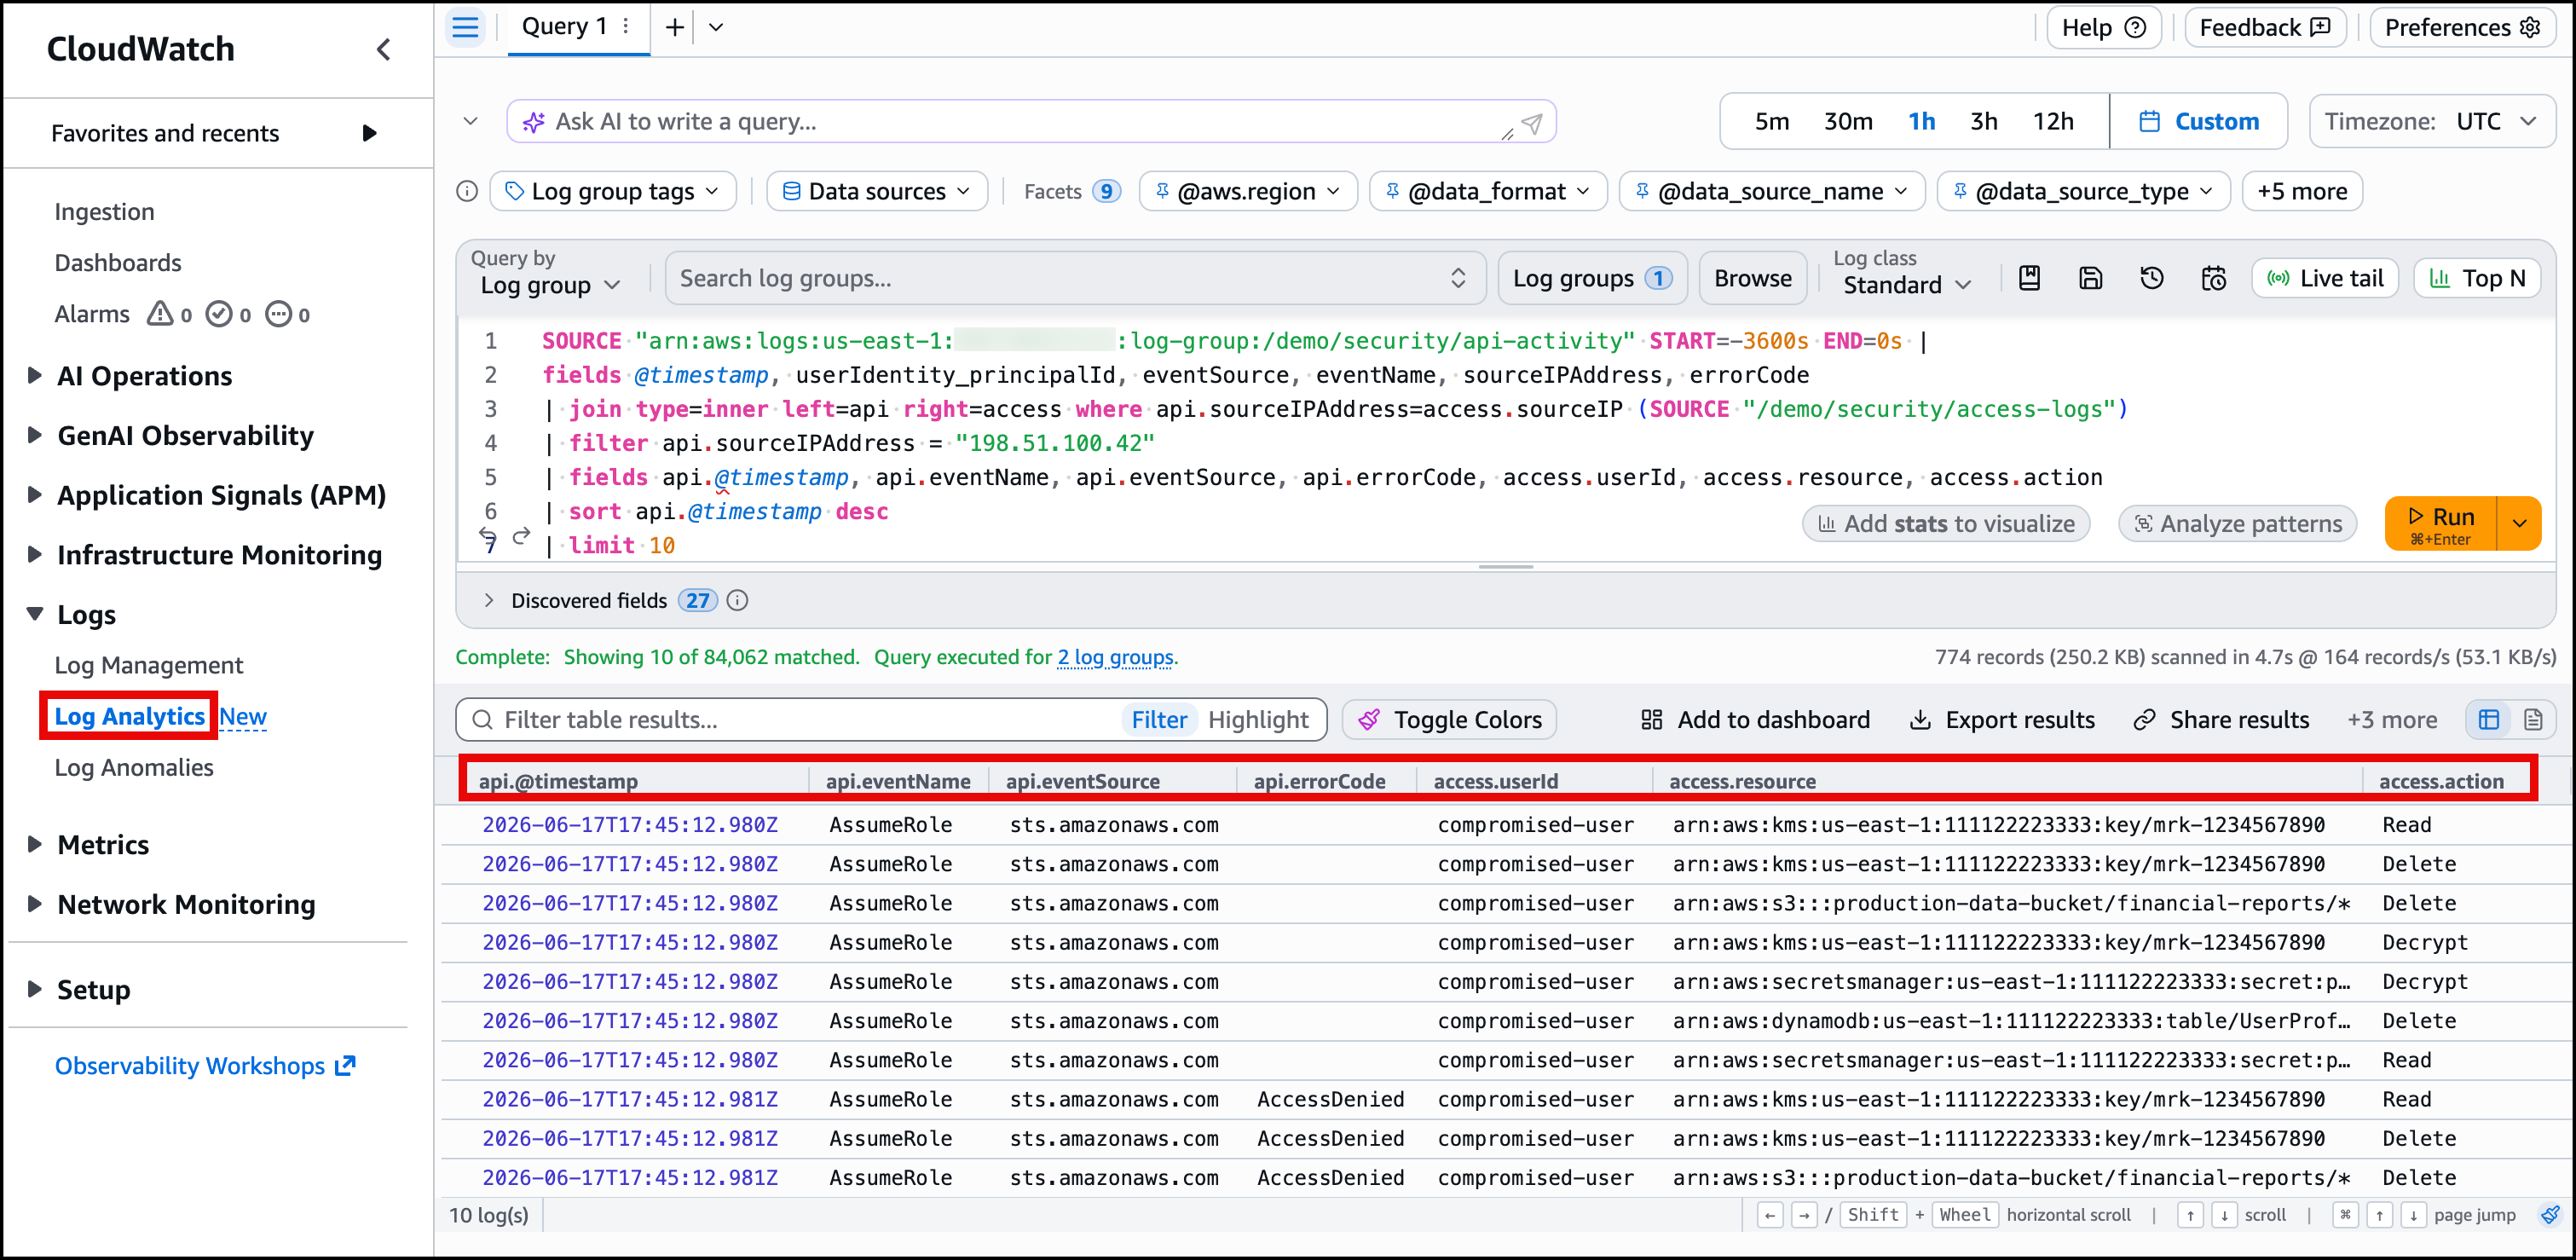
Figure 6: JOIN results showing API calls and resource access correlated by source IP
Sub-queries for multi-step analysis
Problem: “I want to find entities that match a condition in one log group, then look up their activity in another. This takes two queries today.”
With sub-queries, the output of one query feeds into the filter of another. The inner query identifies a set of values (like principal IDs or service names), and the outer query uses those values to retrieve related data.
Creating a sub-query
In this example, the sub-query finds principals with repeated access denied errors, then retrieves all their successful actions. In Log Analytics, run the following query which uses /demo/security/api-activity as the log group. Replace 123456789012 with your AWS account number:
Parameters
| Parameter | Description | Default value |
|---|---|---|
deniedThreshold |
Minimum denied actions to flag a principal | 3 |
Save this query as a reusable definition using the put-query-definition CLI command.
Figure 7 shows the sub-query results. The inner query identified principals with repeated denied actions, and the outer query shows their successful API calls.
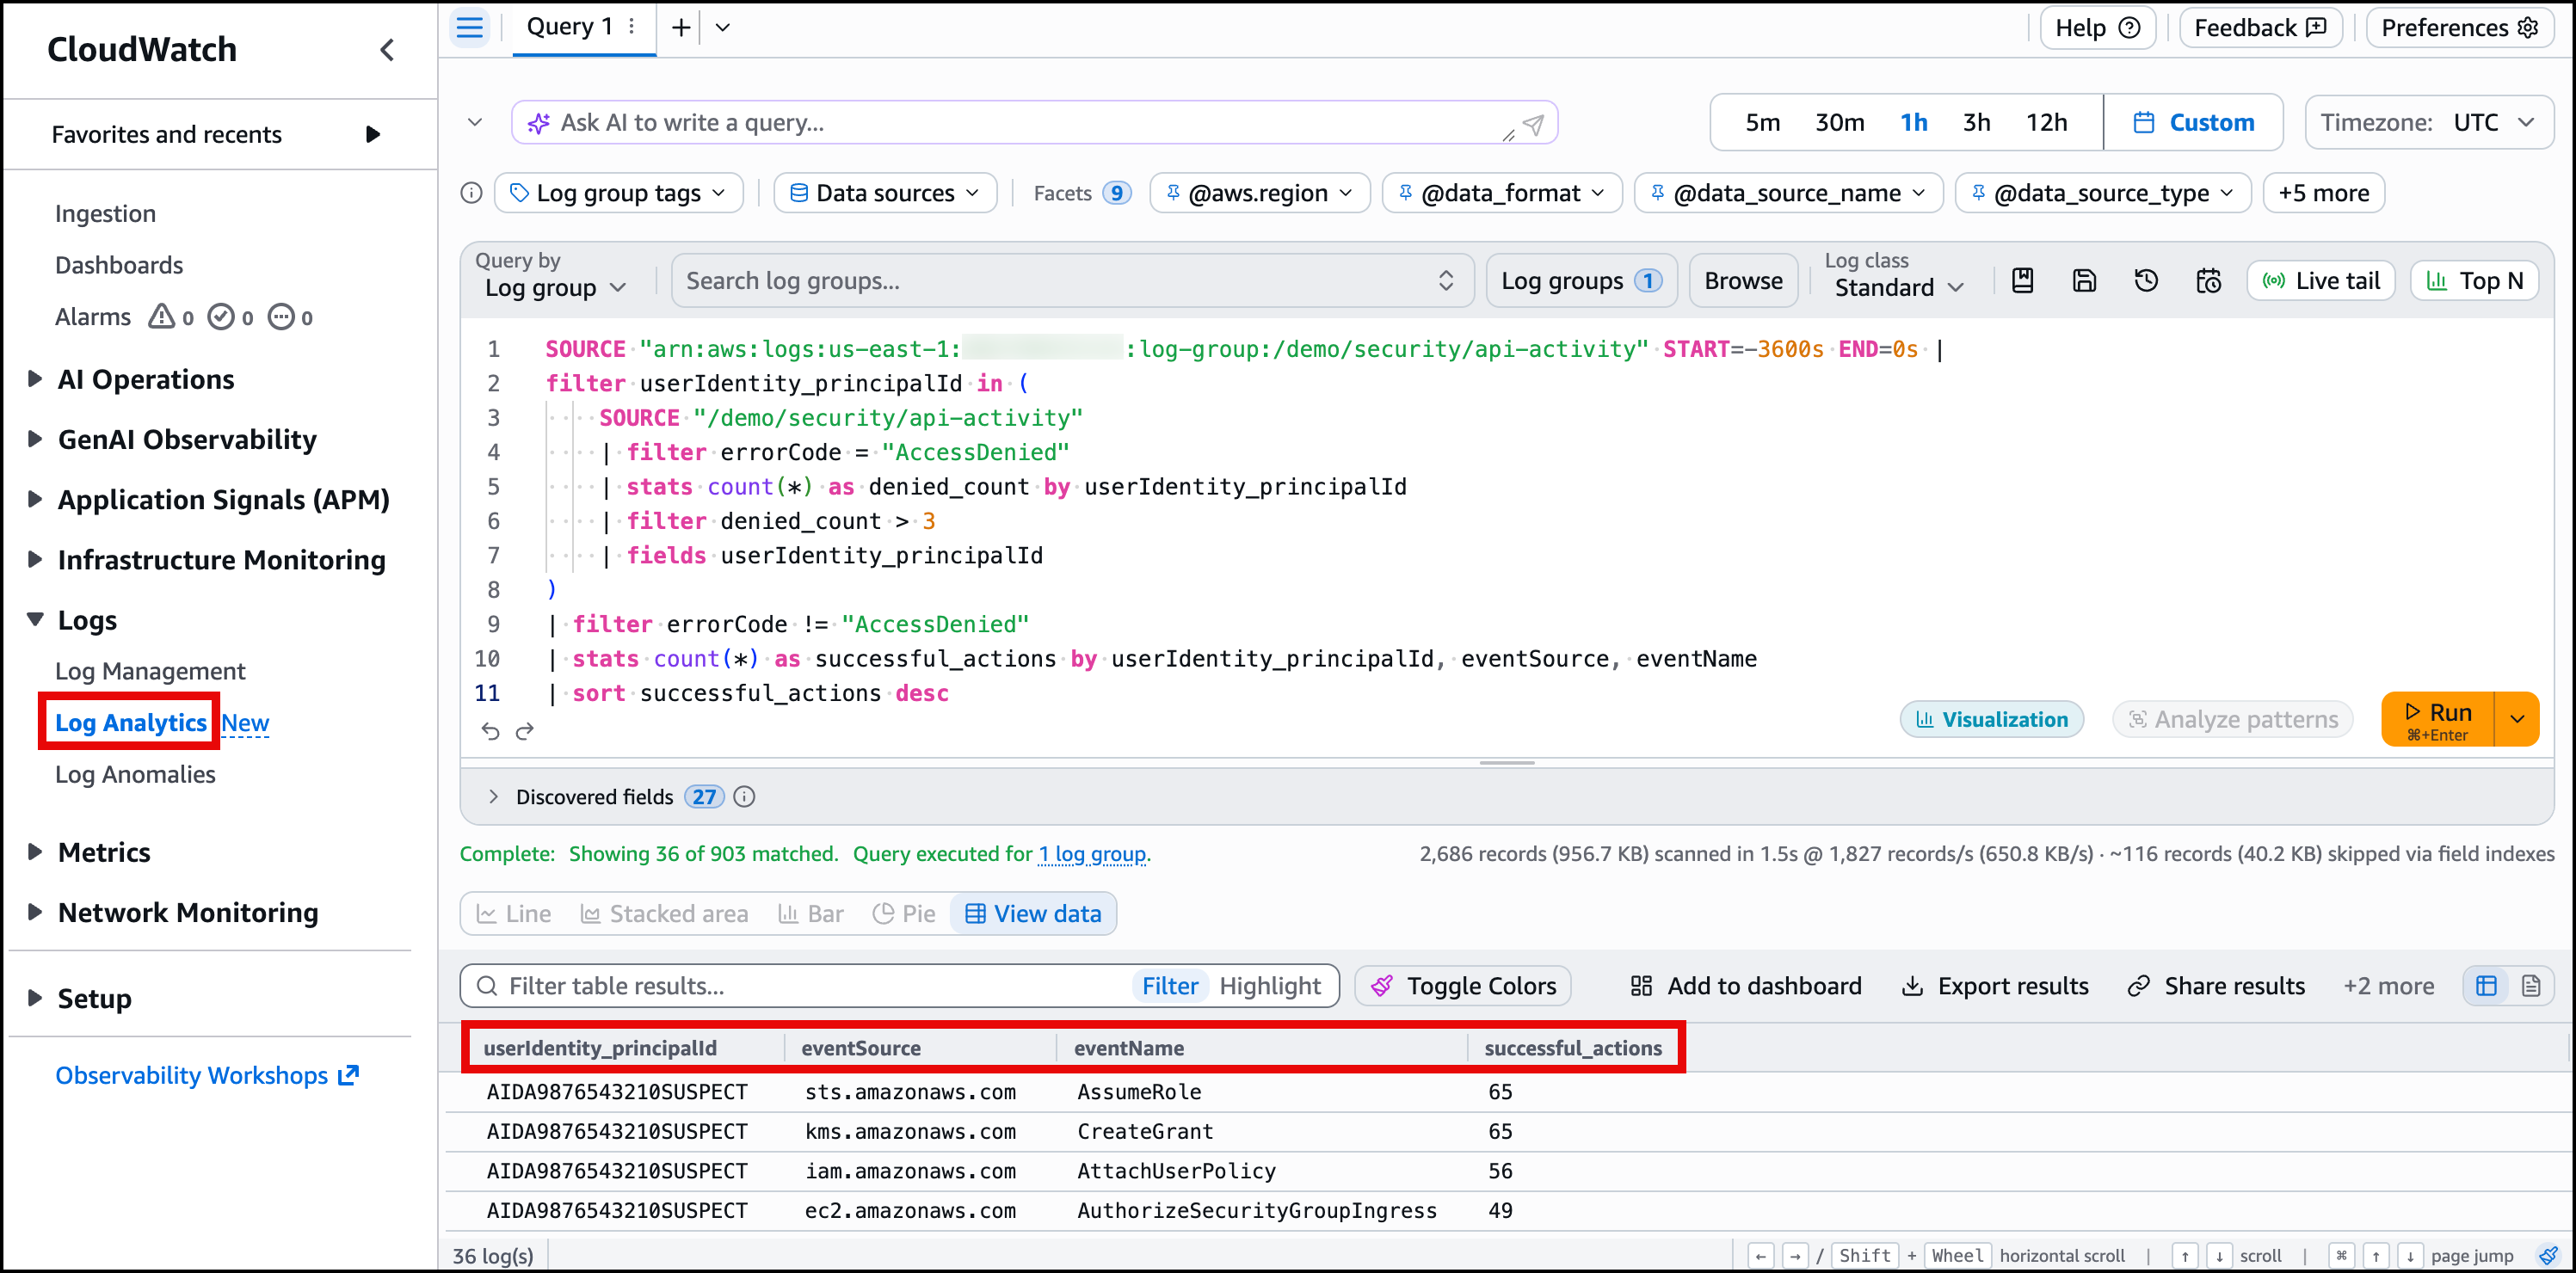
Figure 7: Sub-query results showing successful actions by principals who had repeated access denied errors
Scheduled queries for automated analysis
Problem: “I want this query to run automatically on a schedule and alert me if it finds something. I should not have to open the console to check.”
With scheduled queries, you run Log Analytics queries on a recurring cadence and deliver results to Amazon S3, Amazon EventBridge, or both. Scheduled queries support CloudWatch Logs Insights QL, OpenSearch PPL, and OpenSearch SQL.
Creating a scheduled query
In this example, a scheduled query runs every 5 minutes and flags principals with repeated access denied errors. When it finds results, they land in Amazon S3. You can then configure an Amazon S3 event notification or use Amazon EventBridge to trigger downstream alerting.
The CDK stack does not create scheduled queries. Before creating one, retrieve the stack outputs you need for the CLI command. Run the following command:
From the output, note the values for ScheduledQueryRoleArn (the execution-role ARN) and ResultsBucketName (the S3 path). Use these values to replace the corresponding placeholders in the following CLI command:
To verify, open the CloudWatch console and navigate to Logs, then Log Analytics. Select the “Scheduled Queries” icon, and in the pop-up window you will see ProactiveAccessDeniedDetection. Select it to view the scheduled details, as shown in Figure 8.
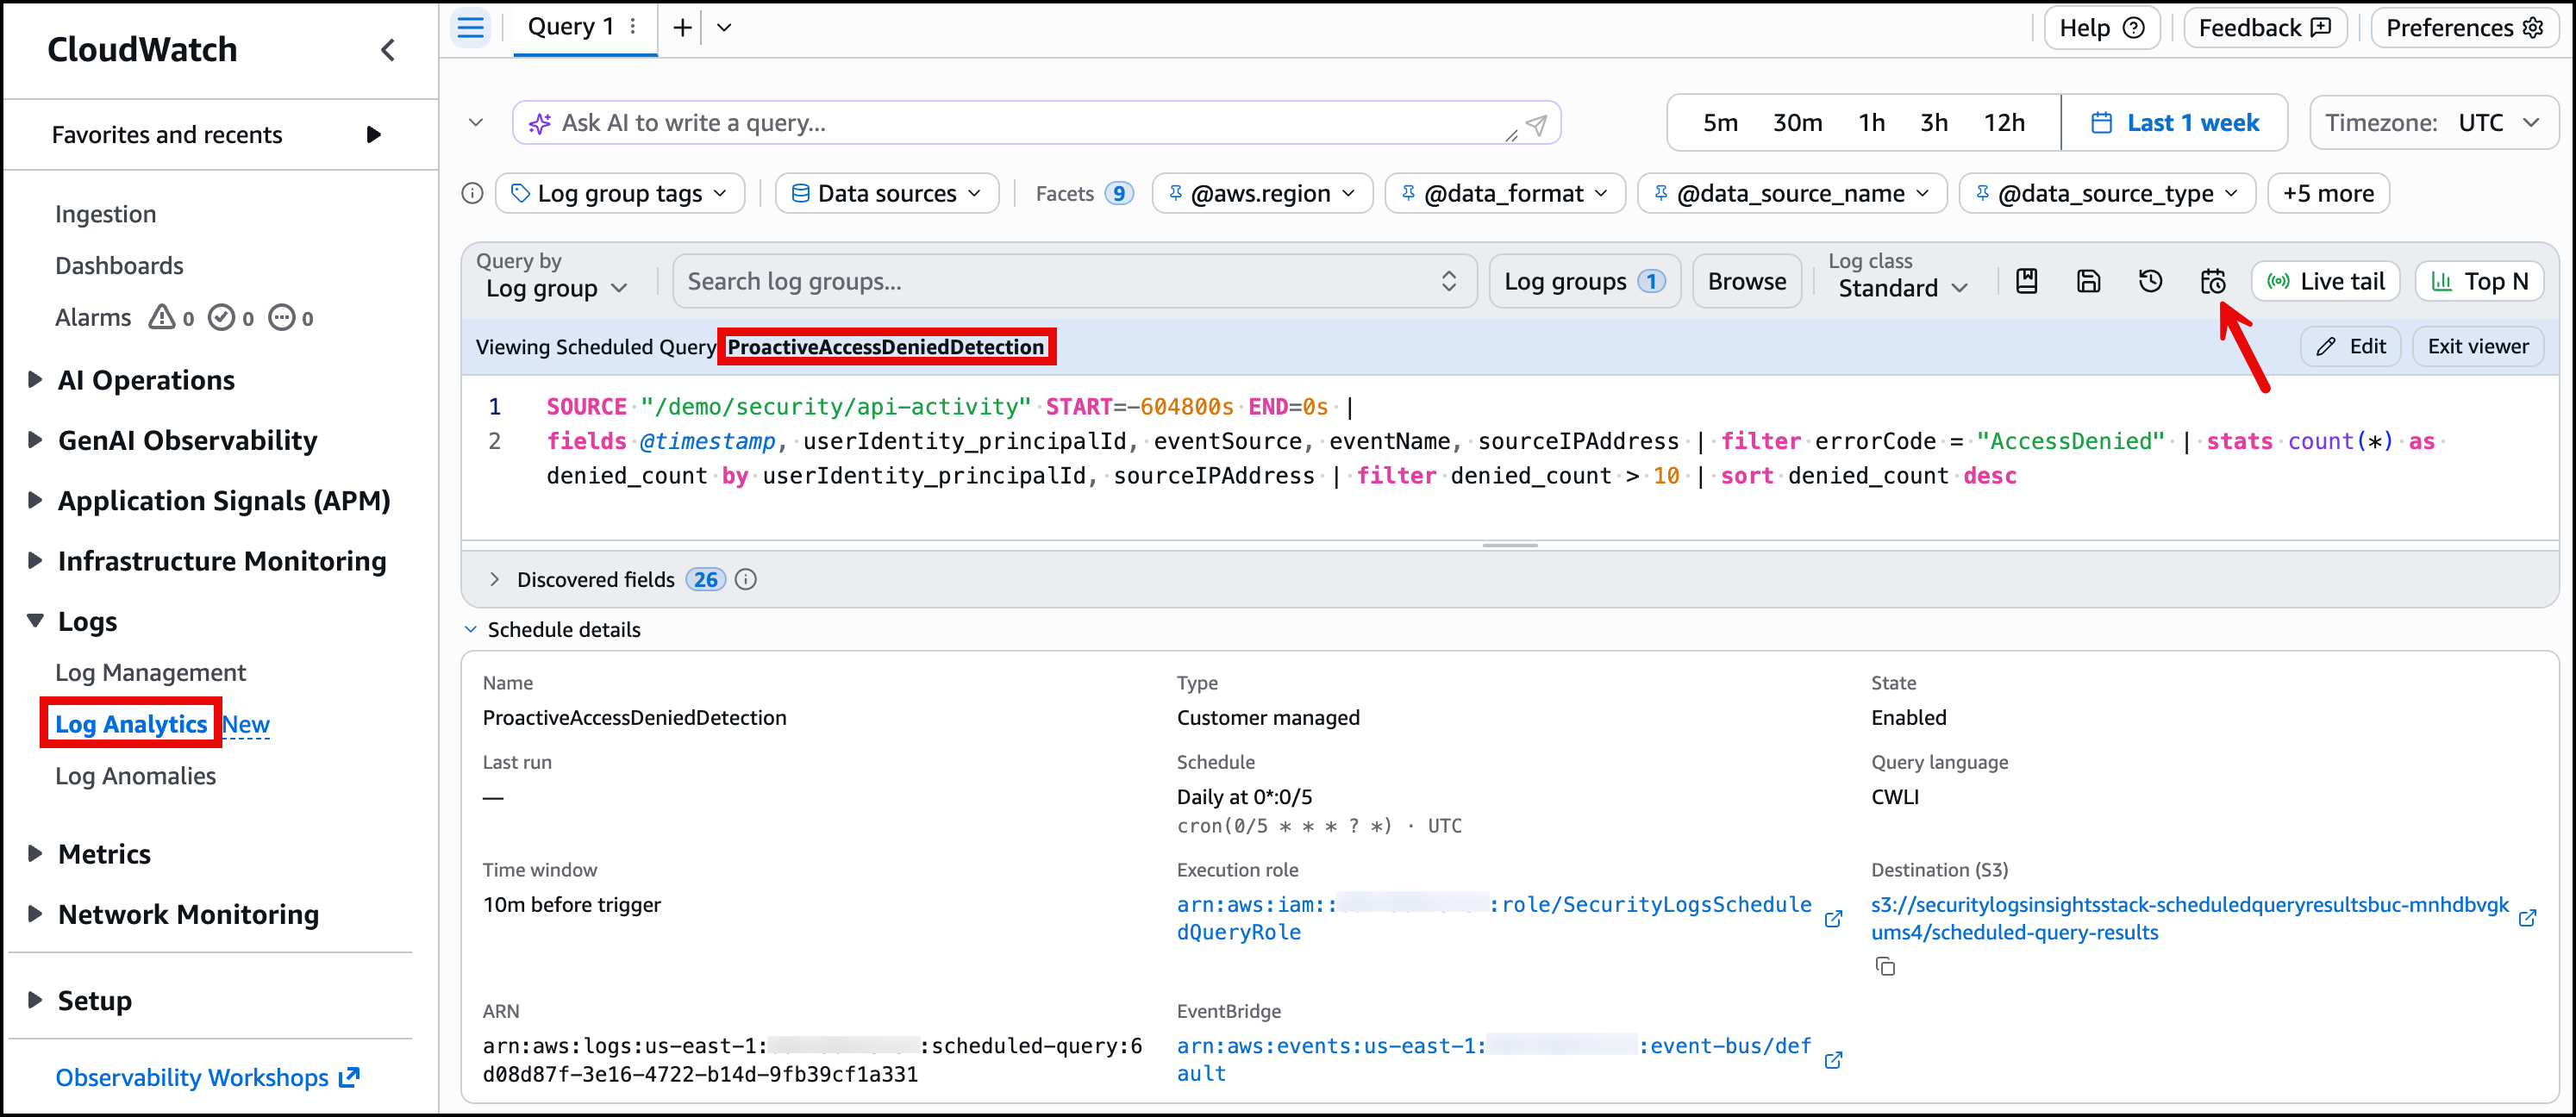
Figure 8: Scheduled query configuration in the CloudWatch console
The execution role needs logs:StartQuery, logs:GetQueryResults, and s3:PutObject permissions. The schedule expression uses cron syntax, cron(0/5 * * * ? *) runs every 5 minutes.
Weekly summary to Amazon S3
Optionally, you can also set up a weekly summary report that groups access denied events by principal and account and delivers the results to Amazon S3. This scheduled query is not created by the CDK stack. Run the following command, using the same stack output values you retrieved earlier for <ScheduledQueryRoleArn>, and <ResultsBucketName>:
This runs every Monday at 08:00 UTC and scans the previous 7 days (604,800 seconds).
Putting it together
Figure 9 shows how the features are composed. This is not a prescribed methodology. It is a demonstration of how facets, parameterized queries, lookup, JOIN and sub-queries, and scheduled queries work together in a single workflow.
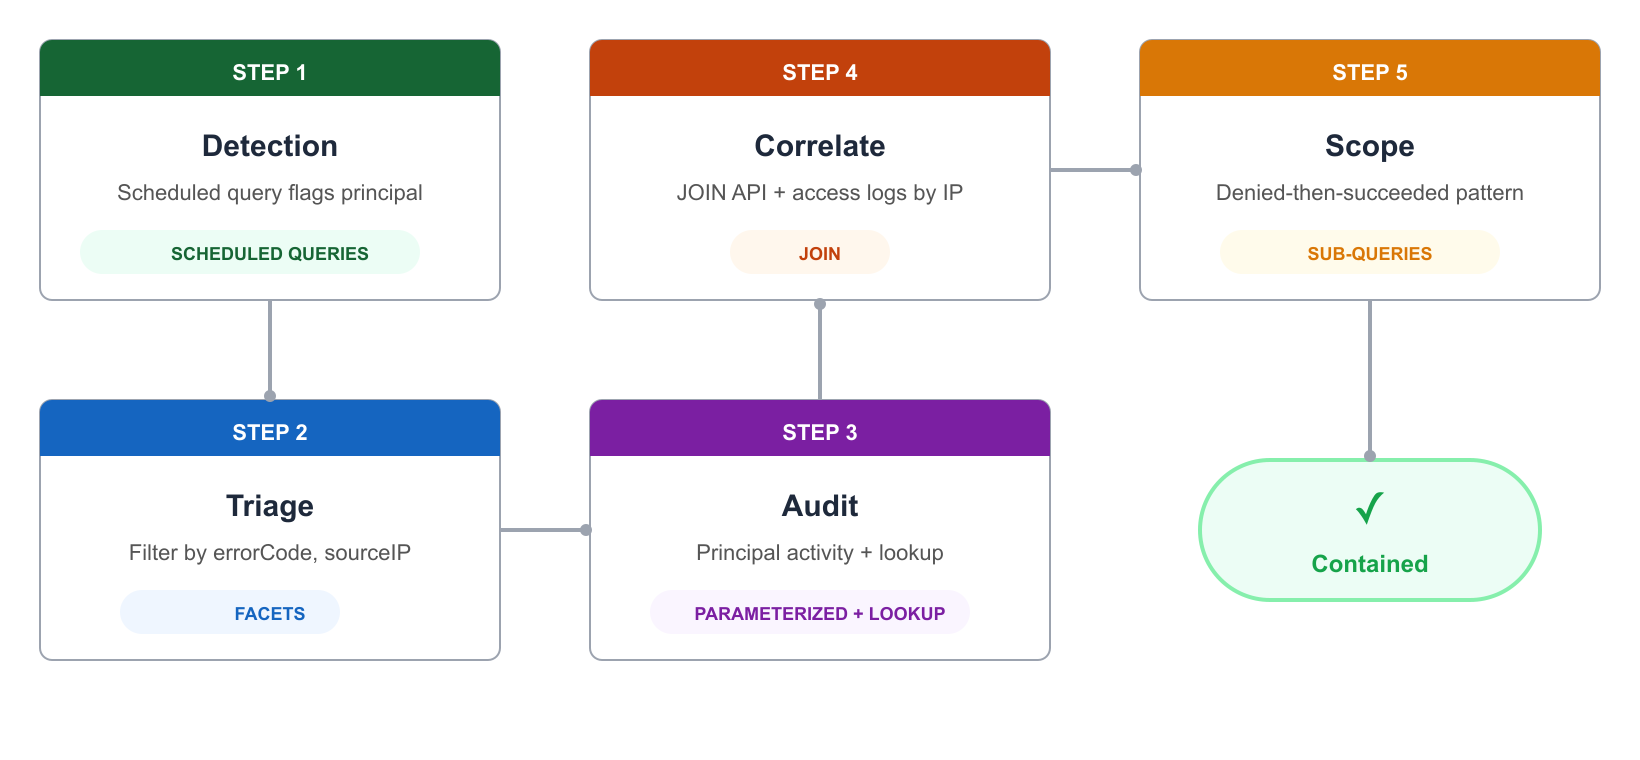
Figure 9: Example workflow showing features used in combination
Scenario: A scheduled query flags a principal with repeated access denied errors from an unfamiliar IP. An engineer investigates.
- Scheduled query (detection). The scheduled query
ProactiveAccessDeniedDetectionruns its 5-minute cycle and flags principalAIDA9876543210SUSPECTwith access denied errors from IP198.51.100.42. The results land in Amazon S3 and an EventBridge event notifies the team. - Facets (triage). The engineer opens CloudWatch Log Analytics and chooses the
/demo/security/api-activitylog group. TheerrorCodefacet in the right panel shows elevatedAccessDeniedevents. They choose the value to filter the results and identify which IPs and principals are involved. - Parameterized query + lookup (audit). The engineer opens the Saved and sample queries panel, navigates to the Security folder, and chooses
PrincipalActivityAudit. The query loads with theprincipalIdparameter pre-filled. They change it to the flagged principal and run the query. The results show all API calls by that principal, enriched with account name and environment from the lookup table. - JOIN (correlate). The engineer chooses
CrossSourceCorrelationfrom the same Saved and sample queries panel. The query loads with thesuspiciousIPparameter (the IP address to investigate across both log groups). They set it to the flagged IP and run the query. The results correlate API activity with application access logs from the same IP in a single view. - Sub-query (scope). The engineer chooses
DeniedThenSucceededfrom the Saved and sample queries panel. The query loads with thedeniedThresholdparameter (the minimum number of denied actions to flag a principal). They set it to 3 and run the query. The results show what the flagged principal successfully accomplished after their denied attempts.
Each step builds on the previous one. In this example, the engineer did not write any queries from scratch. They used saved templates, adjusted parameters, and got enriched, correlated results.
Cost considerations
CloudWatch Log Analytics charges you based on the amount of data each query scans. For current pricing, see Amazon CloudWatch pricing.
Optimization tips
- Place filter commands as early as possible in your query to reduce the amount of data scanned. For JOIN queries, place the filter after the JOIN using the aliased field name (for example, filter api.sourceIPAddress =
"value"). - JOIN scans both the primary log group and the SOURCE log group. Use specific field selections in the initial fields command to limit what gets processed.
- Lookup table data does not count toward scanned data charges.
- Use stats to aggregate before joining rather than joining raw events.
- For scheduled queries, set start-time-offset to the minimum window that provides reliable detection.
- Field indexes can speed up queries and can reduce costs by skipping log events that do not match the indexed field. Index only fields you will actively use as facets or filter on frequently. For more information, see Create field indexes to improve query performance and reduce costs.
- Parameterized templates encourage targeted, filtered queries instead of broad exploratory scans, reducing total scan costs over time.
Cleaning up
To avoid ongoing charges from the resources created in this walkthrough, remove the following. The companion CDK stack generates continuous log data, which incurs CloudWatch Logs ingestion and storage charges for as long as it remains deployed.
- If you deployed the example environment using the CDK companion stack, run
npx cdk destroyto remove the stack resources (log groups, Lambda functions, index policies, sample data generators, and thePrincipalActivityAuditquery definition). This action is irreversible and deletes all log data in the stack-created log groups.
Delete the following resources that you created manually during the walkthrough.
- Lookup tables. Remove the
account_metadatalookup table through the CloudWatch console. For instructions, see Creating and managing lookup tables. - Scheduled queries. Delete
ProactiveAccessDeniedDetectionandWeeklyAccessDeniedReport. To find the query IDs, run the following command, then delete each with the scheduled query ID. For more information, see Automating log analysis with scheduled queries.aws logs describe-scheduled-queriesaws logs delete-scheduled-query --scheduled-query-id <query-id>
- Query definitions. Delete the
Security/CrossSourceCorrelationandSecurity/DeniedThenSucceededquery definitions that were created manually during the walkthrough. To find the query definition IDs, run:aws logs describe-query-definitions --query-definition-name-prefix "Security/"- Then delete it using:
aws logs delete-query-definition --query-definition-id <query-definition-id>
Conclusion
This post walked through each new CloudWatch Log Analytics capability with working examples, showing the customer problem each one solves.
- Facets let engineers explore log patterns visually without writing queries.
- Lookup tables enrich results with an organizational context that lives outside your logs.
- Parameterized queries turn ad-hoc queries into reusable, shareable templates.
- JOIN and sub-queries correlate data across log groups and chain multi-step analysis together without manual copy-paste between queries.
- Scheduled queries automate recurring analysis and deliver results without anyone opening the console.
These capabilities support Stage 3 (Advanced Observability) of the AWS Observability Maturity Model, where teams correlate signals across sources and detect anomalies with contextual enrichment. They complement CloudWatch Metrics and Alarms (for known thresholds), distributed tracing with AWS X-Ray (for cross-service request correlation), and Amazon GuardDuty (for automated threat detection).
To get started, create an index policy on one of your log groups and explore the facets that appear. From there, save your first parameterized query and share it with your team. For more information, see the following resources.
Additional resources
- AWS Observability Maturity Model
- Amazon CloudWatch Logs Insights query syntax
- Save and re-run Logs Insights queries
- CloudWatch Logs lookup tables
- CloudWatch Logs Insights JOIN command
- CloudWatch Logs Insights sub-queries
- CloudWatch Logs scheduled queries
- CloudWatch Logs facets
- Amazon CloudWatch pricing