AWS Cloud Operations Blog
Profile your Amazon CloudWatch Logs estate with an AWS DevOps Agent skill in sandbox, no infrastructure to deploy
A zero-infrastructure AWS DevOps Agent skill profiles your Amazon CloudWatch Logs estate and gives you one view of it. CloudWatch Logs already captures the signals you need to operate it well, including how each log group is classed, how long it is kept, who reads it, where its data flows, and how fast it grows. As your estate grows to hundreds of log groups across many accounts and teams, the value is seeing those signals together, as one view of what you have and how each group is used.
This post shows you how to build that view with AWS DevOps Agent. You build a skill that the agent runs as code in Sandbox during an investigation. The agent profiles every log group in one pass and interprets the result against the rest of your operations. You receive an answer and a set of options, and you keep no infrastructure running between checks.
Most of this post is about the thinking behind that view not the exact steps. It covers why a consolidated, interpreted picture of a log estate is worth having, and why an agent that runs code on demand is a good way to produce it. The walkthrough shows it in practice. CloudWatch already exposes every signal the analysis needs, and the work is bringing those signals together and reading them in context, which is a general operations practice rather than anything particular to CloudWatch.
Treat your log estate as one system
A log estate is a system that continuously describes itself. Each log group advertises how it is classed, how long it is kept, whether anything queries or subscribes to it, where its data flows, and how fast it is growing. CloudWatch surfaces all of this through its APIs. The signals are not hidden and the controls are not obscure. CloudWatch documents each one and returns it on demand.
What changes with scale is not difficulty but dispersion. At ten log groups you hold the whole picture in your head. At several hundred, across accounts and teams, the same signals are spread across separate calls, one for the inventory and others for metric filters, subscription filters, query history, and ingestion metrics, and no single view joins them per group. The gap is correlation, not capability. The operator’s job is to assemble one coherent picture and then read it against what they know about the workload, so each log group can be judged on how it is actually used.
That reading is the main idea, and it rests on two points. First, the log group is the level you work at. Most decisions you make are made per log group, such as changing log class, adjusting retention, filtering a subscription, or scoping a vended source. A summary across groups hides the level at which you actually act. Second, findings are options, not verdicts. A group with no reader in the last month is not necessarily waste; it can be forensic readiness or a compliance record you are required to keep. The analysis earns trust by presenting context and letting the operator decide, rather than by issuing mandates.
Framed this way, the task is a profiling problem. You gather the signals CloudWatch Logs already exposes, join them per log group, and interpret the result. That is computation over your own operational data, run occasionally and read in context, which is the shape of work the next section’s tools are built for.
Why AWS DevOps Agent
You could assemble this picture by hand, or write a one-off program and run it on a schedule you own. For a single check that may be all you need. It is harder to justify once you want the same analysis to be repeatable, safe by default, and available to your whole team. Running it through AWS DevOps Agent adds four things a standalone program does not.
- It needs no standing infrastructure to build, secure, or patch.
- It runs through Sandbox, which limits calls to read-only operations through a proxy, so the analysis does not change your resources.
- It interprets the result against your wider operational context instead of just printing it.
- It becomes a reusable capability that anyone on your team can trigger in plain language or on a schedule, inside the agent your team already uses to investigate production.
Tools that search inside log content, or that analyze spend from billing data, answer different questions. This approach addresses how each log group is used.
Sandbox, rather than a standing AWS Lambda pipeline, is the execution model that fits this work. An AWS Lambda pipeline that produces the same profile is infrastructure you own and operate. That pipeline has several parts you build and operate whether or not anyone reads the output that week.
- A function and its execution role to patch and secure.
- A schedule to maintain.
- A place to persist and read back the intermediate datasets as each phase hands off to the next.
- A dead-letter and alarm story for the runs that fail.
Sandbox inverts that. The environment exists only for the length of an investigation. The read-only proxy is enforced for you rather than being an IAM boundary you write and audit, and the intermediate data stays in memory for the single run that needs it. You trade a permanent, owned pipeline for an ephemeral one the agent stands up on demand. The agent reads the result in the context of the investigation instead of writing it to a bucket for someone to find later. The next section covers the two capabilities that make it work, skills and Sandbox.
Skills and Sandbox
Two AWS DevOps Agent capabilities make this solution work: skills and Sandbox.
A skill is a reusable capability you give the agent. In its simplest form, it is a set of written instructions that tells the agent how to perform a task. The agent loads a skill when a request matches its description. You encode an operational procedure once, and the agent applies it the same way every time. Skills are portable, so you can share them across a team and build a library of the procedures your organization relies on.
Sandbox extends what a skill can do. When you turn it on, the agent gets a fresh, isolated Linux environment for the length of an investigation, with read-only access to the accounts in your Agent Space. In that environment, the agent runs real code, not reasoning alone. A proxy limits every call to read-only operations, and the environment ends with the investigation, so it leaves no standing resources to manage. With Sandbox, a skill can carry executable code that the agent runs to gather and correlate data. For details on Sandbox isolation and security, see the Sandbox documentation.
Together they change the kind of problem the agent can handle. Reasoning alone answers many questions. Others need computation, such as reading a large volume of data, aggregating across hundreds of resources, or joining several sources into one view. For those, you package the procedure as a skill, the agent runs it in Sandbox, and the agent interprets the result against everything else it knows about your environment. The work is reusable, it runs safely, and it leaves no infrastructure behind. Profiling a large log estate is one example of this pattern, and it is what you build next.
Overview of the solution
For this solution, the skill bundles a script named analyzer.py. The script names the CloudWatch Logs and Amazon CloudWatch APIs to call, classifies each log group, and turns raw volume into an operational profile. The SKILL.md file tells the agent to run that script. The agent runs analyzer.py in Sandbox and returns one report.
The report is built around five questions. Each maps to a decision an operator makes about a log group, which is why the profile leads with how a group is used and treats cost as a consequence rather than the headline.
- What do you have? Each log group, with its log class, retention, and log type. Custom logs come from your applications, and vended logs come from AWS services such as VPC flow logs and WAF at volume-tiered rates. The script sorts groups into these types with a configurable name pattern, because CloudWatch prices a log by its delivery source rather than its name, so adjust the patterns to match how your vended-log groups are named. AWS Lambda logs bill as vended logs at those volume-tiered rates, following their reclassification from flat-rate pricing in May 2025.
- Who reads each group? Groups with a query, a metric filter, or a subscription filter, next to groups that show no configured consumer.
- Where does the data go? Subscription filter destinations such as Amazon Data Firehose, Amazon OpenSearch Service, and AWS Lambda.
- Does each group fit its use? Log class and retention set against the access pattern. A Standard-class group that uses no metric filter or subscription filter is a candidate for the lower-cost Infrequent Access class, once you confirm it needs no other Standard-only feature such as Live Tail or field indexing.
- What is changing? The groups that grow the fastest, with a simple projection.
Cost sits inside this profile as one more dimension. The same volume and class data that shows whether a group fits its use also shows what it costs.
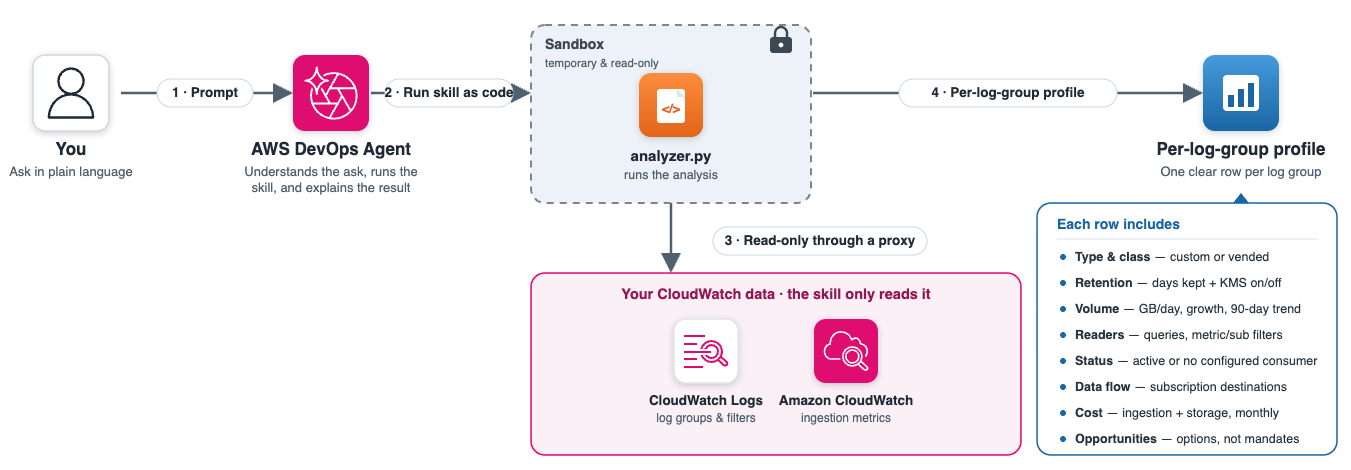
Figure 1: Architecture Diagram
Prerequisites
For this walkthrough, you should have the following:
- An AWS account with access to AWS DevOps Agent.
- A Region that supports Sandbox during preview: US East (N. Virginia), US West (Oregon), Asia Pacific (Tokyo), or Europe (Ireland).
- An AWS Identity and Access Management (IAM) role for the Agent Space with read access to CloudWatch Logs and CloudWatch. The analyzer calls logs:DescribeLogGroups, logs:DescribeMetricFilters, logs:DescribeSubscriptionFilters, logs:DescribeQueries, logs:GetDataProtectionPolicy, and cloudwatch:GetMetricData.
- Working knowledge of CloudWatch Logs concepts such as log classes, retention, and subscription filters.
Step 1: Create an Agent Space
An Agent Space defines what AWS DevOps Agent can access.
- Sign in to the AWS Management Console and open the AWS DevOps Agent console.
- Choose Create Agent Space.
- For Agent Space name, enter a name such as logs-analyzer.
- For AWS resource access, select Auto-create a new AWS DevOps Agent role, or choose a custom IAM role that grants the read permissions listed in the prerequisites.
- For the Web App, select Auto-create a new AWS DevOps Agent role.
- Choose Create.
After the console creates the Agent Space, confirm on the Capabilities tab that your AWS account is connected with the read permissions from the prerequisites. The sandbox uses this account connection to make the read-only calls the analyzer needs.
Step 2: Turn on Sandbox
Sandbox is what lets the skill run code. It is off by default.
- In the AWS DevOps Agent console, select your Agent Space.
- Choose the Capabilities tab.
- In the Sandbox section, choose Configure.
- Leave the networking allowlist empty. The analyzer reaches only AWS service endpoints, which an empty allowlist already permits.
- In the pip packages list, add boto3. The field accepts a package name only, so you cannot pin a version here during preview. The bundled script imports boto3, and pre-installing it means the sandbox does not fetch it at run time.
- Choose Save.
You should see the Sandbox section report one pip package and zero allowlist entries.
Step 3: Build the skill
The skill is a directory with two files, a SKILL.md file and an analyzer.py script. The SKILL.md frontmatter tells the agent when to use the skill, and its body tells the agent to run the script.
cloudwatch-logs-analyzer/├── SKILL.md # when to use the skill and how to run the script└── analyzer.py # the analysis the agent runs in the sandbox
Create SKILL.md with the following content.
---
name: cloudwatch-logs-analyzer
description: Profiles every Amazon CloudWatch log group in an account and
  reports class, retention, volume, growth, consumption, subscription
  destinations, and estimated cost. Use this skill when a user asks to analyze
  CloudWatch Logs at scale, review log group inventory, find the largest or
  fastest growing log groups, find log groups with no configured consumer, map where log
  data flows through subscription filters, decide between Standard and
  Infrequent Access, review retention, understand ingestion by group, or
  estimate and break down CloudWatch Logs cost, including questions like which
  log groups cost the most or where to find logging optimization opportunities.
---

# CloudWatch Logs analyzer

Use this skill when a user asks to profile CloudWatch log groups.

## How to run

Run the bundled script in the sandbox:

    python3 analyzer.py

By default it analyzes us-east-1. To analyze a different Region, set the
AWS_REGION environment variable, for example:

    AWS_REGION=us-west-2 python3 analyzer.py

To cover more than one Region, the agent runs the script once per Region within
the same investigation, setting AWS_REGION each time, and combines the results.
The script calls read APIs only and prints a JSON document with a summary and
one row per log group.

## How to present the results

Read the JSON that the script prints. It contains a summary and one row per
log group. Report each group's name, log class, retention, type, daily volume,
growth, 90-day projection, consumption status with query count, subscription
destinations, data protection, and estimated cost broken into ingestion,
storage, and total. Include the summary totals by category, the Region and
lookback window, and the opportunity counts. Group the results by consumer
status and optimization opportunity, and show estimated cost as one column
rather than the primary sort. Present
every finding as an option with context, not a verdict. A group with no
configured consumer may still serve compliance or forensic needs, or be read
in ways this skill does not detect.
The script runs in five short passes. It lists every log group and classifies each as custom, vended, or service. It measures a lookback window of ingestion, 30 days by default, and estimates cost. It checks who consumes each group. It maps subscription destinations and data protection. Finally, it flags optimization opportunities and prints one JSON document with a summary and a row per group. To keep a run fast on an estate with hundreds of groups, it batches the ingestion metric reads into as few GetMetricData calls as the API allows and runs the per-group lookups concurrently with throttle-aware retries. It analyzes one Region, us-east-1 by default, and you set the scope in plain language when you ask the agent, such as a specific Region or every Region in the account. The window, rate, and opportunity-threshold constants at the top are general defaults that you change to match your environment. Create analyzer.py with the following content.
#!/usr/bin/env python3
"""CloudWatch Logs analyzer. Read-only. Runs in the AWS DevOps Agent sandbox.
Profiles every log group across the dimensions the five original phases
covered: inventory and classification, volume and cost, consumption,
integrations (subscriptions, data protection, queries), and optimization
opportunities. Prints one JSON document with a summary and per-group rows.

Scale note: GetMetricData is batched (up to 500 metric queries per call) and
the per-group describe calls run concurrently with throttle-aware retries, so
a large estate finishes in fewer API round trips and less run time.
AWS DevOps Agent bills per agent-second, so wall-clock is the real cost lever
at scale, not the API charges. Batching does not change the metered metric
count (one metric per group either way); it only cuts round trips. The
classification, cost math, opportunity logic, and output schema are unchanged
from the per-group version."""
import os
import json
import boto3
from botocore.config import Config
from concurrent.futures import ThreadPoolExecutor
from datetime import datetime, timedelta, timezone

# The sandbox routes AWS calls through a proxy whose CA is in the system
# trust store, while botocore defaults to the certifi bundle. Point botocore
# at the system bundle when one is present so certificate verification passes.
if not os.environ.get("AWS_CA_BUNDLE"):
    for _ca in ("/etc/ssl/certs/ca-certificates.crt",
                "/etc/pki/tls/certs/ca-bundle.crt"):
        if os.path.exists(_ca):
            os.environ["AWS_CA_BUNDLE"] = _ca
            break

# Region to analyze. Defaults to us-east-1. Set AWS_REGION to scope the run to
# another Region. Ask the agent in plain language to change or widen scope.
REGION = os.environ.get("AWS_REGION") or "us-east-1"
# Lookback window in days for ingestion volume and growth.
LOOKBACK_DAYS = 30

# Concurrency for the per-group describe calls. Those are free control-plane
# calls; running them in a bounded pool trades idle wait for wall-clock time.
MAX_WORKERS = 10
# GetMetricData accepts up to 500 metric queries per call. Batching to this
# size cuts round trips without changing the metered metric count.
METRIC_BATCH = 500

# On-demand rates. Confirm current per-Region rates on the CloudWatch pricing
# page and each destination service pricing page before you rely on any cost
# field.
CUSTOM_INGEST_PER_GB = 0.50
STORAGE_PER_GB_MONTH = 0.03
DATA_PROTECTION_PER_GB = 0.12        # per GB scanned, verify current per-Region rate
FIREHOSE_PER_GB = 0.029              # verify current rate
# Standard vended tiers, applied across all vended volume in the account.
VENDED_TIERS = [(10 * 1024, 0.50), (20 * 1024, 0.25),
                (20 * 1024, 0.10), (float("inf"), 0.05)]
# Name-based heuristic for vended logs. CloudWatch prices a log by its delivery
# source, not its log-group name, so adjust this list to match how your
# vended-log groups are named. VPC flow logs and WAF logs use names you choose
# (WAF log groups must start with aws-waf-logs-).
VENDED_PREFIXES = ("/aws/lambda", "/aws/vpc-flow-logs", "/aws/route53",
                   "aws-waf-logs-", "/aws/global-accelerator")

# Opportunity thresholds. General defaults for this post. Adjust them to
# fit your environment.
HIGH_VOLUME_VENDED_GB_DAY = 50
RAPID_GROWTH_RATE = 0.20
RAPID_GROWTH_MIN_GB_DAY = 1

# Adaptive retries make the concurrent describe calls throttle-aware, so a
# wide fan-out backs off instead of failing under API rate limits.
_CFG = Config(retries={"max_attempts": 10, "mode": "adaptive"})
logs = boto3.client("logs", region_name=REGION, config=_CFG)
cw = boto3.client("cloudwatch", region_name=REGION, config=_CFG)


def classify(name):
    low = name.lower()
    if any(low.startswith(p) for p in VENDED_PREFIXES):
        return "vended"
    return "custom"


def list_log_groups():
    groups = []
    for page in logs.get_paginator("describe_log_groups").paginate():
        groups.extend(page["logGroups"])
    return groups


def metric_filters(name):
    return logs.describe_metric_filters(logGroupName=name, limit=1)["metricFilters"]


def subscription_filters(name):
    return logs.describe_subscription_filters(logGroupName=name)["subscriptionFilters"]


def has_data_protection(name):
    # get_data_protection_policy returns a 200 with an empty policyDocument
    # for groups that have no policy, so check that the document is present
    # rather than treating any successful response as a policy.
    try:
        resp = logs.get_data_protection_policy(logGroupIdentifier=name)
        return bool(resp.get("policyDocument"))
    except logs.exceptions.ResourceNotFoundException:
        return False
    except Exception:
        return False


def group_meta(name):
    # One worker's unit of work: the three per-group describe calls, returned
    # together so the thread pool can fan them out across every log group.
    return (name, metric_filters(name), subscription_filters(name),
            has_data_protection(name))


def fetch_daily_ingest(names, start, end):
    # Batch IncomingBytes for every group, up to METRIC_BATCH queries per
    # GetMetricData call, following NextToken. One query per group, so the
    # metered metric count (and cost) is identical to the per-group version;
    # only the number of API round trips drops. Datapoint order is left as the
    # API returns it, unchanged from the per-group call.
    daily = {}
    for base in range(0, len(names), METRIC_BATCH):
        chunk = names[base:base + METRIC_BATCH]
        id_map = {"m%d" % i: name for i, name in enumerate(chunk)}
        queries = [{
            "Id": qid,
            "MetricStat": {
                "Metric": {"Namespace": "AWS/Logs",
                           "MetricName": "IncomingBytes",
                           "Dimensions": [{"Name": "LogGroupName",
                                           "Value": name}]},
                "Period": 86400, "Stat": "Sum"}}
            for qid, name in id_map.items()]
        acc = {qid: [] for qid in id_map}
        token = None
        while True:
            kwargs = {"MetricDataQueries": queries,
                      "StartTime": start, "EndTime": end,
                      "ScanBy": "TimestampAscending"}
            if token:
                kwargs["NextToken"] = token
            resp = cw.get_metric_data(**kwargs)
            for res in resp["MetricDataResults"]:
                acc.setdefault(res["Id"], []).extend(res.get("Values", []))
            token = resp.get("NextToken")
            if not token:
                break
        for qid, vals in acc.items():
            daily[id_map[qid]] = [v / (1024 ** 3) for v in vals]
    return daily


def monthly_growth(daily):
    if len(daily) < 14:
        return 0.0
    first = sum(daily[:7]) / 7
    last = sum(daily[-7:]) / 7
    if first == 0:
        return 0.0
    weekly = (last - first) / first
    return round(weekly * (30 / 21), 2)


def query_counts(start):
    # DescribeQueries returns query metadata (including logGroupName for
    # single-group queries), not scanned bytes. Per-query scanned volume is
    # only available from GetQueryResults, so this counts queries per group
    # rather than estimating query cost from DescribeQueries.
    counts = {}
    for page in logs.get_paginator("describe_queries").paginate(status="Complete"):
        for query in page["queries"]:
            when = datetime.fromtimestamp(query.get("createTime", 0) / 1000,
                                          tz=timezone.utc)
            name = query.get("logGroupName")
            if when >= start and name:
                counts[name] = counts.get(name, 0) + 1
    return counts


def destination_type(arn):
    if ":firehose:" in arn:
        return "Amazon Data Firehose"
    if ":lambda:" in arn:
        return "AWS Lambda"
    if ":es:" in arn or ":opensearch:" in arn:
        return "Amazon OpenSearch Service"
    if ":kinesis:" in arn:
        return "Amazon Kinesis Data Streams"
    return "Other"


def downstream_cost(dest, gb_month):
    if dest == "Amazon Data Firehose":
        return round(gb_month * FIREHOSE_PER_GB, 2)
    # Kinesis Data Streams, OpenSearch, and Lambda vary by shard-hour,
    # instance, or invocation, so this does not estimate their cost.
    return None


def vended_rate(total_gb):
    if total_gb <= 0:
        return VENDED_TIERS[0][1]
    cost, left = 0.0, total_gb
    for tier_gb, rate in VENDED_TIERS:
        take = min(left, tier_gb)
        cost += take * rate
        left -= take
        if left <= 0:
            break
    return cost / total_gb


def opportunities(row):
    out = []
    if row["status"] == "passive":
        out.append("NO_DETECTED_CONSUMERS")
    if (row["log_class"] == "STANDARD" and not row["has_metric_filters"]
            and not row["has_subscription_filters"]):
        out.append("INFREQUENT_ACCESS_CANDIDATE")
    if row["retention_days"] is None and row["stored_gb"] > 0:
        out.append("NO_RETENTION_POLICY")
    if row["category"] == "vended" and row["daily_gb"] > HIGH_VOLUME_VENDED_GB_DAY:
        out.append("HIGH_VOLUME_VENDED")
    if row["growth"] > RAPID_GROWTH_RATE and row["daily_gb"] > RAPID_GROWTH_MIN_GB_DAY:
        out.append("RAPID_GROWTH")
    return out


def main():
    end = datetime.now(timezone.utc)
    start = end - timedelta(days=LOOKBACK_DAYS)
    queries = query_counts(start)

    groups = list_log_groups()
    names = [g["logGroupName"] for g in groups]

    # Batch the one metered call, then fan the free describe calls out across
    # a bounded thread pool. Both keep wall-clock (and agent-seconds) low.
    daily_map = fetch_daily_ingest(names, start, end)
    mf_map, sf_map, dp_map = {}, {}, {}
    with ThreadPoolExecutor(max_workers=MAX_WORKERS) as pool:
        for name, mfilters, sfilters, dprot in pool.map(group_meta, names):
            mf_map[name], sf_map[name], dp_map[name] = mfilters, sfilters, dprot

    rows = []
    total_vended_gb = 0.0

    for group in groups:
        name = group["logGroupName"]
        category = classify(name)
        daily = daily_map.get(name, [])
        gb_window = sum(daily)
        if category == "vended":
            total_vended_gb += gb_window
        mfilters = mf_map.get(name, [])
        sfilters = sf_map.get(name, [])
        qcount = queries.get(name, 0)
        active = bool(mfilters) or bool(sfilters) or qcount > 0
        daily_avg = round(gb_window / LOOKBACK_DAYS, 2)
        growth = monthly_growth(daily)
        subs = []
        for sf in sfilters:
            filtered = bool(sf.get("filterPattern"))
            delivery_gb = gb_window * (0.3 if filtered else 1.0)
            dest = destination_type(sf.get("destinationArn", ""))
            subs.append({
                "destination": dest,
                "filtered": filtered,
                "est_delivery_gb_month": round(delivery_gb, 2),
                "est_downstream_cost": downstream_cost(dest, delivery_gb)})
        rows.append({
            "name": name,
            "category": category,
            "log_class": group.get("logGroupClass", "STANDARD"),
            "retention_days": group.get("retentionInDays"),
            "kms_encrypted": bool(group.get("kmsKeyId")),
            "daily_gb": daily_avg,
            "gb_window": round(gb_window, 2),
            "growth": growth,
            "projected_90d_daily_gb": round(daily_avg * (1 + growth * 3), 2),
            "stored_gb": round(group.get("storedBytes", 0) / (1024 ** 3), 2),
            "has_metric_filters": bool(mfilters),
            "has_subscription_filters": bool(sfilters),
            "queries": qcount,
            "status": "active" if active else "passive",
            "data_protection": dp_map.get(name, False),
            "subscriptions": subs,
            "_gb_window": gb_window})

    rate = vended_rate(total_vended_gb)
    for row in rows:
        per_gb = rate if row["category"] == "vended" else CUSTOM_INGEST_PER_GB
        ingestion = row["_gb_window"] * per_gb
        storage = row["stored_gb"] * STORAGE_PER_GB_MONTH
        protection = (row["_gb_window"] * DATA_PROTECTION_PER_GB
                      if row["data_protection"] else 0.0)
        row["ingestion_cost"] = round(ingestion, 2)
        row["storage_cost"] = round(storage, 2)
        row["data_protection_cost"] = round(protection, 2)
        row["est_month_cost"] = round(ingestion + storage + protection, 2)
        row["opportunities"] = opportunities(row)
        del row["_gb_window"]

    # Usage first: lead with groups that have no configured consumer, then
    # groups with optimization opportunities, then by estimated cost.
    rows.sort(key=lambda r: (r["status"] == "active",
                             not r["opportunities"],
                             -r["est_month_cost"]))

    by_category = {}
    for row in rows:
        by_category[row["category"]] = round(
            by_category.get(row["category"], 0.0) + row["est_month_cost"], 2)
    opp_counts = {}
    for row in rows:
        for opp in row["opportunities"]:
            opp_counts[opp] = opp_counts.get(opp, 0) + 1
    summary = {
        "region": REGION,
        "lookback_days": LOOKBACK_DAYS,
        "log_groups": len(rows),
        "vended_effective_rate_per_gb": round(rate, 4),
        "est_total_month_cost": round(sum(r["est_month_cost"] for r in rows), 2),
        "cost_by_category": by_category,
        "active": sum(1 for r in rows if r["status"] == "active"),
        "passive": sum(1 for r in rows if r["status"] == "passive"),
        "opportunity_counts": opp_counts}

    print(json.dumps({"summary": summary, "groups": rows},
                     indent=2, default=str))


if __name__ == "__main__":
    main()
Step 4: Upload the skill
Compress the skill directory into a .zip file no larger than 6 MB. Keep analyzer.py at the skill root, because the uploader rejects a scripts/ directory during preview.
- In the Agent Space, open the Knowledge page and choose the Skills tab.
- Choose Add skill, then choose Upload skill.
- Drag your .zip file into the upload area, keep the Generic agent type selected, and choose Upload.
- Open the skill and confirm its file tree shows both SKILL.md and analyzer.py, and that the status is Active.
Step 5: Run the analysis with AWS DevOps Agent
AWS DevOps Agent activates a skill when your request matches its description, so you do not need one exact prompt. Prompts like these match the skill’s description:
- Profile every CloudWatch log group in this account.
- Which log groups are the largest and fastest growing?
- Which log groups have no readers?
- Map my subscription filter destinations for CloudWatch Logs.
- Break down my CloudWatch Logs by class, type, and estimated cost.
To run it:
- In the AWS DevOps Agent web app, open the Incident Response tab.
- Start a manual investigation.
- Enter a prompt such as: Profile every CloudWatch log group in this account. Report each group’s class, retention, type, consumption, subscription destinations, growth, and estimated cost.
- Follow the investigation timeline as the agent loads the skill, runs analyzer.py in Sandbox, and summarizes the JSON output.
Review the operational takeaways, such as the following:
- Standard groups with no Standard-only feature in use, which you can create as Infrequent Access next time.
- Groups with no retention policy, where you confirm that indefinite retention is intentional.
- Vended sources that capture more than you need, such as Amazon Virtual Private Cloud (Amazon VPC) flow logs on every network interface when you only need rejects.
- Subscription filters with no filter pattern, which send everything downstream.
- Fast-growing groups worth a second look.
The investigation view also shows the standard sections AWS DevOps Agent produces for any investigation, including findings and a root-cause section. A profiling run is not an incident, so the root-cause section reports that none were identified. That is expected. The value is the per-log-group profile that the skill returns.
The following table shows common patterns and the lever for each source.
| Source | Common pattern at scale | Operational Lever |
| AWS Lambda | INFO logs at high invocation volume | Set the application log level to WARN with Advanced Logging Controls |
| Amazon EKS | Audit logs for every Kubernetes API call | Keep only the control plane log types you use |
| Amazon VPC flow logs | All traffic on every network interface | Scope to the subnets you need and capture rejects for security |
| AWS WAF | A record for every request evaluation | Log block and count actions, and redact large headers |
| Amazon API Gateway | Full execution logging in production | Prefer access logs and reserve execution logging for debugging |
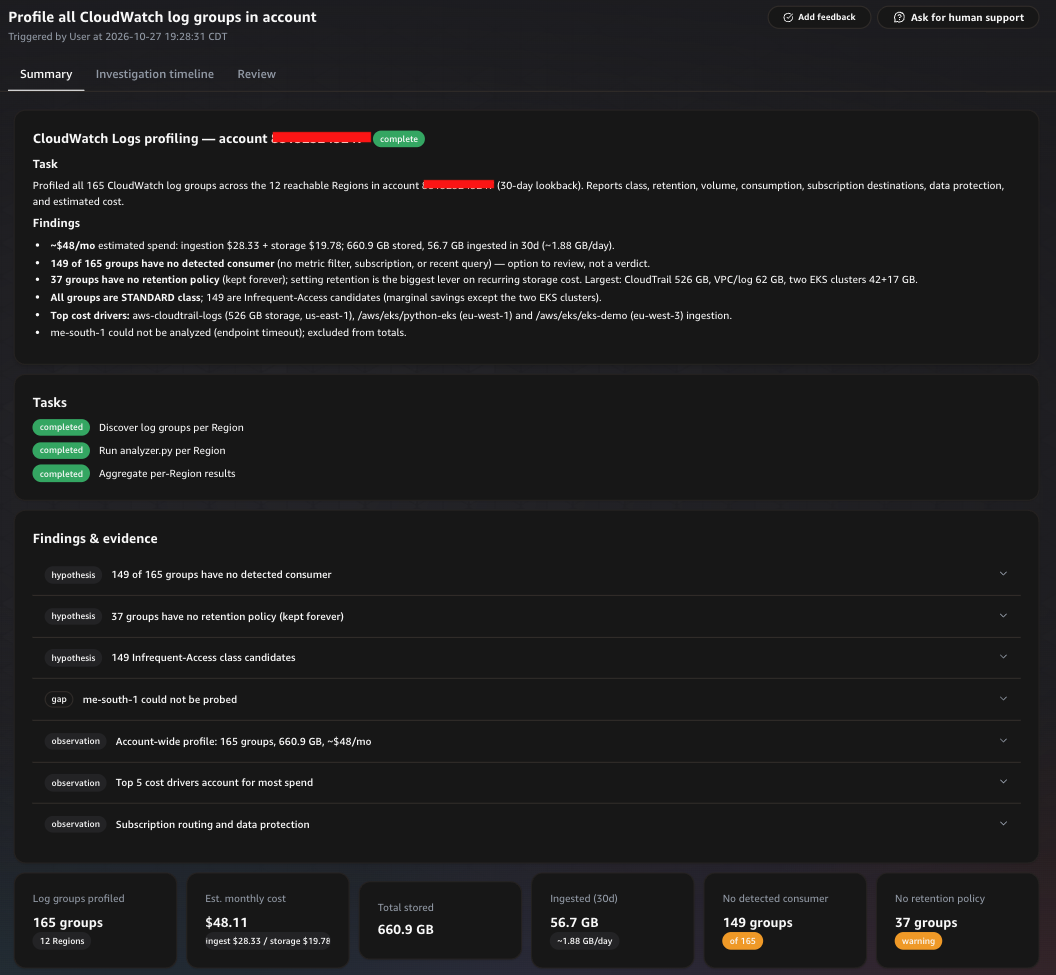
Figure 2: AWS DevOps Agent Investigation Summary with all CloudWatch Log profiles
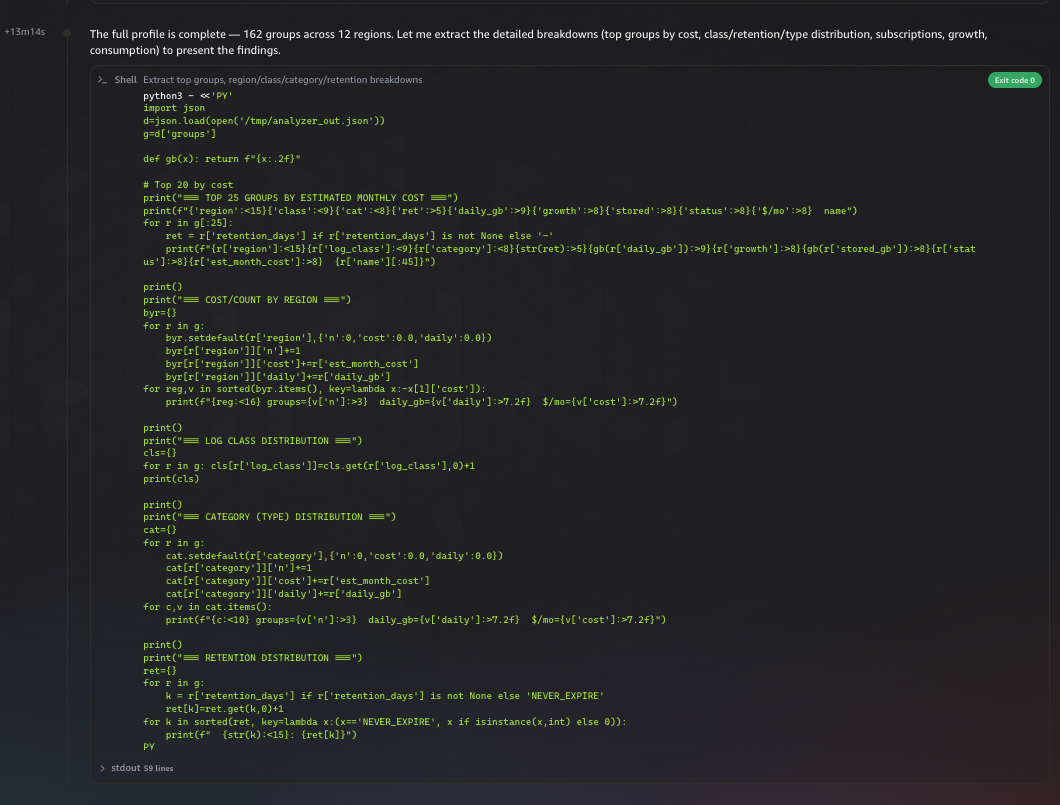
Figure 3: DevOps Agent investigation timeline showing custom script execution
Cost and coverage at scale
The post starts from an estate of hundreds of log groups across many accounts, so this section covers what a run costs and how you cover more than one account.
The script makes control-plane calls that AWS does not meter, including log-group, metric-filter, subscription-filter, query, and data-protection reads. The one metered call is cloudwatch:GetMetricData, which is billed by the number of metrics requested. The script requests one metric per log group, so the charge scales with how many log groups you have, not with how much they ingest. See the Amazon CloudWatch pricing page for the current rate. The script batches those requests into as few GetMetricData calls as the API allows. It also runs the per-group lookups concurrently. This does not change the number of metrics billed. It cuts the API round trips and the wall-clock time. That wall-clock time is what you pay AWS DevOps Agent for, at a per-second rate, so it is the real cost lever on a large estate.
Coverage is the other half. A single AWS DevOps Agent investigation covers one account, and the script analyzes one Region each time it runs. To cover more Regions, the agent runs the script once per Region within the same investigation and combines the results. Name another Region or ask for every Region, and it scopes each run for you. Across accounts, fan the investigations out rather than trying to widen a single one. The scheduled trigger in the next section posts one investigation per account, each against its own Region list, and you aggregate the per-account profiles downstream. The fan-out lives in the trigger, not in a single long-running run, so each investigation stays scoped, fast, and independently retryable.
Run the analysis on a schedule
The steps so far run the analysis on demand. To review your estate on a regular cadence, trigger the investigation automatically with Amazon EventBridge Scheduler and a small AWS Lambda function.
AWS DevOps Agent gives each Agent Space a webhook URL that starts an investigation. The flow is:
Amazon EventBridge Scheduler (for example, every Monday at 08:00)
-> AWS Lambda (posts a signed request to the webhook with a fixed prompt)
-> AWS DevOps Agent starts an investigation
-> the skill runs analyzer.py in Sandbox and returns the profile
The Lambda function sends the same prompt on every run, so the skill activates consistently. The schedule produces a repeatable profile that you can review or route to Slack or Jira. For a multi-account estate, the same Lambda function iterates your account list and posts one investigation per account against that account’s Region list. Each account is profiled independently on the same cadence, and a failure in one account’s investigation does not stop the investigations for other accounts. This automation adds a lightweight EventBridge rule and a Lambda function. The analysis itself runs no standing infrastructure. Only the trigger does.
Considerations
Keep these points in mind. Sandbox is a preview feature and runs during investigations only. The script analyzes one Region, us-east-1 by default. To cover another Region or the whole account, ask the agent in plain language, for example by naming a Region or asking for every Region in the account, and the agent scopes the run for you. A wider scope means more API calls and a longer run. The lookback window is 30 days, set by the LOOKBACK_DAYS constant. Cost figures are estimates from the rates set in the script, so confirm current per-Region rates on the Amazon CloudWatch pricing page and on each destination service pricing page. The script reports query counts rather than query cost, because DescribeQueries does not return scanned bytes.
Cleaning up
The analysis creates no standing resources, so a run leaves nothing to delete. If you turn on Sandbox only to try this skill, you can remove it. Open the Agent Space, choose the Capabilities tab, and remove the Sandbox configuration. If you create an Agent Space only for this walkthrough, delete it from the AWS DevOps Agent console. If you set up the schedule, delete the EventBridge Scheduler schedule and the Lambda function.
Conclusion
Managing logs at scale is a matter of visibility. You want to know what you have, who uses it, where it flows, whether each group fits its use, and how it changes over time. CloudWatch Logs produces all of these signals, and this post shows you how to bring them together. You package an operational procedure as a skill, let AWS DevOps Agent run it in Sandbox, and turn raw log-group data into an interpreted profile with options, with cost included as one dimension among several. The same pattern applies to any operational task that needs safe, repeatable computation over your AWS data. The operating model matters more than the script. Treat the estate as one system, read its signals together, and present options rather than mandates. The code makes that repeatable.
To learn more about the building blocks, see the AWS DevOps Agent documentation and the Amazon CloudWatch Logs documentation.