AWS Security Blog
How to improve visibility into AWS WAF with anomaly detection
When your APIs are exposed on the internet, they naturally face unpredictable traffic. AWS WAF helps protect your application’s API against common web exploits, such as SQL injection and cross-site scripting. In this blog post, you’ll learn how to automatically detect anomalies in the AWS WAF metrics to improve your visibility into AWS WAF activity, identify malicious activity, and simplify your investigations. The service that this solution uses to detect anomalies is Amazon Lookout for Metrics.
Lookout for Metrics is a service you can use to monitor business or operational metrics such as successful or failed HTTP requests and detect anomalies by using machine learning (ML). You can configure Lookout for Metrics to monitor different data sources that contain AWS WAF metrics, including Amazon CloudWatch. Lookout for Metrics can also take actions such as publishing findings in AWS Security Hub.
Solution overview
The solution in this blog post uses Amazon API Gateway to serve a simple REST API. AWS WAF protects API Gateway with AWS Managed Rules for AWS WAF. Amazon Lookout for Metrics actively detects unusual patterns in AWS WAF rule actions and sends a finding to Security Hub when suspicious activity is detected. Figure 1 shows the solution architecture.
Because AWS WAF integrates with Application Load Balancer, Amazon CloudFront distributions, or AWS AppSync GraphQL APIs, this solution also applies to these services.
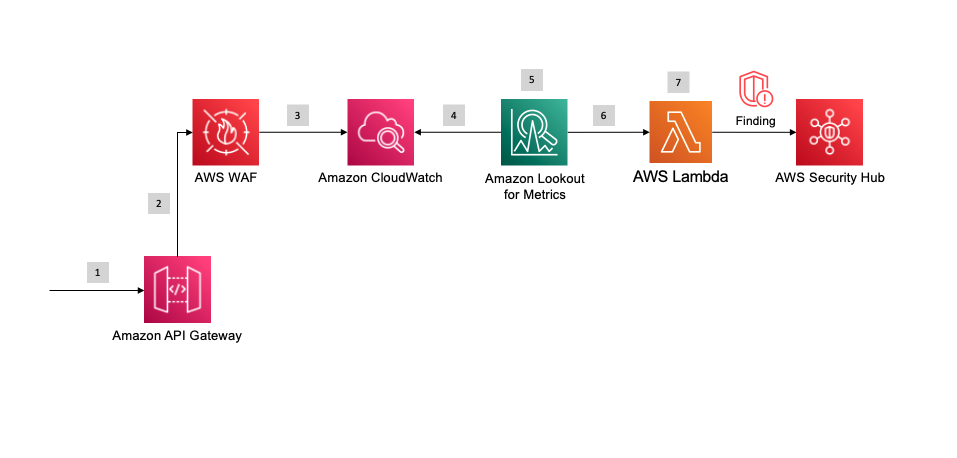
Figure 1: Solution architecture
The workflow of the solution is as follows:
- An HTTP request reaches the API Gateway endpoint.
- AWS WAF analyzes the HTTP request using the configured rules.
- Amazon CloudWatch collects action metrics for each rule that is configured in AWS WAF.
- Amazon Lookout for Metrics monitors CloudWatch metrics, selects the best ML algorithm, and trains the ML model.
- Lookout for Metrics detects outliers and provides a severity score to diagnose the issue.
- Lookout for Metrics invokes an AWS Lambda function when an anomaly is detected.
- The Lambda function sends a finding to Security Hub for further analysis.
Let’s take a detailed look at the AWS services that you will use in this solution.
Amazon API Gateway
Amazon API Gateway is a serverless API management service that supports mock integrations for API methods. This is the easiest and the most cost-effective way to implement this solution. But you can also use Amazon CloudFront, AWS AppSync GraphQL API, and Application Load Balancer to implement this solution in your workload.
AWS WAF
AWS WAF is a web application firewall you can associate with API Gateway for REST APIs, Amazon CloudFront, AWS AppSync for GraphQL API, or Application Load Balancer. AWS WAF is integrated with other AWS services such as CloudWatch. AWS WAF uses rules to detect common web exploits in the incoming HTTP requests. You can configure your own rules, or use managed rulesets from AWS or from a third-party vendor. In this solution, you use AWS Managed Rules, which contains the CrossSiteScripting_QUERYARGUMENTS rule.
Amazon CloudWatch
Amazon CloudWatch is a monitoring and observability service. CloudWatch receives specific metrics from AWS WAF every 5 minutes. In particular, for each AWS WAF rule, CloudWatch provides PassedRequests, BlockedRequests, and CountedRequests metrics.
Amazon Lookout for Metrics
Amazon Lookout for Metrics uses machine learning (ML) algorithms to automatically detect and diagnose anomalies in your metrics. By using CloudWatch metrics as a data source for Lookout for Metrics, you can apply one of the Lookout for Metrics ML models to detect anomalies in a faster way. In addition, you can provide feedback on detected anomalies to help improve the model accuracy over time. Lookout for Metrics is available in the US East (Ohio), US East (N. Virginia), US West (Oregon), Asia Pacific (Singapore), Asia Pacific (Sydney), Asia Pacific (Tokyo), Europe (Frankfurt), Europe (Ireland), and Europe (Stockholm) AWS Regions.
AWS Lambda
In this solution, you use an AWS Lambda function as an alert mechanism for Lookout for Metrics. When the machine learning model detects an outlier, it invokes the Lambda function, which implements a custom code. The Lambda function then imports the anomaly as a finding to Security Hub.
AWS Security Hub
In this solution, you use AWS Security Hub as a centralized way to manage security findings. This integration has the advantage of providing a common place for the security team to diagnose security findings from various sources, and uniformly integrates with your existing Security Information and Event Management (SIEM) system.
Prerequisites
This solution uses Security Hub to collect anomaly detection findings. Before you deploy the solution, you need to enable Security Hub in your AWS account by following the instructions provided in to enable Security Hub manually. After you enable Security Hub, you can optionally select the security standards that are relevant for your workload, as shown in Figure 2.
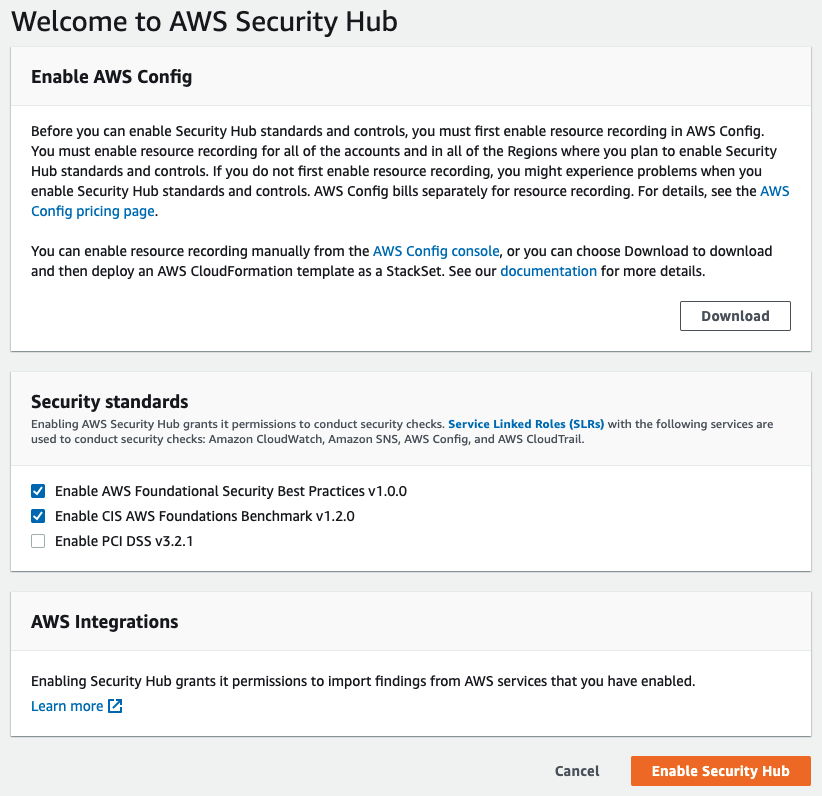
Figure 2: Manually enabling Security Hub in the AWS Management Console
Deploy the solution
A ready-to-use solution is provided as an AWS Cloud Development Kit (AWS CDK) application in the AWS WAF Anomaly Detection CDK project GitHub code repository. You can clone the GitHub repository and deploy the application by using the AWS CDK for Python.
Important: After you successfully deploy the solution, you should activate the Lookout for Metrics detector. This is not done as part of the CDK deployment. To activate the detector, in the AWS Management Console navigate to Amazon Lookout for Metrics, select the detector the solution created (WAFBlockingRequestDetector), and choose Activate. Alternatively, you can use the following AWS command to activate your detector.
If you don’t want to run the CDK application, you can implement the same solution by using the AWS Management Console. In the following sections, I’ll go through the manual steps you can follow to achieve this.
Create an API to demonstrate the solution
First, you need an HTTP endpoint to protect. AWS WAF is integrated with CloudFront, Application Load Balancer, API Gateway, and AWS AppSync GraphQL API. In this blog post, I recommend a REST API Gateway because it’s a fully managed service to create and manage APIs. In addition, API Gateway provides a mechanism to implement mock APIs.
To build a REST API, follow the instructions for creating a REST API in Amazon API Gateway. After you create the API, create a GET method at the API root level and associate it to a mock endpoint, as shown in Figure 3. This is just enough to return an HTTP 200 status code to any GET requests.
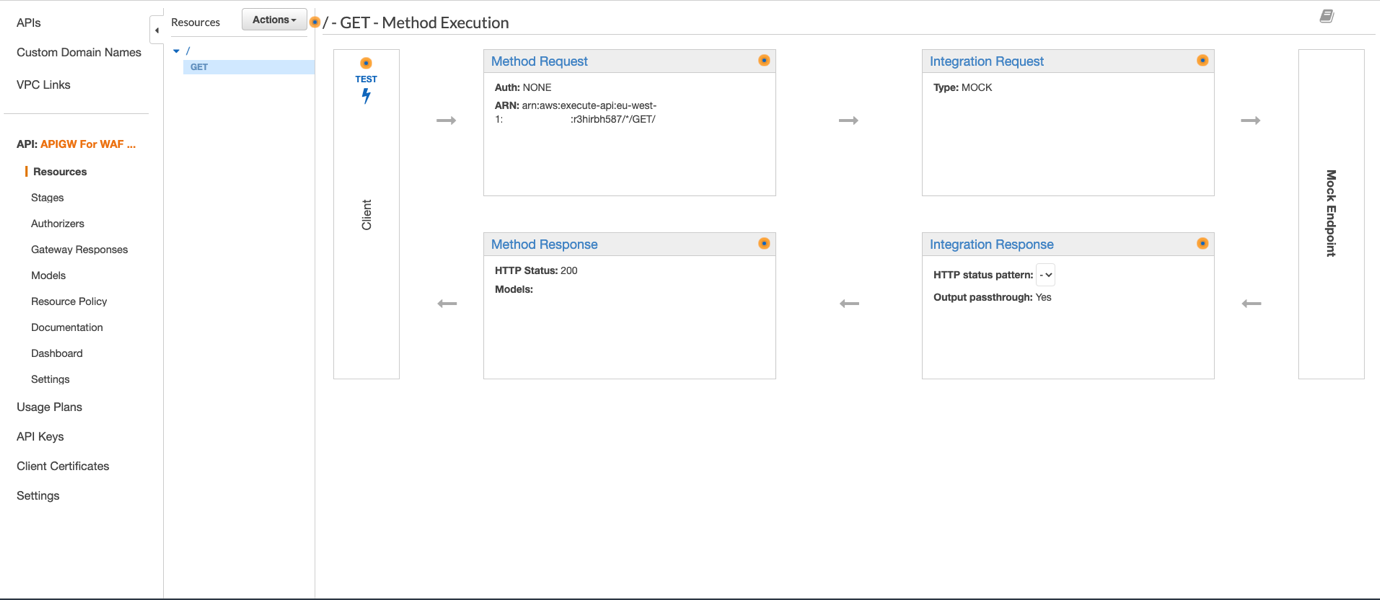
Figure 3: Creating an API with mock integration
Finally, deploy the API under the “prod” stage and keep all the default settings.
Create an AWS WAF web ACL to deploy the managed rules
Now that you’ve created an API in API Gateway, you need to create an AWS WAF web access control list (web ACL) by following the instructions in Creating a web ACL. A web ACL is the top-level configuration object of AWS WAF. This is the collection of AWS WAF rules that you will apply to your API. API Gateway is a regional service, so make sure to create a web ACL in the same AWS Region as the API. After you create the web ACL, add the Core rule set (CRS) rule group from AWS Managed Rules, also called AWSManagedRulesCommonRuleSet, as shown in Figure 4. This rule group contains the CrossSiteScripting_QUERYARGUMENTS rule, which you will use later to demonstrate the anomaly detection.
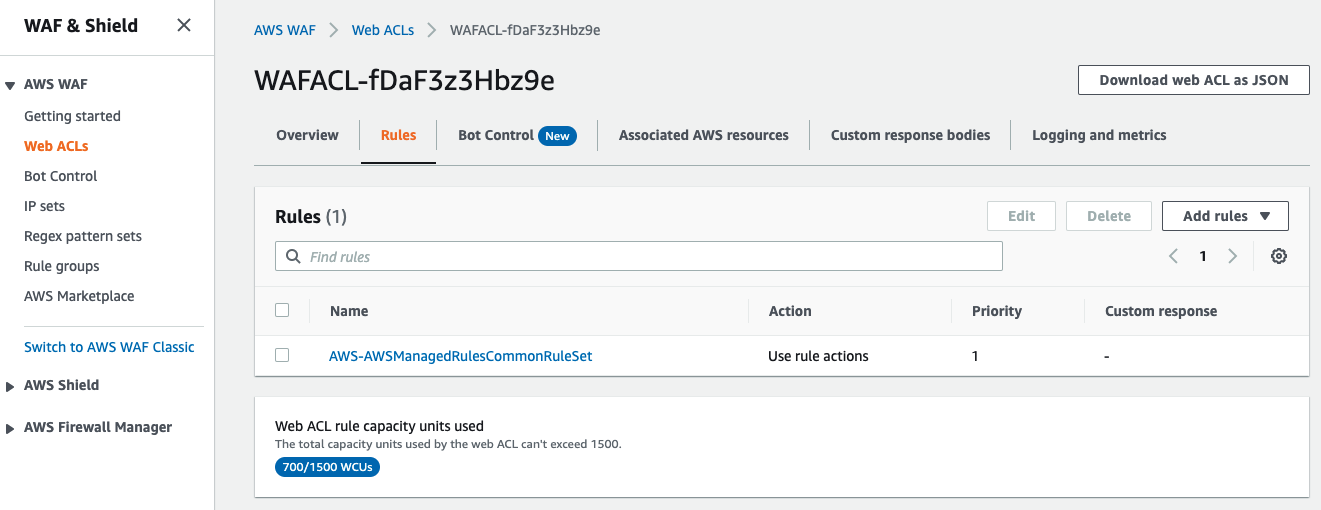
Figure 4: Adding AWSManagedRulesCommonRuleSet to the AWS WAF web ACL
By observing Web ACL rule capacity units used, you can see that the Core rule set is consuming 700 web ACL capacity units (WCUs). The maximum capacity for a web ACL is 1,500, which is sufficient for most use cases. If you need more capacity, contact the AWS Support Center.
Associate the web ACL with the API deployment
After you create the web ACL, you associate it with the API. To do this, in the AWS WAF console, navigate to the web ACL you just created. On the Associated AWS resources tab, choose Add AWS resources. When prompted, choose the API you created earlier, and then choose Add.
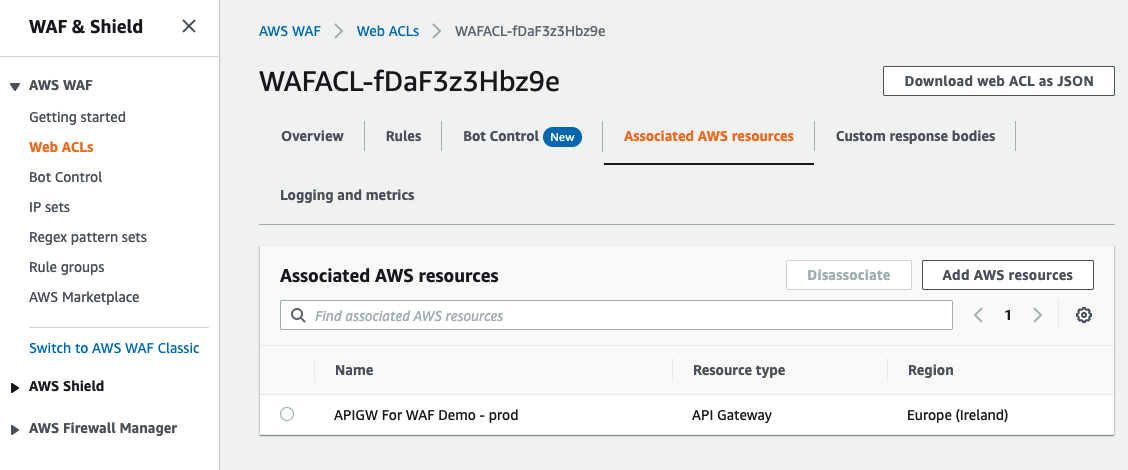
Figure 5: Associating the web ACL with the API
Create a Lambda function to forward the anomaly to Security Hub
It’s useful to get visibility into the anomalies that are detected by the solution, and there are various ways to do that. In this solution, you provide such visibility as findings to Security Hub. Security Hub provides a centralized place to manage different findings from your AWS solutions. It also provides graphical tools to help with diagnostics.
You use a Lambda function that receives each anomaly and imports them into Security Hub. You can find the lookout_alarm Lambda function on GitHub, or follow the instructions to build a Lambda function with Python. You will use this Lambda function to provide additional context enrichment in the finding.
Before you use this Lambda function, make sure you enable Security Hub.
Create the Lookout for Metrics detector, dataset, and alarm
Now you have an API that is protected by an AWS WAF web ACL. You also have configured a way to integrate with Security Hub through a Lambda function. The next step is to create a Lookout for Metrics detector and connect all these elements together. The key concepts and terminology of Lookout for Metrics are:
- Detector – A Lookout for Metrics resource that monitors a dataset and identifies anomalies.
- Dataset – The detector’s copy of the data that Lookout for Metrics is analyzing.
- Alert – A mechanism to send a notification or initiate a processing workflow when the detector finds an anomaly.
First, follow the instructions to create a detector. The only information you need to provide is a name and an interval. The interval is the amount of time between two analyses. Your choice of the interval depends upon criteria such as the metrics you are processing, or the retention time of your data. For more information on the detector interval, see Lookout for Metrics quotas. In the example in Figure 6, I chose an interval of 5 minutes, which is the minimum.
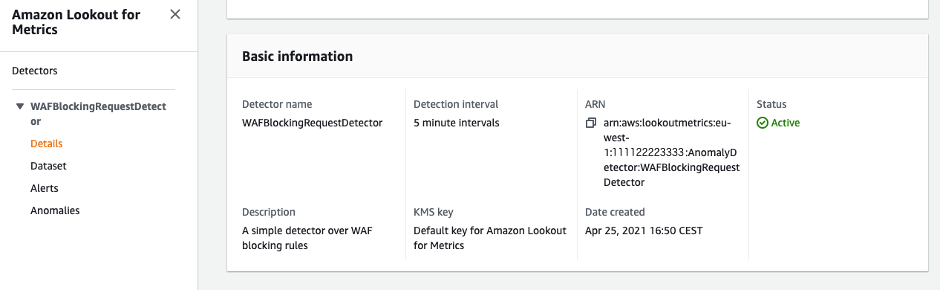
Figure 6: Creating an Amazon Lookout for Metrics detector
After you create the detector, follow the instructions to configure a dataset that uses CloudWatch as a data source. Select Create a role in the service role, choose Next, and enter the following parameters:
- For the CloudWatch namespace, choose AWS/WAFV2.
- For Dimensions, choose Region, Rule, and WebACL.
- For Measure, choose BlockedRequests.
- For Aggregation function, choose SUM.
Figure 7 shows the data source fields that the detector will check for anomalies.
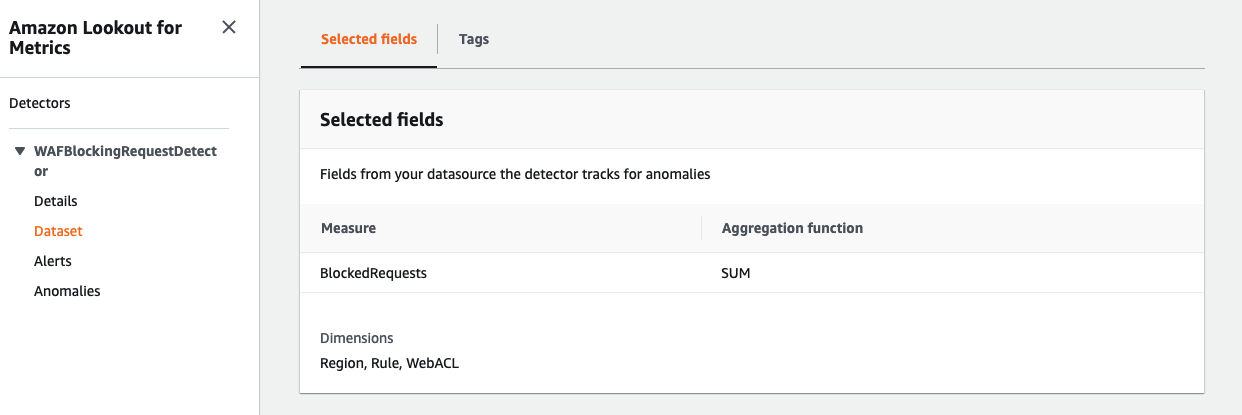
Figure 7: Creating an Amazon Lookout for Metrics dataset
Next, create a Lookout for Metrics alert to invoke the Lambda function. To do so, follow the instructions for working with alerts. You provide a name, a channel (the Lambda function), and a severity threshold. One of the main advantages of Lookout for Metrics is the scoring of the detected anomaly, which indicates the severity. Anomalies have a score from 0 to 100. You can set up different alerts with different thresholds that are associated to the same detector. This way, you can provide alerts for different severity levels. In the example in Figure 8, I created a single alert with a severity threshold of 10.
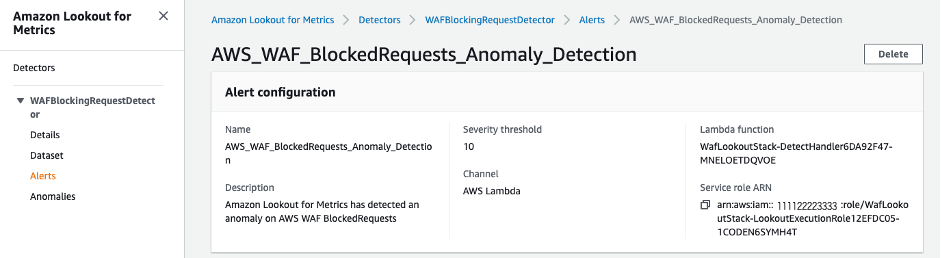
Figure 8: Creating an Amazon Lookout for Metrics alert
The last steps are to activate the detector and configure Lookout for Metrics to select a ML model and train it. To do so, choose Activate on the detector details page.
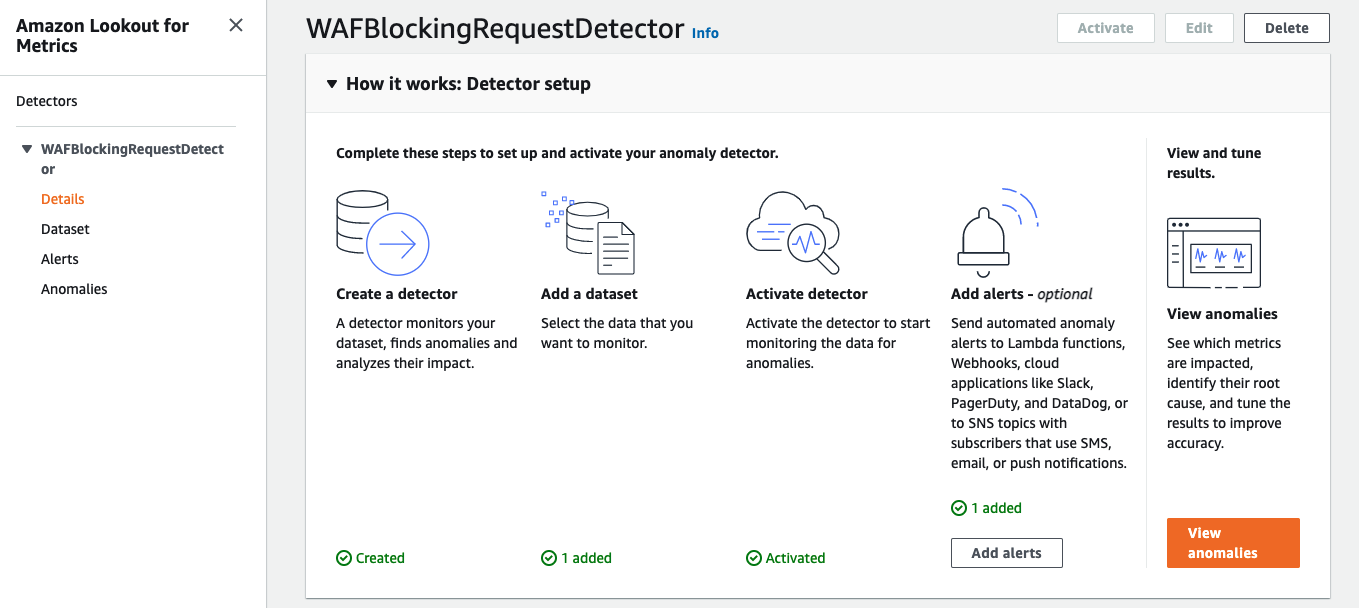
Figure 9: Activating the Amazon Lookout for Metrics detector
Why does this solution use Lookout for Metrics anomaly detection?
Amazon CloudWatch offers native anomaly detection on a given metric. This function is useful to apply statistical and ML algorithms that continuously analyze metrics, determine normal baselines, and identify anomalies with minimal user intervention.
Lookout for Metrics provides a more sophisticated version of anomaly detection, which makes it the better choice for this solution. Lookout for Metrics automatically supports a collection of ML algorithms. For example, no one algorithm works for all kinds of data, so Lookout for Metrics inspects the data and applies the right ML algorithm to the right data to accurately detect anomalies. In addition, Lookout for Metrics groups concurrent anomalies into logical groups, and sends a single alert for the anomaly group rather than separate alerts, so you can see the full picture. Finally, Lookout for Metrics allows you to provide feedback on the detected anomalies, which AWS uses to continuously improve the accuracy and performance of the models.
Publish the value zero in CloudWatch metrics
The reporting criteria for AWS WAF metrics is a nonzero value. This means that the BlockedRequests metric isn’t updated if AWS WAF isn’t blocking any requests. In the absence of real HTTP traffic, typically in a testing environment, the value zero must be published. In production, because AWS WAF is actively blocking illegitimate requests, this publication is not required. To train the ML model in the absence of blocked requests, you need to publish the value zero by calling the PutMetricData CloudWatch API method every 5 minutes.
In my example, I selected a 5-minute period to be aligned with the Lookout for Metrics interval. It’s possible to publish a zero value every five minutes by using the CloudWatch metrics API, as shown following. The zero value doesn’t impact the SUM and ensures that at least one value is published every five minutes. You can use the cloudwatch_zero Lambda function on GitHub to publish the value zero by using the AWS SDK for Python.
To create a CloudWatch Events rule to schedule the call every 5 minutes
- Navigate to the CloudWatch Event console and choose Create Rule.
- Choose Schedule, keep the 5-minute default interval, and choose Add target.
- Select the name of the function you previously created, expand the Configure input section.
- Choose Constant (JSON text), as shown in Figure 10. In the text field, paste the following configuration:
- Choose Configure details.
- Enter a name for your rule, and then choose Create rule.
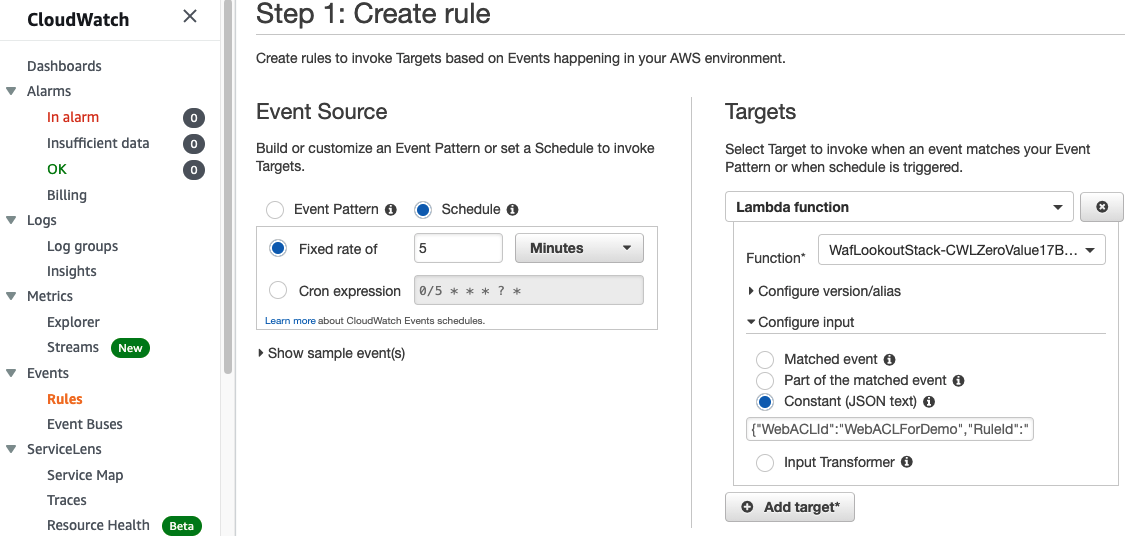
Figure 10: Creating a CloudWatch Events rule scheduled every 5 minutes
Training time
Before the activated detector attempts to find anomalies, it uses data from several intervals to learn. If no historical data is available, the training process takes approximately one day for a five-minute interval. When you first deploy this solution, you have no historical data in CloudWatch for your AWS WAF resources, and you’re facing a cold start of Lookout for Metrics anomaly detection. Because the Lookout for Metrics detector interval is set to 5 minutes, you have to wait for 25 hours before being able to detect an anomaly. If you deploy the solution against an AWS WAF resource that’s been in production for days, you’ll have a reduced training time.
Test the anomaly detection
After 25 hours, Lookout for Metrics correctly selects an ML model that fits your metrics behavior, and correctly trains it based on your actual data. You can then start to test the anomaly detection. You can use a simple curl command, injecting a JavaScript alert() call in a query parameter as described in the AWS WAF documentation, to invoke the CrossSiteScripting_QUERYARGUMENTS managed rule. Make sure to inject a significant number of requests to ensure detection of blocked requests anomalies.
After you run the injection script, wait for the system to detect the anomaly. The CloudWatch BlockedRequests metric takes up to 5 minutes to update, and Lookout for Metrics is configured to detect anomalies in the CloudWatch data every 5 minutes. For those reasons, it can take 10 minutes to detect the simulated anomaly.
After detection and processing time, the finding is visible in Security Hub. To view the finding, go to the AWS Management Console, choose Services, choose Security Hub, and then choose Findings.
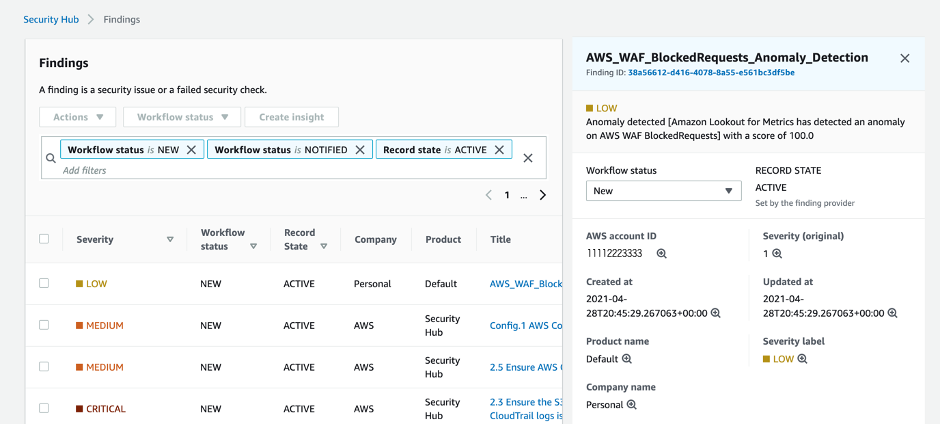
Figure 11: AWS Security Hub findings
In Figure 11, you can see the new finding, coming from Lookout for Metrics, with a Low severity and an anomaly score of 100. You can use the remediation field to open the Lookout for Metrics console, where you can give feedback on the anomaly detection to improve the model for future detections.
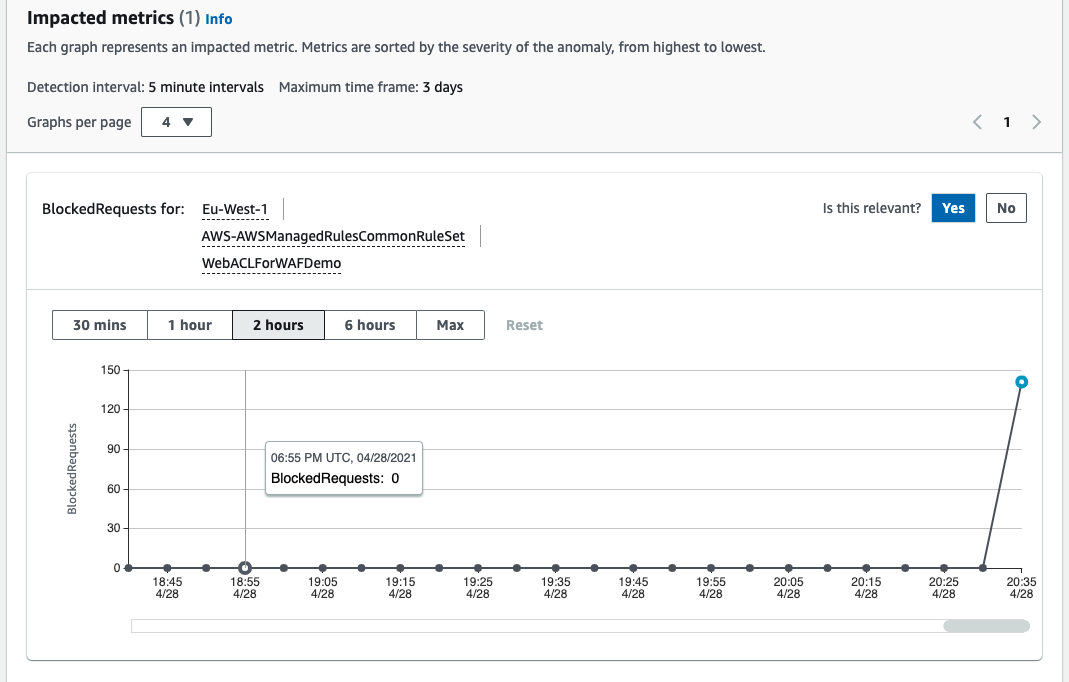
Figure 12: Lookout for Metrics console, Finding view
Figure 12 shows the Lookout for Metrics graphical interface, where you can see the metrics related to the finding. The previous injection script impacted only one metric, but the same setup works to observe anomalies that arise between two or more metrics together. This feature makes diagnosis of issues easier.
For each of the impacted metrics, to confirm that the anomaly is relevant, choose the Yes button next to Is this relevant? above the graph.
Extend the solution
The solution in this post detects anomalies in the AWS WAF blocked request behavior. But you can also configure AWS WAF rule actions to count your requests instead of blocking them. This is usually done on legacy systems or for some particular rules of a managed ruleset that present an incompatibility with your workload. When you configure the rule action as a count, you increase the need for a comprehensive observability approach. By implementing anomaly detection against counted requests, this solution will help you to achieve better observability for your system.
Concerning the remediation, it’s possible to modify this solution by integrating it with different AWS services. As an example, you can integrate the anomaly detection with your own SIEM system, or simply notify your security team distribution list by using Amazon Simple Notification Service (Amazon SNS).
AWS WAF provides additional information in its logs, such as the IP address for the client. To detect anomalies in AWS WAF logs, you can ingest the AWS WAF logs to Amazon Simple Storage Service (Amazon S3), and then use Lookout for Metrics with Amazon S3 as a data source.
Conclusion
AWS WAF is integrated with CloudWatch and provides metrics for passed requests, blocked requests, or counted requests. With Lookout for Metrics, you can detect unexpected behavior in CloudWatch metrics by using a machine learning (ML) model. In this blog, I showed you how to integrate both services to provide AWS WAF with an ML-based anomaly detection mechanism. ML is a way to gain more visibility into your AWS WAF behavior. In addition, you can easily be notified when the system detects abnormal levels of blocked (or counted) requests, in order to take the right remediation action.
If you have feedback about this post, submit comments in the Comments section below. If you have questions about this post, start a new thread on the AWS WAF forum or contact AWS Support.
Want more AWS Security how-to content, news, and feature announcements? Follow us on Twitter.