The Internet of Things on AWS – Official Blog
Digital Twins on AWS: Predicting “behavior” with L3 Predictive Digital Twins
In our prior blog, we discussed a definition and framework for Digital Twins consistent with how our customers are using Digital Twins in their applications. We defined Digital Twin as “a living digital representation of an individual physical system that is dynamically updated with data to mimic the true structure, state, and behavior of the physical system, to drive business outcomes.” In addition, we described a four-level Digital Twin leveling index, shown in the figure below, to help customers understand their use-cases and the technologies needed to achieve the business value they are seeking.

In this blog, we will illustrate how the L3 Predictive level predicts behavior of a physical system by walking through an example of an electric vehicle (EV). You will learn, through the example use-cases, about the data, models, technologies, AWS services, and business processes needed to create and support an L3 Predictive Digital Twin solution. In prior blogs, we described the L1 Descriptive and L2 Informative levels, and a future blog, we will continue with the same EV example to demonstrate L4 Living Digital Twins.
L3 Predictive Digital Twin
An L3 Digital Twin focuses on modeling the behavior of the physical system to make predictions of unmeasured quantities or future states under continued operations with the assumption that future behavior is the same as the past. This assumption is reasonably valid for short-time horizons looking forward. The predictive models can be machine learning based, first-principles based (e.g. physics simulations), or a hybrid. To illustrate L3 Predictive Digital Twins, we will continue our example of the electric vehicle (EV) from the L1 Descriptive and L2 Informative Digital Twin blogs by focusing on three use cases: 1/ virtual sensors; 2/ anomaly detection; and 3/ imminent failure predictions over very short time horizons. To illustrate how to implement on AWS, we have extended our AWS IoT TwinMaker example from the L2 Informative blog with components related to these three capabilities. In the next sections we will discuss each of them individually.
1. Virtual Sensor
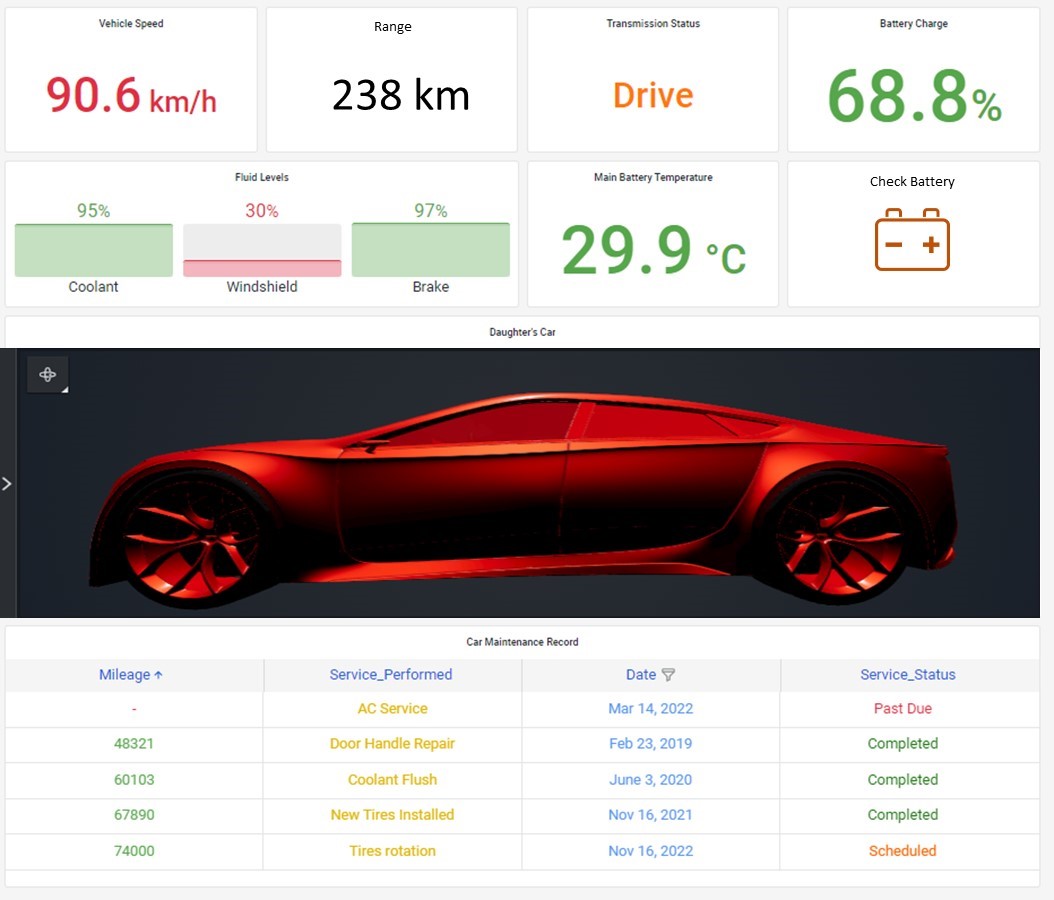
For our EV example, a common challenge is to estimate the remaining range of the vehicle given its battery’s present state of charge (SoC). For the driver, this is a critical piece of information since getting stranded generally requires having your EV towed to the nearest charging station. Predicting the remaining range, however, is not trivial as it requires implementing a model that takes into account the battery state of charge, the battery discharge characteristics, the ambient temperature which has an impact on battery performance, as well as some assumptions on the expected upcoming driving profile (e.g., flat or mountainous terrain, defensive or aggressive accelerations). In our L2 Informative blog, we used a very crude calculation for Remaining Range that could easily be hardcoded into an embedded controller. In our L3 Predictive example below, we replaced the simple calculation with an extension of the EV simulation model provided by our AWS Partner Maplesoft in our L1 Descriptive blog. This time the model incorporates a virtual sensor that calculates the estimated range based on the key input factors described above. The virtual sensor based vehicle range is shown in the Grafana dashboard below.

2. Anomaly Detection
With industrial equipment, a common use case is to detect when the equipment is running off-nominal performance. This type of anomaly detection is often integrated directly into the control system using simple rules such as threshold exceedances (e.g., temperature exceeds 100°C), or more complex statistical process control methods. These types of rules-based approaches would be incorporated into L2 Informative use cases. In practice, detecting off-nominal performance in a complex system like an EV is challenging, because the expected performance of a single component is dependent on the overall system operation. For example, for an EV, the battery discharge is expected to be much greater during a hard acceleration compared to driving at constant speed. Using a simple rules-based threshold on the battery discharge rate wouldn’t work because the system would think that every hard acceleration is an anomalous battery event. Over the past 15 years, we’ve seen increased use of machine learning methods for anomaly detection by first characterizing normal behavior based on historical data streams, and then constantly monitoring the real time data streams for deviations from the normal behavior. Amazon Lookout for Equipment is a managed service that deploys supervised and unsupervised machine learning methods to perform this type of anomaly detection. The figure below shows a screenshot from the Grafana dashboard showing that the “Check Battery” light has been illuminated due to anomalous behavior detected.
To understand the details of the anomaly, we examine the output of Amazon Lookout for Equipment in the AWS Management Console. The dashboard shows all the anomalies that were detected in the time window we examined – including the anomaly that led to the “Check Battery” light turning red. Selecting the anomaly shown in the Grafana dashboard we see that the four sensors on which the model was trained all show anomalous behavior. The Amazon Lookout for Equipment dashboard shows the relative contribution of each sensor to this anomaly in per cent. Anomalous behavior of the battery voltage and the battery SoC are the leading indicator in this anomaly.

This is consistent with how we introduced the anomaly in the synthetic dataset and trained the model. We first used periods of normal operation to train an unsupervised Amazon Lookout for Equipment model on the four sensors shown. After that, we evaluated this model on a new dataset shown in the Amazon Lookout for Equipment dashboard above, where we manually induced faults. Specifically, we introduced an energy loss term in the data leading to a subtle faster decline of the SoC that also affects the other sensors. It would be challenging to design a rules-based system to detect this anomaly early enough to avoid further damage to the car – particularly if such behavior has not been observed before. However, Amazon Lookout for Equipment does initially detect some anomalous periods and from a certain point onwards flags anomalies over the whole remaining time. Of course, the contributions of each sensor to an anomaly could also be displayed in the Grafana dashboard.
3. Failure Prediction
Another common use case for industrial equipment is to predict end of life of components in order to preplan and schedule maintenance. Developing models for failure prediction can be very challenging and typically requires custom analysis for failure patterns for the specific equipment under a wide variety of different operating conditions. For this use case, AWS offers Amazon SageMaker, a fully managed service to help train, build, and deploy machine learning models. We will show how to integrate Amazon SageMaker with AWS IoT TwinMaker in the next section when we discuss the solution architecture.
For our example, we created a synthetic battery sensor dataset that was manually labeled with its remaining useful life (RUL). More specifically, we calculated an energy loss term in our synthetic battery model to create datasets of batteries with different RUL and manually associated larger energy losses with shorter RULs. In real life such a labeled dataset could be created by engineers analyzing data of batteries that have reached their end of life. We used an XGBoost algorithm to predict RUL based on 2-minute batches of sensor data as input. The model takes features derived from these batches as input. For example, we smoothed the sensor data using rolling averages and compared the sensor data between the beginning and the end of the 2-minute batch. Note that we can make predictions at a granularity of less than 2 minutes by using a rolling window for prediction. In our example, the Remaining Useful Life of the battery is displayed in the dashboard under the Check Battery symbol. This vehicle is in a dire situation with a prediction of imminent battery failure!

4. Architecture
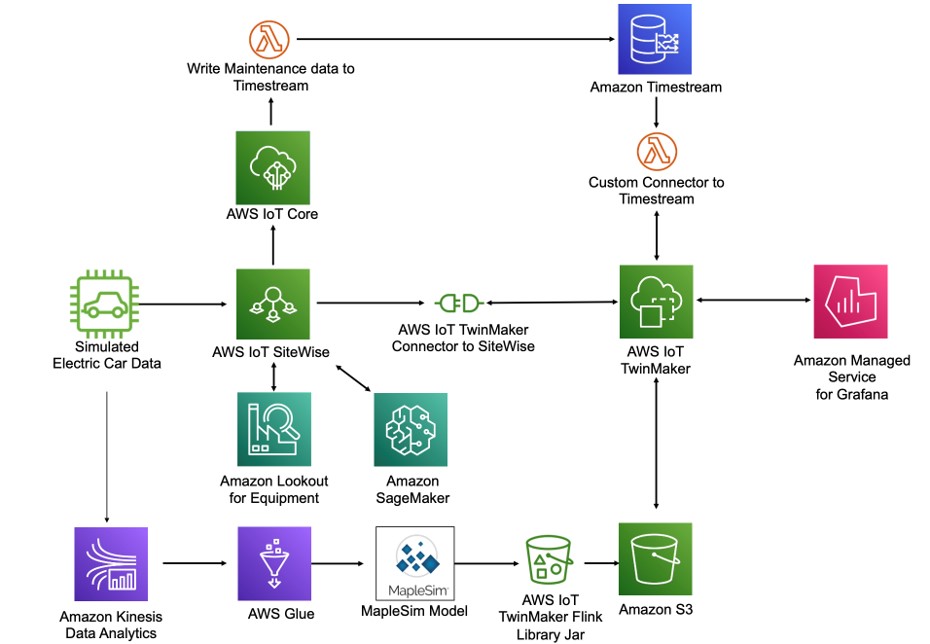
The solution architecture for the L3 Predictive DT use cases builds on the solution developed for the L2 Informative DT and is shown in below. The core of the architecture focuses on ingesting the synthetic data representing real electric vehicle data streams using an AWS Lambda function. The vehicle data including vehicle speed, fluid levels, battery temperature, tire pressure, seatbelt and transmission status, battery charge, and additional parameters are collected and stored using AWS IoT SiteWise. Historical maintenance data and upcoming scheduled maintenance activities are generated in AWS IoT Core and stored in Amazon Timestream. AWS IoT TwinMaker is used to access data from multiple data sources. The time series data stored in AWS IoT SiteWise is accessed through the built-in AWS IoT SiteWise connector, and the maintenance data is accessed via a custom data connector for Timestream.
For the L3 virtual sensor application, we extended the core architecture to use AWS Glue to integrate the Maplesoft EV model by using the AWS IoT TwinMaker Flink library as a custom connector in Amazon Kinesis Data Analytics. For anomaly detection, we first exported the sensor data to S3 for off line training (not shown in diagram). The trained models are made available via Amazon Lookout for Equipment to enable predictions on batches of sensor data via a scheduler. Lambda functions prepare the data for the models and process their predictions. We then feed these predictions back to AWS IoT SiteWise from where they are forwarded to AWS IoT TwinMaker and displayed in the Grafana Dashboard. For failure prediction, we first exported the sensor data to S3 for training and labeled using Amazon SageMaker Ground Truth. We then trained the model using an Amazon SageMaker training job and deployed an inference endpoint for the resulting model. We then placed the endpoint inside a Lambda function that is triggered by a scheduler for batch inferencing. We feed the resulting predictions back to AWS IoT SiteWise from where they are forwarded to AWS IoT TwinMaker and displayed in the Grafana Dashboard.
5. Operationalizing L3 Digital Twins: data, models, and key challenges
Over the past 20 years, advances in predictive modeling methods using machine learning, physics-based models, and hybrid models have improved the reliability of predictions to be operationally useful. Our experience, however, is that most prediction efforts still fail because of inadequate operational practices around deploying the model into business use.
For example, with virtual sensors, the key task is developing and deploying a validated model in an integrated data pipeline and modeling workflow. From a cloud-architecture perspective, these workflows are straightforward to implement as shown in the EV example above. The bigger challenges are on the operational side. First, building and validating a virtual sensor model for complex equipment can take years. Virtual sensors are often used for quantities that cannot be measured by sensors, so by definition there is no real-world validation data. As a result, the validation is often done in a research laboratory running experiments on prototype hardware using a few very expensive sensors or visual inspections for limited validation data to anchor the model. Second, once deployed, the virtual sensor only works if the data pipeline is robust and provides the model with the data it needs. This sounds obvious, but operationally can be a challenge. Poor real-world sensor readings, data drop-outs, incorrectly tagged data, site-to-site variations in data-tags and changes made to the control system tags during overhauls are often causes for tripping up a virtual sensor. Insuring good quality and consistent data is foundationally a business operations challenge. Organizations must define standards, quality-checking procedures, and training programs for the technicians who are working on the equipment. Technology will not overcome poor operational practices in gathering the data.
With anomaly detection and failure predictions, the data challenges are even greater. Engineering leaders are led to believe that their company is sitting on a gold-mine of data and wonder why their data science teams are not delivering. In practice, these data pipelines are indeed robust, but were created for entirely different applications. For example, data pipelines for regulatory or performance monitoring are not necessarily suitable for anomaly detection and failure predictions. Since anomaly detection algorithms are looking for patterns in the data, issues such as sensor mis-readings, data dropouts, and data tagging issues can render the prediction models useless, but that same data can be acceptable for other use cases. Another common challenge is that data pipelines that are thought to be fully automated, are in fact not. Undocumented manual data corrections requiring human judgement are typically only discovered when the workflow is automated for scaling and is found not to work. Lastly, for industrial assets, failure prediction models rely on manually collected inspection data since it provides the most direct observation of the actual condition of the equipment. In our experience, the operational processes around collecting, interpreting, storing and integrating inspection data are not robust enough to support failure models. For example, we have seen inspection data show up in the system months after it was collected, long after the equipment has already failed. Or the inspection data consists of handwritten notes attached to an incorrectly completed inspection data record or associated with the wrong piece of equipment. Even the best predictive models will fail when provided incorrect data.
For L3 Predictive Digital Twins, we encourage our customers to develop and validate the business operations to support the Digital Twin’s data needs at the same that the engineering teams are building the Digital Twins themselves. Having an end-to-end workflow mindset from data collection through to predictions and acting on the predictions is critical for success.
Summary
In this blog we described the L3 Predictive level by walking through the use cases of a virtual sensor, anomaly detection, and failure prediction. We also discussed some of the operational challenges in implementing the necessary business processes to support the data needs of an L3 Digital Twin. In a prior blog, we described the L1 Descriptive and the L2 Informative levels. In a future blog, we will extend the EV use case to demonstrate L4 Living Digital Twins. At AWS, we’re excited to work with customers as they embark on their Digital Twin journey across all four Digital Twin levels, and encourage you to learn more about our new AWS IoT TwinMaker service on our website.
About the authors
 |
Dr. Adam Rasheed is the Head of Autonomous Computing at AWS, where he is developing new markets for HPC-ML workflows for autonomous systems. He has 25+ years experience in mid-stage technology development spanning both industrial and digital domains, including 10+ years developing digital twins in the aviation, energy, oil & gas, and renewables industries. Dr. Rasheed obtained his Ph.D. from Caltech where he studied experimental hypervelocity aerothermodynamics (orbital reentry heating). Recognized by MIT Technology Review Magazine as one of the “World’s Top 35 Innovators”, he was also awarded the AIAA Lawrence Sperry Award, an industry award for early career contributions in aeronautics. He has 32+ issued patents and 125+ technical publications relating to industrial analytics, operations optimization, artificial lift, pulse detonation, hypersonics, shock-wave induced mixing, space medicine, and innovation. |
 |
Seibou Gounteni is a Specialist Solutions Architect for IoT at Amazon Web Services (AWS). He helps customers architect, develop, operate scalable and highly innovative solutions using the depth and breadth of AWS platform capabilities to deliver measurable business outcomes. Seibou is an instrumentation engineer with over 10 years experience in digital platforms, smart manufacturing, energy management, industrial automation and IT/OT systems across a diverse range of industries. |
 |
Dr. David Sauerwein is a Data Scientist at AWS Professional Services, where he enables customers on their AI/ML journey on the AWS cloud. David focuses on forecasting, digital twins and quantum computation. He has a PhD in quantum information theory. |