Amazon Web Services ブログ
Amazon CloudWatch MCP Server と Amazon Q CLI で SAP 運用を効率化 – Part 4
はじめに
AWS 上の SAP 運用を最適化するには、効率的な監視、トラブルシューティング、およびメンテナンス機能が必要です。part 1(英語) での Amazon CloudWatch Application Insight に関する以前の議論、part 2(英語) での CloudWatch Application Insight を使用して SAP 高可用性を監視する方法、および part 3 での Amazon CloudWatch Model Context Protocol (MCP) Server と Amazon Q for command line (Q CLI) に基づき、この第4回では、これらのツールの高度な実世界のアプリケーションを実演します。実用的なユースケースを通じて、この統合が SAP メンテナンス計画をどのように効率化し、根本原因分析を加速するかを探ります。
詳細な例を通じて、CloudWatch MCP Server と Q CLI がどのように連携して以下を実現するかを示します:
- 最小限の中断で計画的なメンテナンスイベントを調整
- インテリジェントなログ分析を通じて問題診断を高速化
- SAP 運用のためのコンテキストに応じた推奨事項を提供
- SAP インシデントの平均解決時間を短縮
ユースケース 3: SAP の計画的メンテナンスイベント
このユースケースでは、SAP アプリケーションクラスターで計画的メンテナンスイベントを実行します。ワークフロー統合により、チームは IDE で CloudWatch メトリクスを直接表示しながら、Q CLI を使用して正確な修復コマンドを生成することで、破壊的なコンテキスト切り替えなしに問題を診断できます。このシナリオでは、Q CLI は次のようにタスクリストを作成しました:
- App Server のステータスを確認するプロンプト
- aws ec2 describe-instances を実行して SAP クラスターステータスを確認
- ssm コマンド crm_mon を実行して ASCS と ERS クラスターを確認
- ssm コマンド ps を実行して ASCS と ERS プロセスステータスを取得
- ssm コマンド sapcontrol を実行してプロセスリストを取得
- ssm コマンドを実行して pacemaker.log を確認
- ssm コマンド crm を実行してクラスターリソースステータス、制約、構成を確認
- 誤ったクラスター構成のため ERS が無効になっていることを要約
- CloudWatch ログを確認するプロンプトの後
- describe_log_groups を実行
- analyze_log_groups を実行
- ASCS と ERS に関連する execute_log_insights_query を検索実行
- 手元の ERS 問題に関連する execute_log_insights_query を検索実行
- ERS 問題に関連するすべてのログエントリを要約
- SAP ERS サービスを起動するプロンプトの後
- ssm コマンド crm を実行してクラスターリソースステータスを確認
- ssm コマンド crm を実行して ERS リソースを有効化(予想通り失敗)
- ssm コマンドを実行してリソース構成を更新
- ssm コマンド crm を実行して ERS リソースを有効化(構成修正後)
- ssm コマンド sapcontrol を実行して ASCS と ERS のプロセスリストを取得
- ERS サービスが正常に起動したことを要約
重要な注意事項: 以下のプロンプトと応答は短縮されています。完全なプロンプトと Q CLI からの応答を確認するには、この ユースケース 3 – SAP の計画的メンテナンスイベント をダウンロードしてください。
プロンプト: サービスを再起動せずに、SAPDemo SAP アプリケーションの SAP ASCS/ERS クラスターのステータスを確認します。
> I'll check the status of the SAP ASCS/ERS cluster for the SAPDemo SAP application without restarting any services.
?️ Using tool: execute_bash (trusted)
⋮
● I will run the following shell command:
aws ec2 describe-instances --filters "Name=tag:Name,Values=*SAP-FIS-CS*" --query "Reservations[*].Instances[*].[InstanceId,Tags[?Key=='Name'].Value|[0],State.Name,InstanceType,PrivateIpAddress]" --output table
⋮
↳ Purpose: Checking EC2 instances that are part of the SAP cluster
-------------------------------------------------------------------------------------------
| DescribeInstances |
+----------------------+-------------------------+----------+-------------+---------------+
| i-064751ba1b4c8340f | SAP-FIS-CS-sapclnode2 | running | c5a.xlarge | 10.0.155.180 |
| i-0e08f883d5c3b3747 | SAP-FIS-CS-sapclnode1 | running | c5a.xlarge | 10.0.134.80 |
+----------------------+-------------------------+----------+-------------+---------------+
⋮
● Completed in 1.666s
……
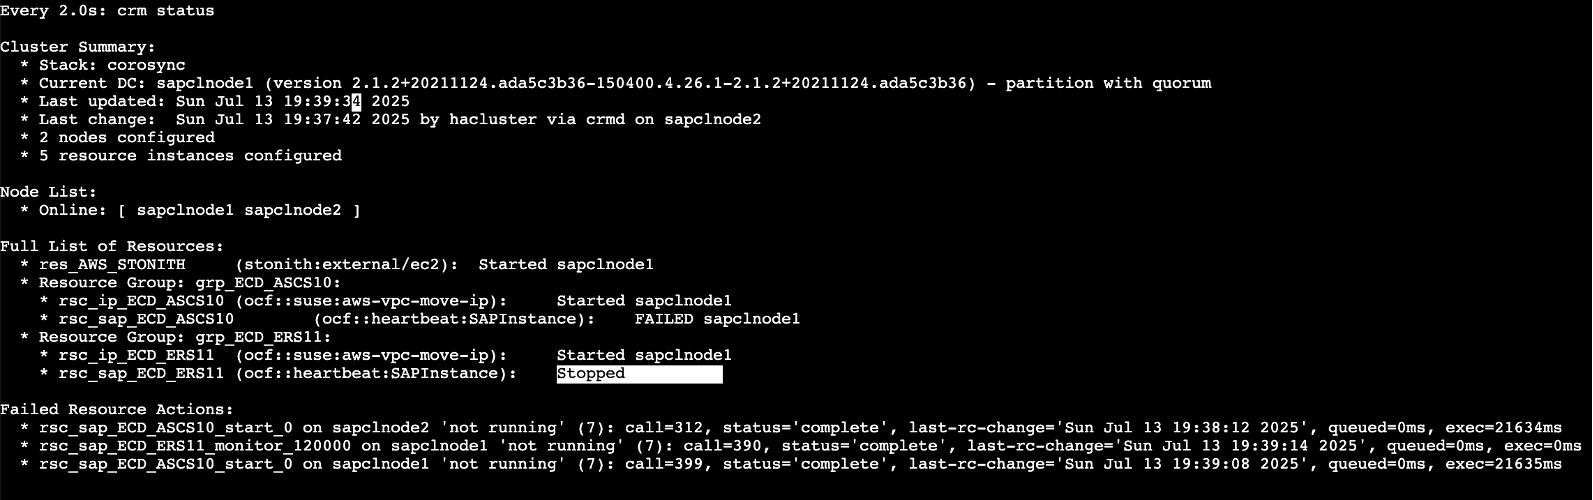
## Conclusion
The SAP ASCS/ERS cluster for the SAPDemo application is partially operational:
• The ASCS instance is running correctly on sapclnode2
• The ERS instance is intentionally disabled (target-role=Stopped in the configuration)
• The virtual IP for ERS is still active on sapclnode1
• Both cluster nodes are online and the cluster has quorum
This configuration appears to be intentional based on the cluster configuration, but it means that enqueue replication is not currently active. In a normal high-availability setup, both ASCS and ERS would be
running to ensure enqueue table replication in case of a failover.次のシナリオでは、CloudWatch MCP Server を使用して pacemaker クラスターログを調査し、SAP ASCS のステータスを判断します。CloudWatch MCP サーバーは、describe_log_groups、analyze_log_groups、execute_log_insights_query などのツールを呼び出して分析を行います。
プロンプト: SAPDemo アプリケーションの SAP ASCS ERS Pacemaker クラスターイベント、アラーム、問題に関連する CloudWatch ログを確認します。
> Check CloudWatch logs related to SAPDemo  application for SAP ASCS ERS Pacemaker cluster events, alarms and issues. only use cloudwatch mcp server for this analysis.

> I'll analyze the CloudWatch logs related to the SAPDemo application for SAP ASCS ERS Pacemaker cluster events, alarms, and issues using only the CloudWatch MCP server.

Let's start by identifying the relevant log groups for the SAPDemo application:


?️  Using tool: describe_log_groups (trusted) from mcp server awslabscloudwatch_mcp_server
 ⋮
 ● Running describe_log_groups with the param:
 ⋮  {
 ⋮    "arguments": {
 ⋮      "log_group_name_prefix": "PACEMAKER",
 ⋮      "region": "us-east-1"
 ⋮    },
 ⋮    "name": "describe_log_groups"
 ⋮  }

 ⋮
 ● Completed in 0.760s


……

### Analysis:

This log data shows that the ERS component (rsc_sap_ECD_ERS11) has been successfully started on sapclnode1. The cluster first cleared previous failure records, then migrated the IP resource (rsc_ip_ECD_ERS11)
from node 2 to node 1, and finally started the ERS service on node 1.

The successful start is confirmed by the @rc-code=0 in the logs, indicating no errors. The monitoring operation is also successful, showing that the service is running properly.

This aligns with our previous findings where we had identified issues with the ERS component and cleared CloudWatch alarms for it. The logs now confirm that the ERS service has been successfully started and is
being monitored by the cluster, which explains why the service is now running despite previous alarms.

Would you like me to analyze any specific aspect of these logs in more detail or provide recommendations for ongoing monitoring of the ERS component?
プロンプト: ノード sapclnode1 で SAP ERS サービスを起動します。
> start SAP ERS services on node sapclnode1

> I'll start the SAP ERS services on node sapclnode1.


?️  Using tool: execute_bash (trusted)
 ⋮
 ● I will run the following shell command:
aws ssm send-command --instance-ids i-0e08f883d5c3b3747 --document-name "AWS-RunShellScript" --parameters 'commands=["sudo crm resource status rsc_sap_ECD_ERS11"]' --output json
 ⋮
 ↳ Purpose: Checking the current status of the ERS resource

..


……

## Conclusion
The SAP ERS services have been successfully started on node sapclnode1. The enqueue replication is now active and functioning correctly, providing high availability for the SAP enqueue service. The cluster is now in a fully operational state with all resources running as expected.
ユースケース 4: SAP の根本原因分析を加速
このシナリオでは、構成エラーにより ERS が障害に遭遇した SAP アプリケーションクラスターがあります。Q CLI と CloudWatch MCP Server の統合により、複雑な SAP ランドスケープにおける従来の診断上の課題が解消されます。問題は多くの場合、複数のシステムレイヤーにわたってカスケードします。Q CLI は次のようにタスクリストを作成しました:
- App Server のステータスを確認するプロンプト
- aws ec2 describe-instances を実行して SAP クラスターステータスを確認
- ssm コマンド crm_mon を実行して ASCS と ERS クラスターを確認
- ssm コマンド sapcontrol を実行してノード 1 と 2 のプロセスリストを取得
- ssm コマンド crm を実行してクラスターリソースステータスとログを確認
- ssm コマンドを実行して pacemaker.log を確認
- ssm コマンド crm を実行してリソースをクリーンアップ
- ssm コマンド crm_mon を実行してクラスターステータスを確認
- ssm コマンド sapcontrol を実行してノード 2 のプロセスリストを取得
- 構成問題による分析結果を要約
- この問題をトラブルシューティングするプロンプトの後
- ssm コマンドを実行してノード 2 の ASCS と ERS の SAP システムログを確認
- ssm コマンドを実行して ASCS と ERS の SAP プロファイルを確認
- ssm コマンドを実行してノード 2 の hosts ファイルのホスト名構成を確認
- ssm コマンドを実行してノード 1 と 2 の IP アドレスを確認
- ssm コマンドを実行してノード 1 と 2 の hosts ファイルを更新
- ssm コマンド crm_mon を実行してリソースをクリーンアップ
- ssm コマンド sapcontrol を実行してノード 2 のプロセスリストを取得
- ssm コマンド sapcontrol を実行して ERS サービスを起動し、ログを確認
- ssm コマンド sapcontrol を実行して ASCS を起動し、ログを確認
- ssm コマンド crm_mon を実行してクラスターを停止し、ステータスを確認
- ssm コマンド crm_mon を実行してクラスターリソースをクリーンアップ
- ssm コマンド crm_mon を実行してクラスターを起動し、待機して確認
- ssm コマンド sapcontrol を実行してノード 1 の ASCS プロセスリストを取得
- ssm コマンド sapcontrol を実行して ASCS サービスを起動し、確認
- 問題を修復するための推奨事項を要約
- SAP ERS サービスを起動するプロンプトの後
- ssm コマンド crm を実行して ASCS と ERS クラスターリソースを停止
- ssm コマンドを実行してノード 1 と 2 の hosts ファイルを検証および更新
- ssm コマンドを実行してノード 1 と 2 のホスト名解決をテスト(最初は更新に失敗したが、別のアプローチで再試行)
- ssm コマンドを実行して ASCS と ERS の SAP プロファイルを確認
- ssm コマンド crm_mon を実行してクラスターリソースをクリーンアップ
- ssm コマンド sapcontrol を実行して SAP ASCS と ERS リソースを起動し、検証
- ASCS と ERS サービスが正常に起動したことを要約
重要な注意事項: 以下のプロンプトと応答は短縮されています。完全なプロンプトと Q CLI からの応答を確認するには、この ユースケース 4 – SAP のRoor Cause Analytics を加速 をダウンロードしてください。
プロンプト: SAP アプリケーション SAPDemo の SAP ASCS ERS クラスターノードの現在のステータスは何ですか。
> what is the current status of SAP ASCS ERS cluster nodes for sap application SAPDemo.

> I'll check the current status of the SAP ASCS/ERS cluster nodes for the SAPDemo SAP application.


?️  Using tool: execute_bash (trusted)
 ⋮
 ● I will run the following shell command:
aws ec2 describe-instances --filters "Name=tag:Name,Values=*SAP-FIS-CS*" --query "Reservations[*].Instances[*].[InstanceId,Tags[?Key=='Name'].Value|[0],State.Name,InstanceType,PrivateIpAddress]" --output table
 ⋮
 ↳ Purpose: Checking EC2 instances that are part of the SAP cluster

-------------------------------------------------------------------------------------------
|                                    DescribeInstances                                    |
+----------------------+-------------------------+----------+-------------+---------------+
|  i-064751ba1b4c8340f |  SAP-FIS-CS-sapclnode2  |  running |  c5a.xlarge |  10.0.155.180 |
|  i-0e08f883d5c3b3747 |  SAP-FIS-CS-sapclnode1  |  running |  c5a.xlarge |  10.0.134.80  |
+----------------------+-------------------------+----------+-------------+---------------+

 ⋮
 ● Completed in 1.815s


……..

## Current State Summary

The SAP ASCS/ERS cluster for SAPDemo is currently in a degraded state:
• The cluster infrastructure (corosync/pacemaker) is functioning correctly with quorum
• Both nodes are online and communicating
• The virtual IP addresses for both ASCS and ERS are properly assigned
• However, the actual SAP services (ASCS and ERS) are failing to start
• The application servers are showing YELLOW status, likely due to their dependency on the central services

This indicates a problem with the SAP services themselves rather than with the cluster infrastructure. The services may be failing to start due to configuration issues, file system problems, or other SAP-specific issues that need to be investigated further.
プロンプト: この問題のトラブルシューティングを手伝ってください。
> help me troubleshoot this problem

> I'll help you troubleshoot the issues with the SAP ASCS/ERS cluster for the SAPDemo application. Based on the current state, both the ASCS and ERS services are failing to start properly, even though the
cluster infrastructure itself is functioning correctly.

Let's take a systematic approach to troubleshooting:

## Step 1: Check SAP-specific error logs

First, let's check the SAP system logs to understand why the services are failing to start:


?️  Using tool: execute_bash (trusted)
 ⋮
 ● I will run the following shell command:
aws ssm send-command --instance-ids i-064751ba1b4c8340f --document-name "AWS-RunShellScript" --parameters 'commands=["sudo su - ecdadm -c \"tail -50 /usr/sap/ECD/ASCS10/work/dev_ms\""]' --output json
 ⋮
 ↳ Purpose: Checking SAP system logs for ASCS on node 2

..

> Now let's check the ERS logs:

……..

> Based on my troubleshooting, I've identified the root cause of the issues with your SAP ASCS/ERS cluster and can provide you with a comprehensive solution:

# SAP ASCS/ERS Cluster Troubleshooting Report

## Root Cause Analysis

After thorough investigation, I've identified that the primary issue is related to hostname resolution. The error message MsSInit: NihostToAddr rc=(NIEHOST_UNKNOWN) in the ASCS logs clearly indicates that the
Message Server cannot resolve its hostname.

### Specific Issues Identified:

1. Hostname Resolution Problems:
   • The SAP profiles are configured to use the hostnames ecdascsnode and ecdersnode, but these hostnames were not properly defined in the /etc/hosts files on both nodes.
   • We've updated the hosts files, but the SAP services are still failing to start properly.

2. IP Address Configuration:
   • The virtual IPs (192.168.48.201 for ASCS and 192.168.48.202 for ERS) are not being properly managed by the cluster.
   • Both virtual IPs are currently assigned to node 1 (sapclnode1), which is causing conflicts.

3. SAP Profile Configuration:
   • The SAP profiles are using hostnames that don't match the actual hostnames of the cluster nodes.
   • The ERS service is trying to connect to the ASCS service but failing with "Connection refused" errors.
プロンプト: 上記のソリューションを適用して問題を修正します。
> apply the above solution to fix the problem

> I'll apply the solution to fix the SAP ASCS/ERS cluster issues. Let's follow the step-by-step plan:

## Step 1: Stop the cluster resources

> I need to use SSM to execute these commands on the cluster nodes:


?️  Using tool: execute_bash (trusted)
 ⋮
 ● I will run the following shell command:
aws ssm send-command --instance-ids i-0e08f883d5c3b3747 --document-name "AWS-RunShellScript" --parameters 'commands=["sudo crm resource stop rsc_sap_ECD_ASCS10 && sudo crm resource stop rsc_sap_ECD_ERS11"]' --output json
 ⋮
 ↳ Purpose: Stopping the cluster resources using SSM

..

> ## Step 2: Verify the hosts file configuration on both nodes


……

> Great! The solution has been successfully applied and the SAP ASCS/ERS cluster is now working correctly. Here's a summary of what we did:

## Summary of the Fix

1. Fixed Hostname Resolution:
   • Updated the /etc/hosts files on both nodes with the correct mappings for all hostnames.
   • Verified that hostname resolution was working correctly by pinging the virtual hostnames.

2. Cleaned Up and Restarted Cluster Resources:
   • Stopped the cluster resources to ensure a clean state.
   • Cleaned up any failed resource actions.
   • Started the resources in the correct order: ASCS first, then ERS.

3. Verified the Services:
   • Confirmed that both the ASCS and ERS services are now running correctly.
   • The system instance list shows all components are GREEN (running).

## Current Status

• **Cluster Status**: All resources are running correctly.
• **ASCS Status**: The Message Server and Enqueue Server are both running on node 2 (sapclnode2).
• **ERS Status**: The Enqueue Replication Server is running on node 1 (sapclnode1).
• **Virtual IPs**: The virtual IPs are correctly assigned to the appropriate nodes.

## Recommendations for Long-term Stability

1. Regular Monitoring: Set up monitoring for the cluster to detect any issues early.
2. Failover Testing: Regularly test failover scenarios to ensure the cluster works correctly.
3. Documentation: Document the cluster configuration and troubleshooting steps for future reference.
4. DNS Resolution: Consider implementing proper DNS resolution instead of relying on /etc/hosts files.

The SAP ASCS/ERS cluster for the SAPDemo application is now functioning correctly. The issue was primarily related to hostname resolution, which we've fixed by properly configuring the hosts files on both nodes.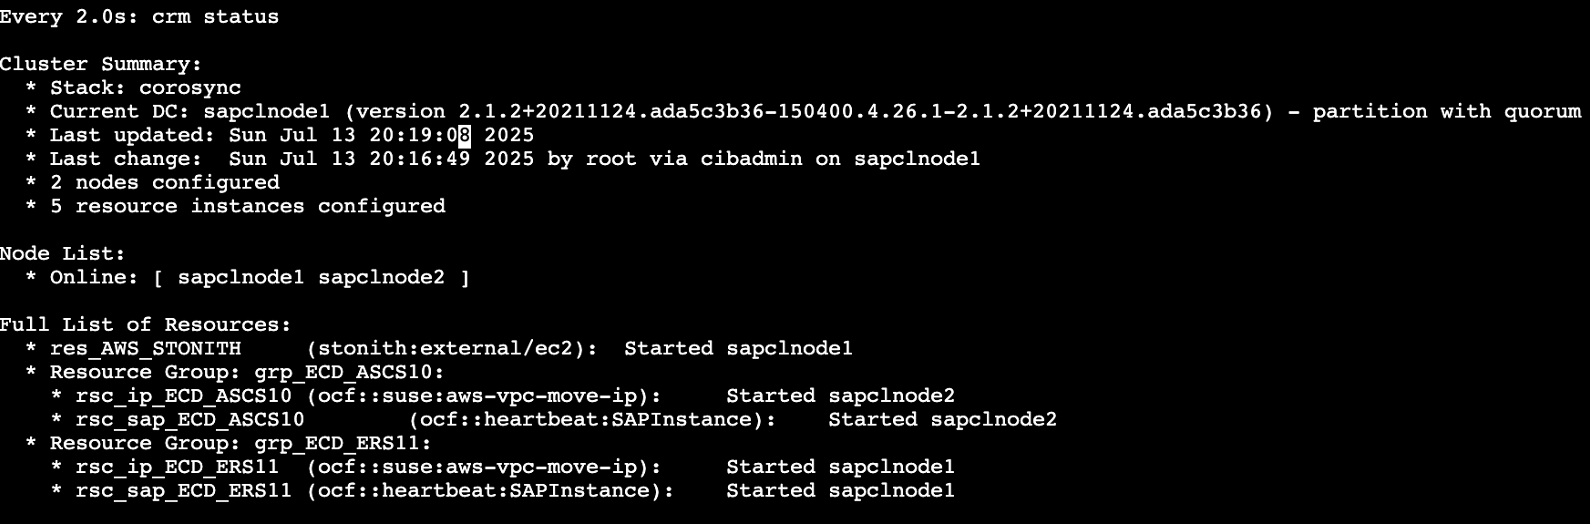
コスト考慮事項
このソリューションを実装するには、以下を考慮する必要があります:
- Amazon Q CLI の価格はこのリンクに反映されています。月あたり 1,000 のエージェントリクエストを含む Pro バージョン(ユーザーあたり月額 $19)を少なくとも推奨します。
- Amazon CloudWatch の価格はこのリンクに反映されています。このテストでは、無料利用枠で十分であると想定しています。
- AWS Systems Manager の価格はこのリンクに反映されています。HA テストでは、最低 6 ノードを管理すると想定でき、$0.01137 * 6 * 8 時間 = $3.27456 となります。
- Amazon CloudWatch MCP Server の使用に追加コストはありません。
- us-east-1 で SAP Netweaver の HA をセットアップするコストは以下のように見積もられます:
- 2 x m5.large = $148.16(ASCS と ERS)
- 2 x m5.xlarge = $280.32(2 つのアプリケーションサーバー)
- 2 x r5.2xlarge = $756.32(SAP HANA プライマリとセカンダリ)
- 推定総コスト = $19 + $3.27456 + $39.4933 = $61.76786(1 日のテスト)
まとめ
CloudWatch MCP Server は、クライアント環境で SAP ランドスケープ全体にわたる統一された可視性を提供します。SAP アプリケーションログ、SAP HANA メトリクス、AWS EC2 パフォーマンスデータを統合します。システムは SAP コンポーネント全体でメトリクスを自動的に相関させます。Q CLI は、この豊富なデータセットとの自然言語インタラクションを可能にすることでこれを補完し、チームがダイアログ応答時間を簡単に調査したり、HANA メモリ消費パターンを比較したり、パフォーマンス問題中に待機状態の SAP ワークプロセスを特定したりできるようにします。
CloudWatch MCP Server は、システムログとトランザクション障害のパターンを分析して異常を特定することで、複雑な SAP インシデントのトラブルシューティングに役立ちます。インフラストラクチャアラートとアプリケーション動作を相関させます。さらに、過去の類似インシデントからの履歴コンテキストを提供します。Q CLI は、SAP エラーコードを解釈し、観察されたパターンに基づいて診断コマンドを生成し、根本原因を提案し、より深い調査のための関連する SAP トランザクションコードを推奨することで、この機能を強化します。
この統合は、SAP システムの共有運用ビューを作成し、SAP 用語と AWS 概念の間を翻訳することで、SAP BASIS 管理者と AWS インフラストラクチャチーム間の知識ギャップを埋めます。この組み合わせにより、コンテキストの切り替えを排除し、SAP 固有のパターンのインテリジェントな分析を提供し、監視データとの自然言語インタラクションを可能にすることで、平均解決時間が短縮され、インシデント解決の高速化、信頼性の向上、AWS 上のミッションクリティカルな SAP ワークロードのより効率的な運用が実現されます。
次のステップとして、このソリューションを試してみてください。このソリューションにより、少なくとも 6 倍の生産性を達成できます。Amazon CloudWatch、AWS Model Context Protocol Servers、Amazon Q for command line に関する今後のイノベーションにご期待ください。
SAP on AWS ディスカッションに参加
お客様のアカウントチームと AWS サポートチャネルに加えて、最近 re:Post – AWS コミュニティのための再構想された Q&A エクスペリエンスを開始しました。AWS for SAP ソリューションアーキテクチャチームは、お客様とパートナーを支援するために回答できるディスカッションや質問について、AWS for SAP トピックを定期的に監視しています。サポート関連でない質問がある場合は、re:Post でのディスカッションに参加し、コミュニティナレッジベースに追加することを検討してください。
謝辞
次のチームメンバーの貢献に感謝します:Sreenath Middhi、および Adam Hill。
タグ
#SAP Netweaver,
AWS Systems Manager,
CloudWatch,
SAP,
SAP High Availability
本ブログは Amazon Q Developer CLI による機械翻訳を行い、パートナー SA 松本がレビューしました。原文はこちらです。