Whether it's receiving detailed cache statistics reports, monitoring your CloudFront usage, getting a list of your most popular objects or setting near real-time alarms on operational metrics, Amazon CloudFront offers a variety of solutions for your reporting needs. You can access all our reporting options by visiting the Amazon CloudFront Reporting & Analytics dashboard in the AWS Management Console.
You can also choose to receive even more information about the traffic delivered by your Amazon CloudFront distribution by enabling CloudFront access logs.
Amazon CloudFront Usage Charts
Track Trends in Requests & Data Transfer
You can view your Amazon CloudFront usage with CloudFront Usage Charts, six charts in the AWS Management Console. You can use the charts to track trends in data transfer and requests (both HTTP and HTTPS) for each of your active CloudFront Web distributions. The charts show your usage from each CloudFront region at daily or hourly granularity, going back up to 60 days, and they also include totals, average, and peak usage during the time interval selected.
These charts include: Number of HTTP/S Requests, Data Transferred over HTTP/S, Data Transferred from CloudFront Edge Locations to Your Users, and Data Transferred from CloudFront to Your Origin.
There are no additional charges for CloudFront Usage Charts. To view the reports, simply navigate to the AWS Management Console, navigate to Amazon CloudFront and select Usage Charts under the Reports and Analytics link in the navigation pane.


Amazon CloudFront monitoring & alarms via Amazon CloudWatch
Monitor, Alarm and Receive Notifications in Near Real-Time
You can monitor, alarm and receive notifications on the operational performance of your Amazon CloudFront distributions within a few minutes of viewer requests using Amazon CloudWatch, giving you more visibility into the overall health of your web application. CloudFront automatically publishes six operational metrics, each at 1-minute granularity, into Amazon CloudWatch. You can then use CloudWatch to set alarms on any abnormal patterns in your CloudFront traffic.
These metrics include: Requests, Bytes Downloaded, Bytes Uploaded, 4xx Error Rate, 5xx Error Rate and Total Error Rate. These are automatically provided to all CloudFront customers at no additional costs. Alarming is billed at standard CloudWatch rates.
Learn more about monitoring CloudFront activity using CloudWatch »


Amazon CloudFront Cache Statistics Report
Detailed Cache Statistics About Your Content
The cache statistics charts show your usage from each viewer continent at daily or hourly granularity, going back up to 60 days, and also include totals, average, and peak usage during the time interval selected.
The Cache Statistics charts include: Total Requests, Percentage of Viewer Requests by Result Type, Bytes Transferred to Viewers, HTTP Status Codes, and Percentage of GET Requests that Didn't Finish Downloading.
There are no additional charges for the Cache Statistics reports. To view the reports, simply navigate to the AWS Management Console, navigate to Amazon CloudFront and select Cache Statistics under the Reports and Analytics link in the navigation pane.


Amazon CloudFront Popular Objects report
Track Your Most Popular Objects
The Popular Objects Report shows request count, cache hit and cache miss counts, as well as error rates for the 50 most popular objects during the specified period. This helps you understand which content is most popular among your viewers, or identify any issues (such as high error rates) with your most requested objects.
There are no additional charges for the Popular Objects Report. To view the reports, simply navigate to the AWS Management Console, navigate to Amazon CloudFront and select Popular Objects under the Reports and Analytics link in the navigation pane.

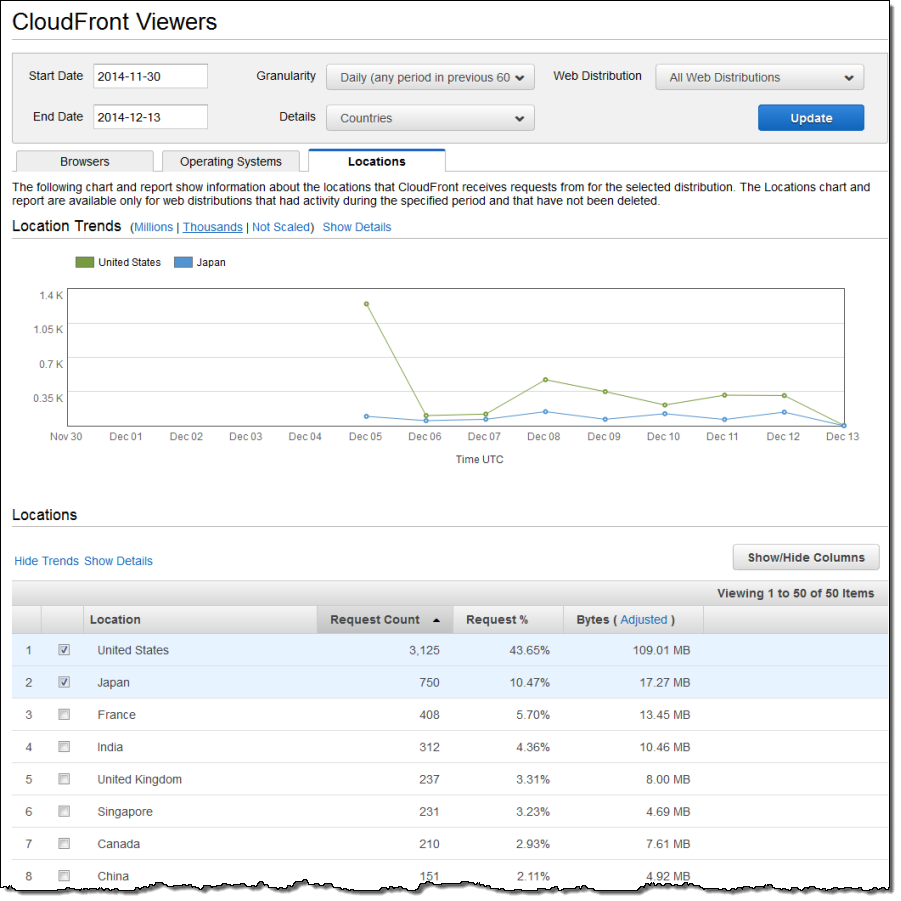
Amazon CloudFront Viewers report
Learn more about your end users
The Viewers Report shows the countries where your end users are located as well as the browsers, devices, and operating systems they use. For all these reports you can also display the trend over time. The Viewer Reports include the following:
- Locations: shows the top 50 countries where your end users are accessing the content that you are distributing using Amazon CloudFront. You can also use the report to see the states and territories for end users in the United States.
- Browsers: shows the top 10 browsers that your end users are using to access your content. The report shows the top 10 browsers by name, or by name and version.
- Operating system: shows the top 10 operating system that your end users are accessing your content from. The report shows the top 10 version by name, or by name and version.
- Devices: shows you how many requests come from mobile, tablets, desktops, and smart TVs during a specified time period.
The Browsers, Devices, and Operating Systems reports are available as bar charts or pie charts, and you can display trends over time for all four reports. You can display all four reports for any date range in the previous 60 days. For the Locations report, you can also display the report with hourly data points for date ranges spanning up to 14 days.
There are no additional charges for the Viewers Report. To display the reports, simply navigate to the AWS Management Console, navigate to Amazon CloudFront, and click the Viewers link under the Reports and Analytics section in the navigation pane.


Amazon CloudFront Top Referrer report
See which domains referred end users to your website
The Top Referrers report shows you the top 25 domains that referred viewers to your website. These top referrers can be search engines, other websites that link directly to your objects, or your own website. You can display the Top Referrers report for any date range in the previous 60 days.
There are no additional charges for the Top Referrers report. To view the reports, simply navigate to the AWS Management Console, navigate to Amazon CloudFront, and click the Top Referrers link under the Reports and Analytics section in the navigation pane.

Amazon CloudFront Access Logs
Enable CloudFront Logs to Learn More About Your Traffic
Cloudfront generates logs that provide detailed information about every request it receives and responds to. These logs are effectively equivalent to Web Server logs and are delivered in the same W3C format, but also contain additional CloudFront specific data. CloudFront logs can be very useful for exploring performance and usage trends and in isolating potential errors or configuration optimizations.
CloudFront provides two ways to log the requests that are delivered from your distributions: Standard logs and Real-time logs.
CloudFront standard logs are delivered to the Amazon S3 bucket of your choice (log records are delivered within minutes of a viewer request). When enabled, CloudFront will automatically publish detailed log information in a W3C extended format into an Amazon S3 bucket that you specify. Access logs contain detailed information about each request for your content, including the object requested, the date and time of the request, the edge location serving the request, the client IP address, the referrer, the user agent, the cookie header, and the result type (for example, cache hit, or miss, or error). CloudFront doesn’t charge for standard logs, though you incur Amazon S3 charges for storing and accessing the log files.
CloudFront real-time logs are delivered to the data stream of your choice in Amazon Kinesis Data Streams (log records are delivered within seconds of a viewer request). You can choose the sampling rate for your real-time logs—that is, the percentage of requests for which you want to receive real-time log records. You can also choose the specific fields that you want to receive in the log records. CloudFront real-time logs contain all the same data-points as the standard logs and also contain certain additional information about each request, such as viewer request headers and country code, in a W3C extended format. CloudFront charges for real-time logs, in addition to the charges you incur for using Kinesis Data Streams.

As part of the AWS Free Usage Tier, you can get started with Amazon CloudFront for free. Upon sign-up, new AWS customers receive 50 GB Data Transfer Out and 2,000,000 HTTP and HTTPS Requests each month for one year.