AWS Cloud Financial Management
Automating Multi-Cloud Cost Management at Scale: A2A’s FinOps Platform Powered by AWS
Discover how A2A built a FinOps platform powered by AWS that normalizes multi-cloud cost data, enabling the company to identify cost savings and reduce manual budget consolidation time. You will learn about the architectural decisions, dashboards implemented, and transferable lessons for implementing your own multi-cloud cost management solution.
Listed on the Italian Stock Exchange, with around 15,000 employees, A2A is the first player in Italy in the circular economy and district heating sectors, and the second-largest national energy operator for installed capacity and electricity distributed. The Group manages the generation, sale and distribution of energy, the sale and distribution of gas, district heating, waste cycle, electric mobility and smart services for cities, public lighting, and the integrated water service. A2A’s strategy is based on two pillars: circular economy and energy transition, underpinned by a €23 billion investment plan to 2035, which combines sustainable value creation, decarbonization, innovation, and a contribution to the country’s energy independence.
A2A’s diversified organizational structure demands a wide variety of IT and cloud solutions supported by a multi-cloud environment across AWS, Azure, and Google Cloud. In addition to this complexity, A2A is migrating 55% of its on-premises applications, approximately 300 apps and 1,600 servers, to the cloud. As cloud adoption expands, the company has moved from a showback to a chargeback model, strengthening financial accountability and providing actionable visibility into cloud spending by business unit. Managing this across three cloud providers with different billing formats and no unified view was becoming unsustainable. To address these challenges, A2A designed an integrated FinOps ecosystem capable of normalizing 100% of its multi-cloud cost and usage data.
This blog post walks you through how A2A built a unified FinOps platform based on the FinOps Open Cost and Usage Specification (FOCUS) data model and powered by AWS serverless services.
Designing and Building A2A’s FinOps Dashboard Ecosystem
A2A chose AWS as the foundation for two reasons: first, AWS serverless analytics services provide a fully managed, pay-per-use stack that eliminates infrastructure overhead and simplifies operations. Second, the AWS Cloud Intelligence Dashboards (CID) offer a production-ready starting point with proven cost analysis patterns, allowing teams to deliver value quickly and iterate rather than building from scratch. A2A used the CID as a foundation, extending it to meet the organization’s broader requirements:
- Adapting to business unit structure for internal reporting and accountability alignment
- Supporting multi-cloud data from AWS, Azure, and Google Cloud
- Adopting FOCUS as the standard data model
- Developing role-based dashboards for executives, application owners, and FinOps administrators
- Implementing automated, end-to-end data pipelines
Rather than building custom ETL logic for each cloud provider, A2A adopted FOCUS, an open standard defining a common schema for multi-cloud cost data. This decision reduced development time, future-proofed the architecture (FOCUS maintainers handle provider billing format changes), and enabled vendor-neutral analysis – for example, comparing “compute costs” across Amazon Elastic Compute Cloud (Amazon EC2), Azure VMs, and GCP Compute Engine using identical metrics.
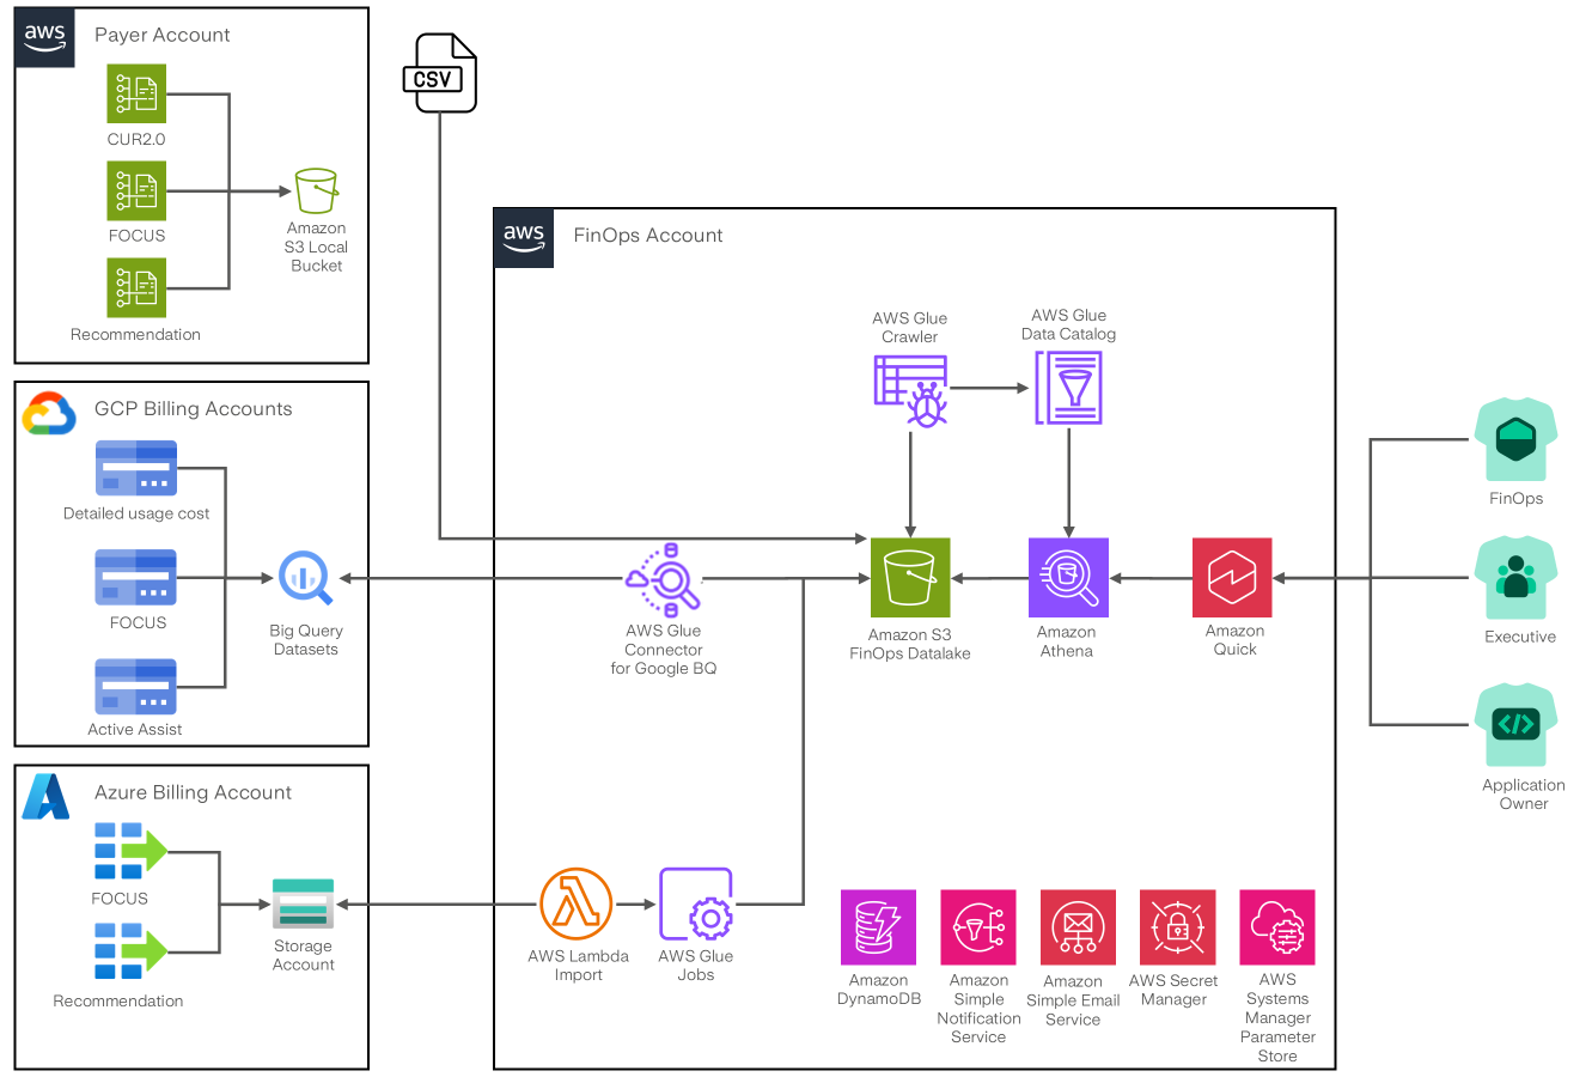
Figure 1: A2A’s AWS-powered serverless architecture for ingesting, normalizing, and analyzing multi-cloud cost data across AWS, Azure, and Google Cloud using the FOCUS data model.
As shown in Figure 1, cost data is ingested from three sources into Amazon Simple Storage Service (S3):
- AWS: FOCUS-compliant AWS Cost & Usage Reports exported at payer account level
- Google Cloud: BigQuery billing exports ingested via AWS Glue connectors
- Azure: Storage Account exports imported through event-driven AWS Lambda functions
AWS Glue ETL jobs transform data to FOCUS standard, and Amazon Athena queries the curated datasets through custom SQL views. Amazon Quick delivers role-based dashboards using AWS Secrets Manager and AWS Systems Manager Parameter Store for secure configuration, Amazon DynamoDB for metadata tracking, and Amazon Simple Notification Service and Amazon Simple Email Service for notifications. Serverless design removed infrastructure and operations overhead for managing multi-cloud cost data across 300+ applications.
Multi-cloud Consumption Dashboard
A2A developed a Multi-cloud Consumption Dashboard designed to give stakeholders a consolidated, self‑service view of their cloud spending across AWS, Azure, and Google Cloud. This capability plays a central role in making cost insights accessible, transparent, and consistent across the organization. By leveraging the FOCUS standard for data normalization, the dashboard presents consistent cost metrics regardless of the cloud provider, enabling direct comparison and analysis. The dashboard includes three role-based views:
1. Forecast
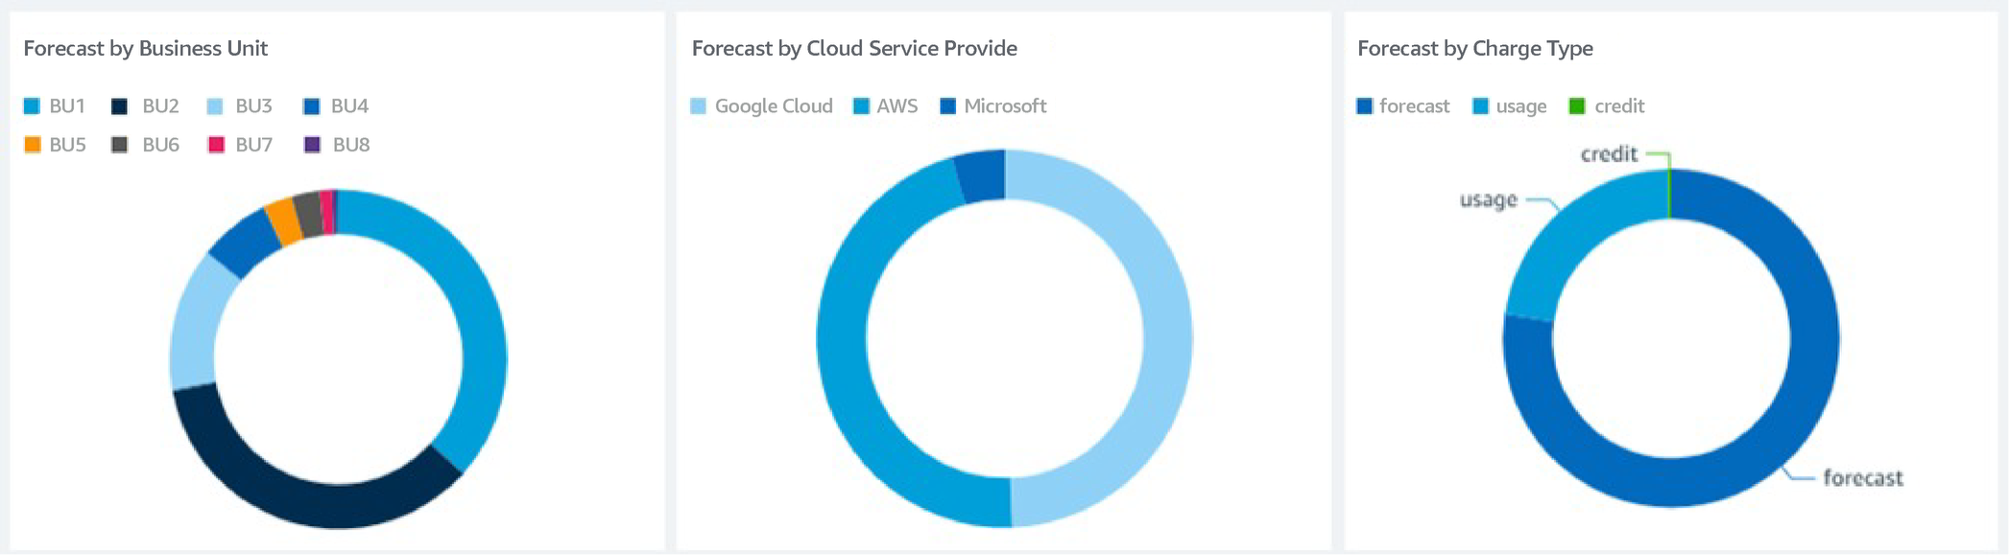
Figure 2: Forecast dashboard for executive and finance leadership stakeholders, providing a unified view across Business Units, Cloud Service Provider and charge type.
A2A built this forecast view to give executives a single, cross-cloud view of past, current, and projected spend on budget planning. Previously, finance teams spent several days each month manually consolidating exports from three separate cloud consoles into spreadsheets. By replacing this process with a unified dashboard, A2A reduced budget review effort by up to 40% – cutting the process from several days to a few hours and freeing teams to focus on analysis and strategic decision-making rather than data gathering.
2. Cloud Cost Overview
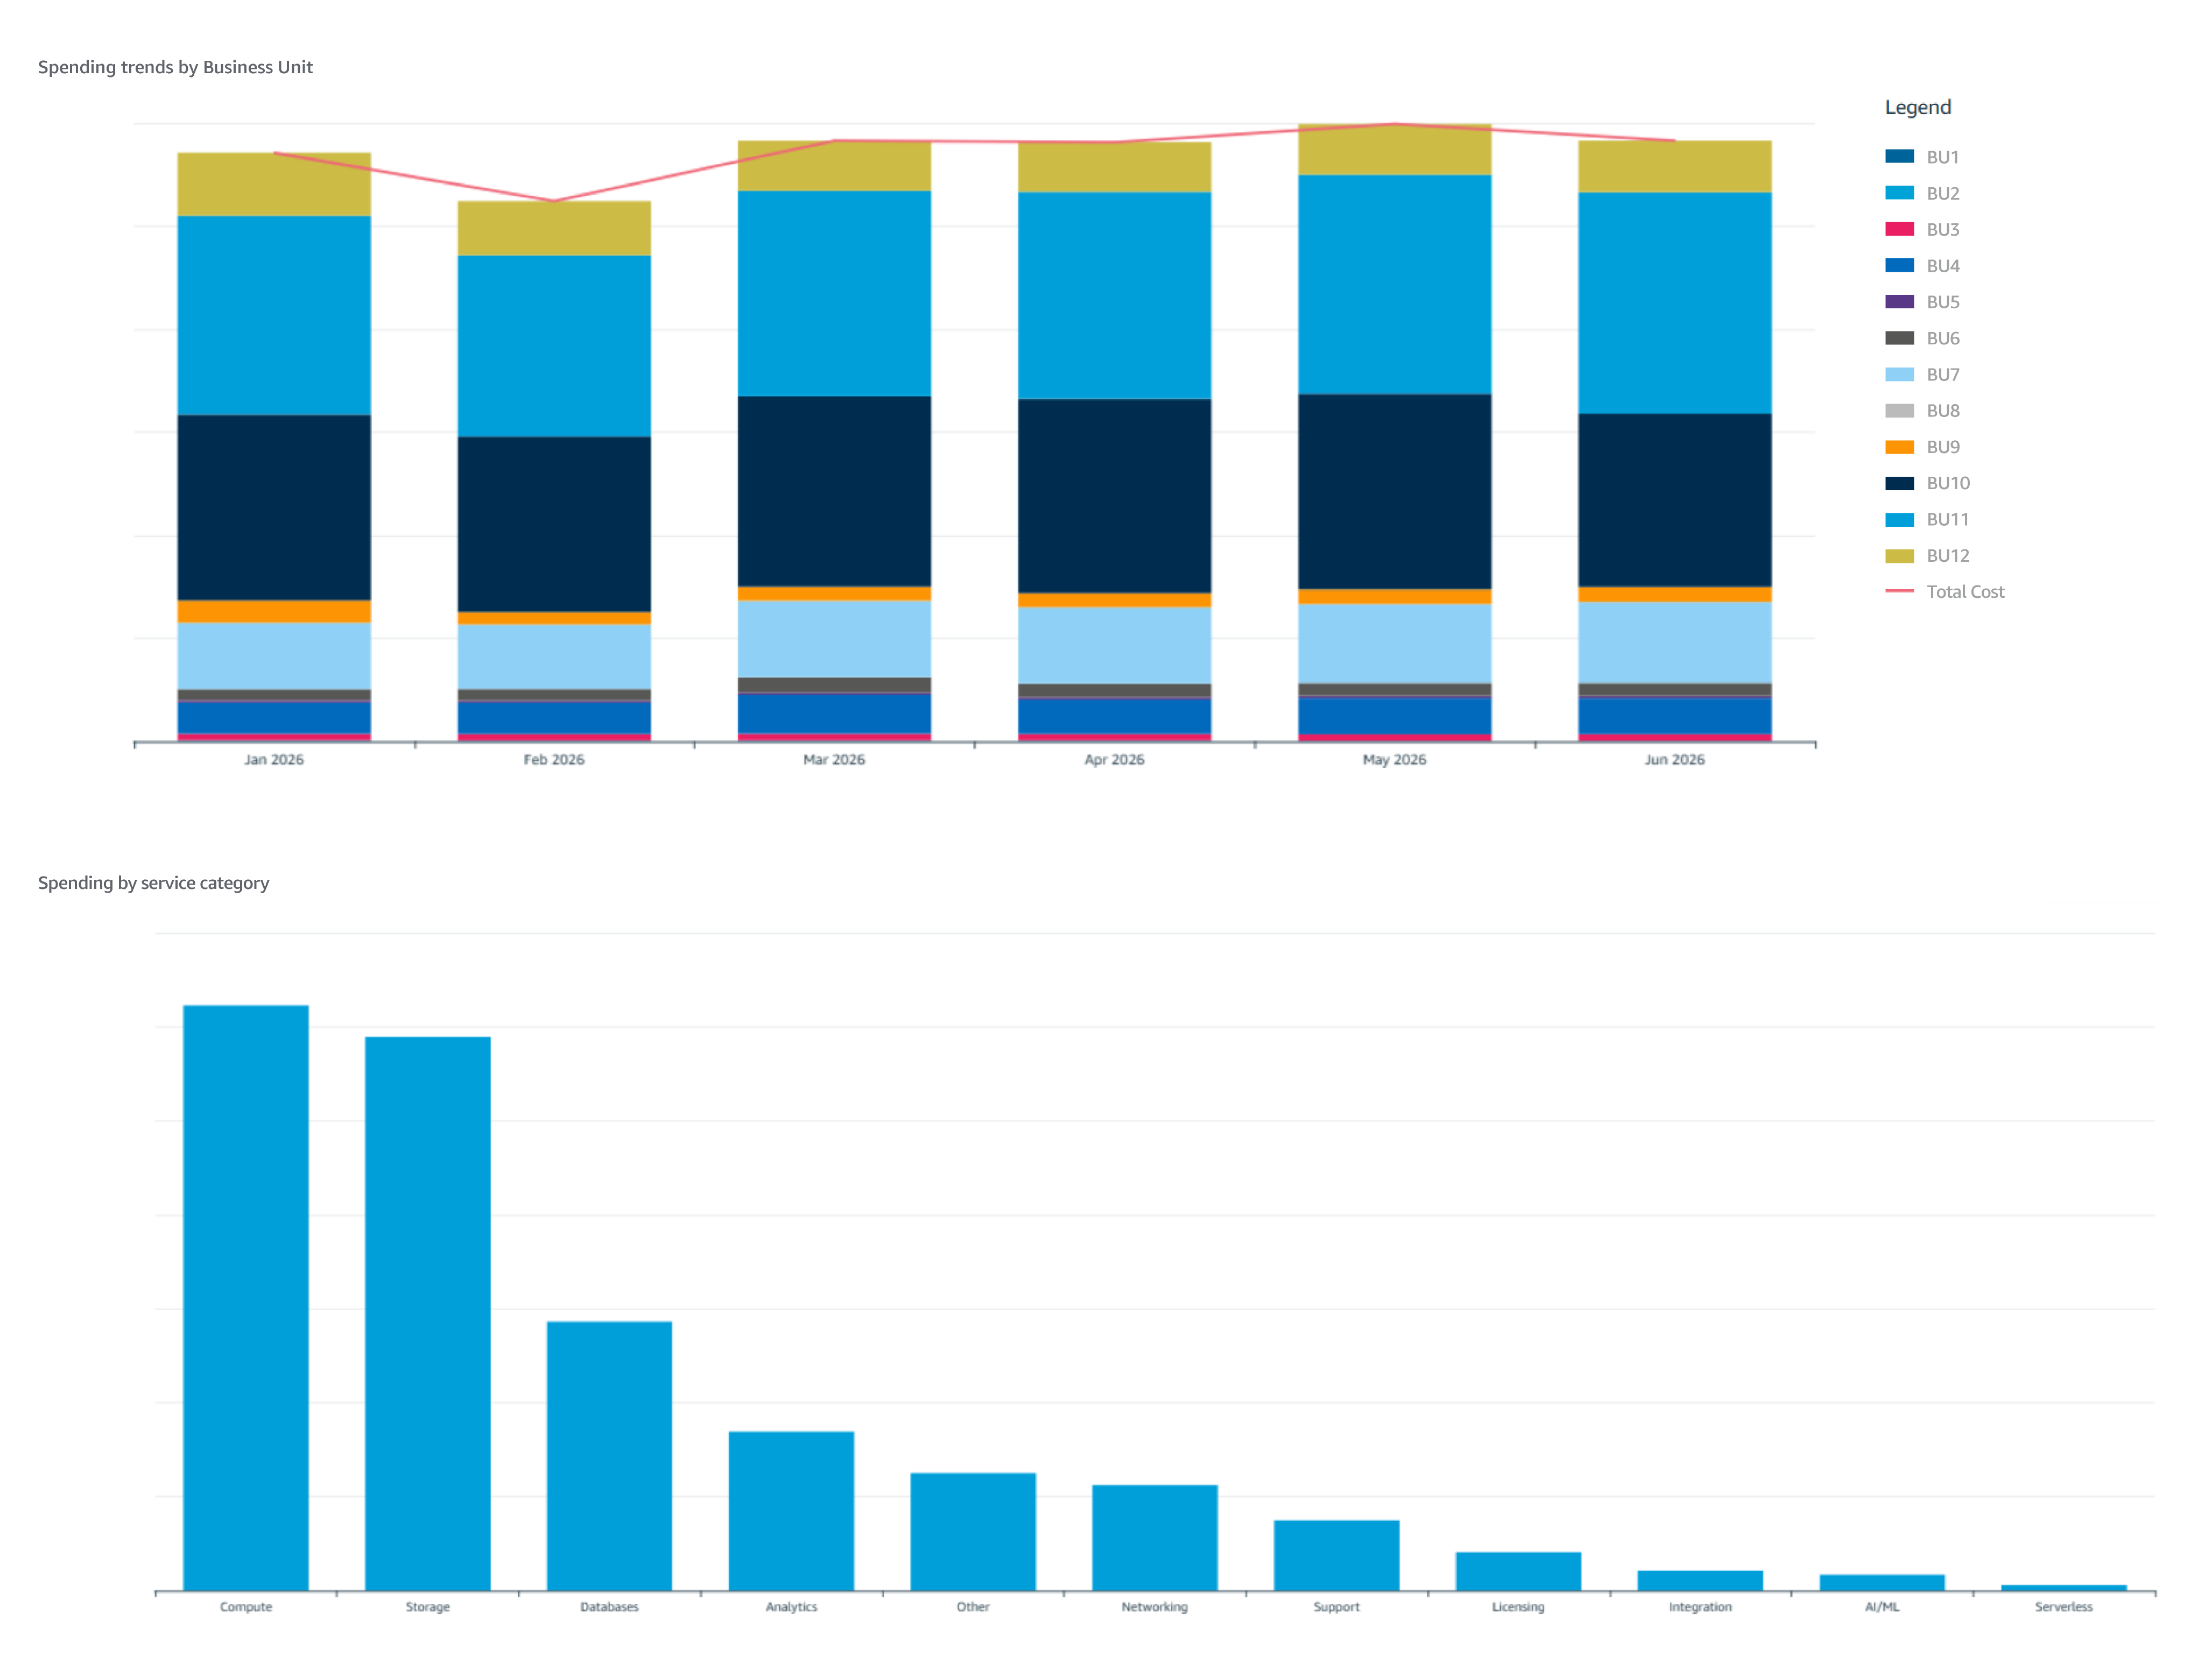
Figure 3: Executive dashboard showing cloud cost trends by Business Unit and the distribution of total spending across service categories.
A2A created this executive overview to show where cloud spend is distributed across providers and service categories, giving leaders a clearer basis for strategic decisions. Instead of switching between three cloud consoles – each with different cost taxonomies, billing cycles, and naming conventions – A2A built a single, unified view that makes multi-cloud consumption easier to interpret and compare. This also allowed the company to tailor the dashboard to its own organizational model, including analysis by Business Unit, so stakeholders can see cloud costs in a structure that better reflects how A2A manages accountability and decision-making.
3. Cloud Spending Details
A2A designed a dedicated view for application owners so they can analyze cloud costs using the same workload structures they manage every day, making it easier to trace spending back to the services and environments that generate it. This helps teams move from generic cost visibility to actionable optimization. In one case, the dashboard showed that logging services represented nearly 80% of production costs for an application, allowing the team to investigate configuration choices, reduce unnecessary log volumes, and lower spending while preserving the operational visibility required to run the workload safely.
Anomaly detection
Without centralized monitoring, cost anomalies in one cloud provider could go unnoticed for days, surfacing only at month-end reconciliation. A2A built an anomaly detection view to monitor unexpected spend across AWS, Azure, and Google Cloud through a single operational lens. This gives FinOps teams a faster way to assess financial impact, focus investigations on the most relevant issues, and refine thresholds over time so detection stays effective as usage patterns change.
Optimization Opportunities & Savings Tracking
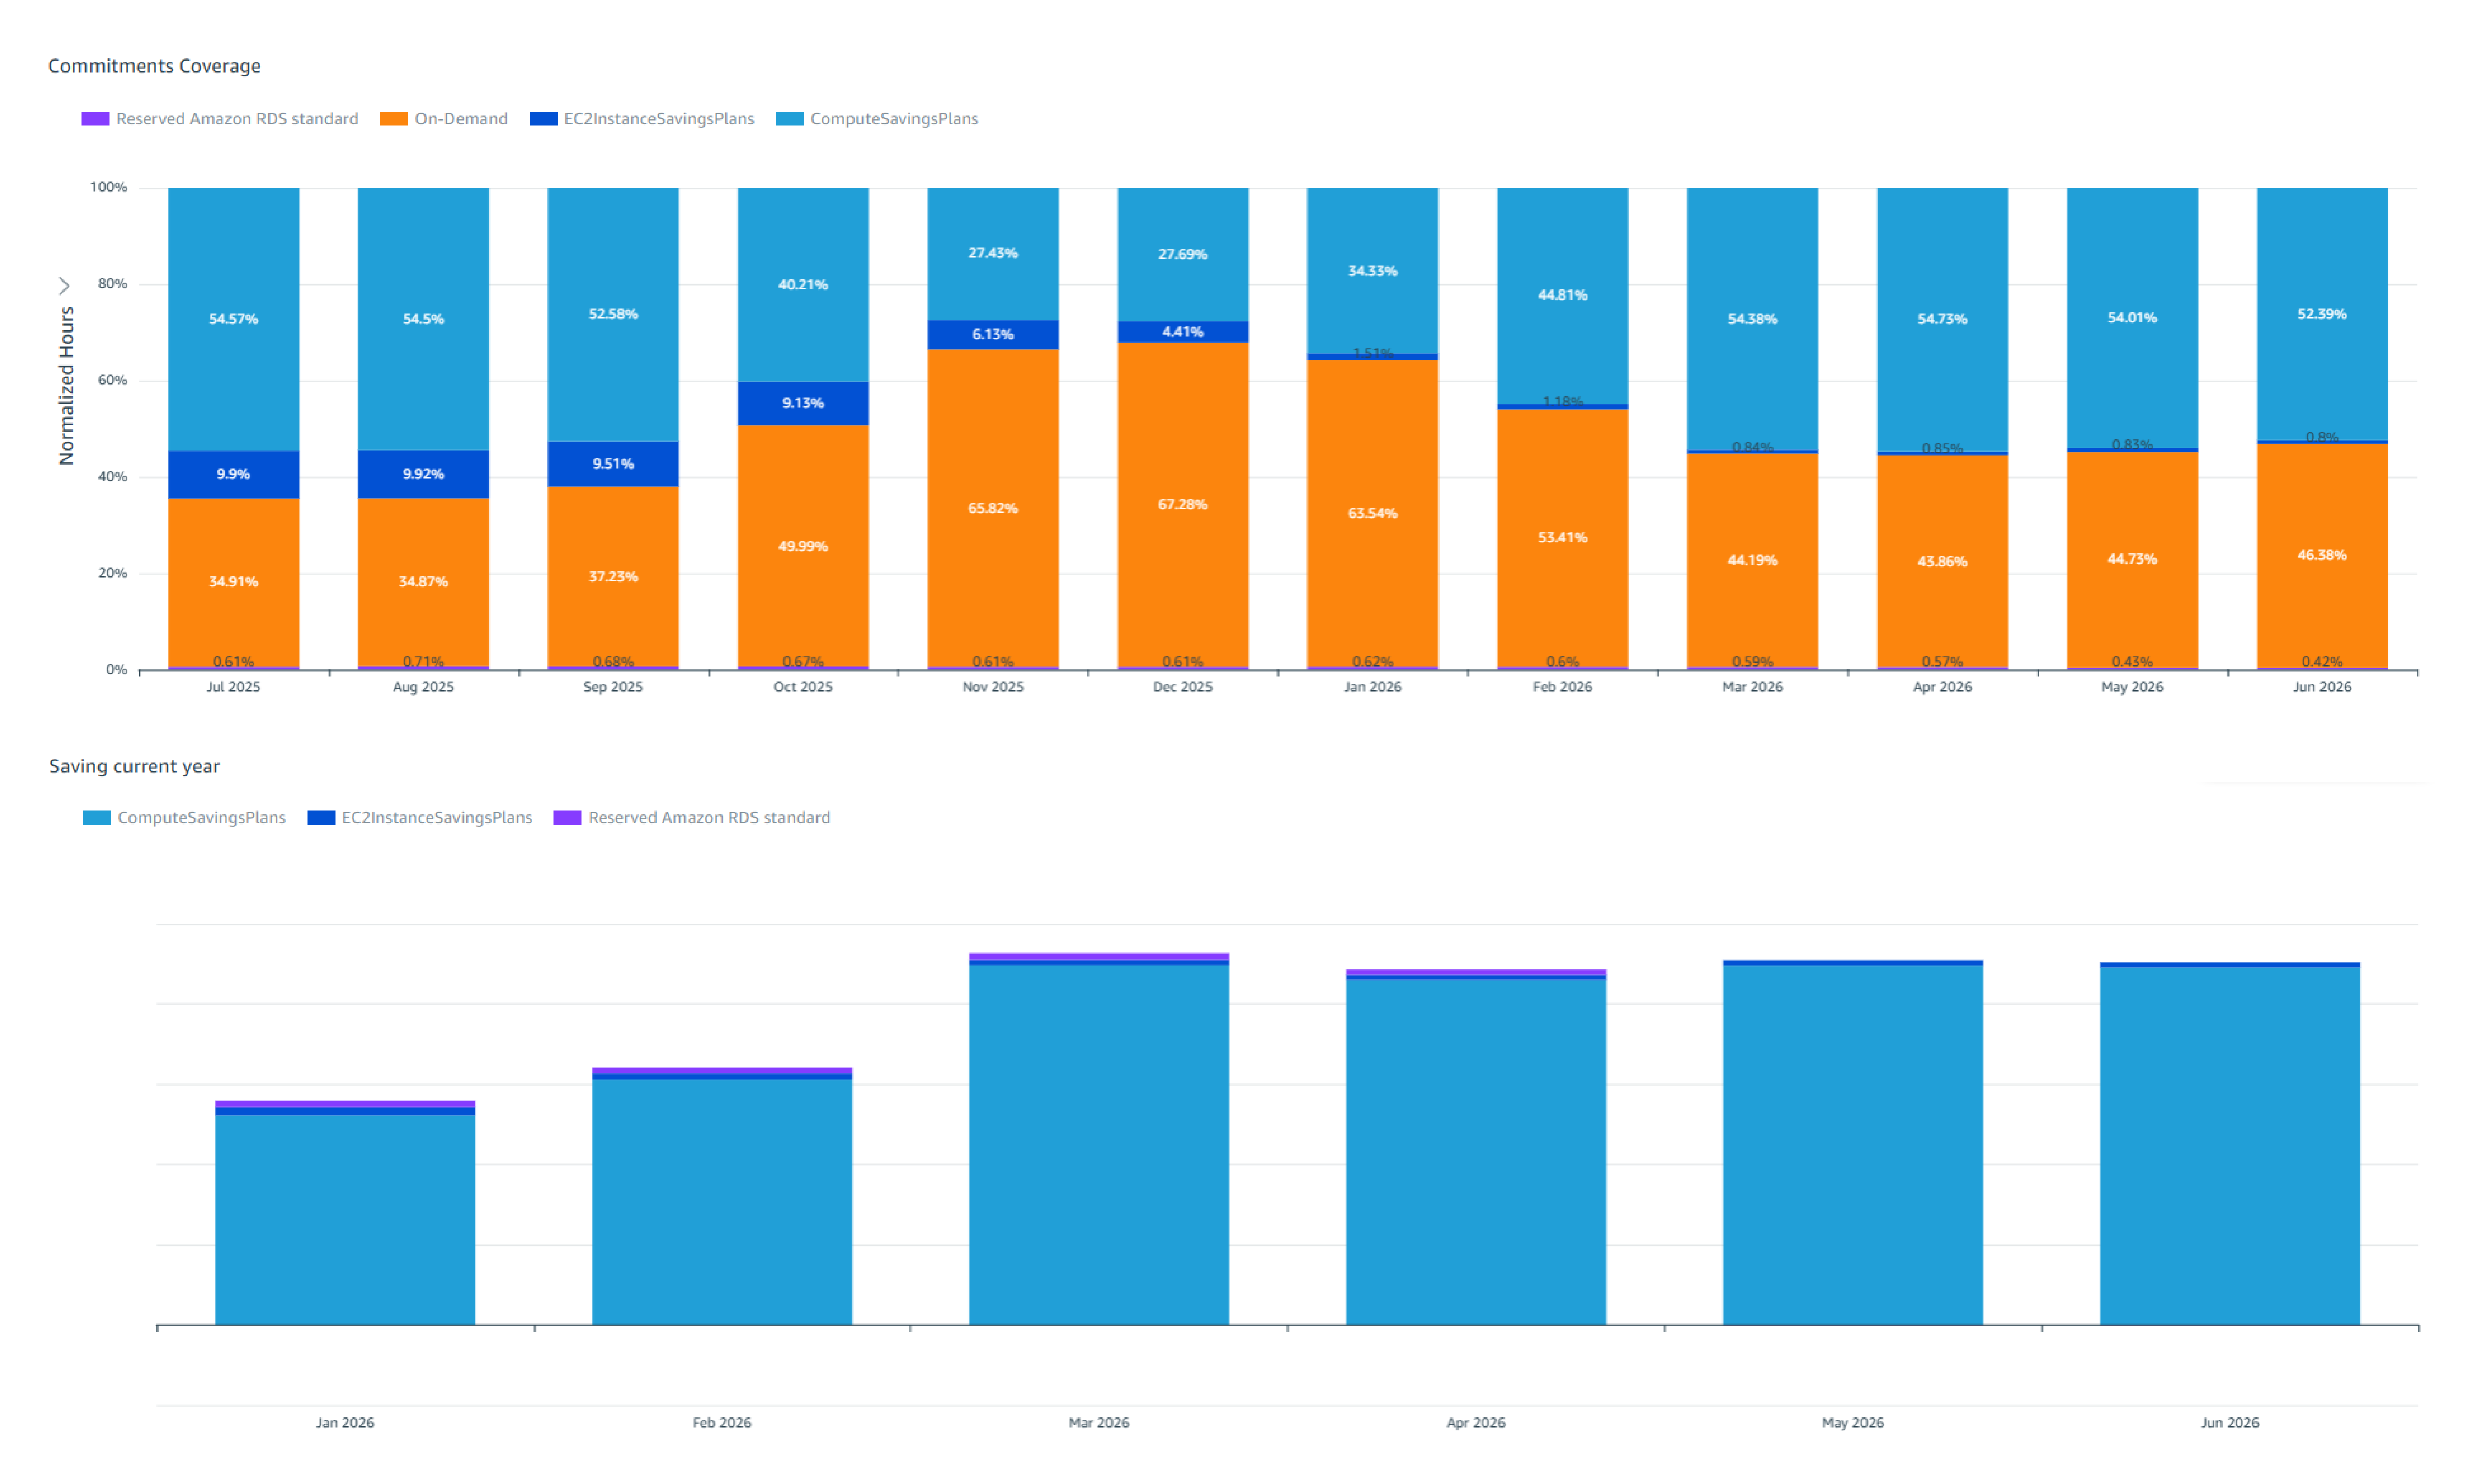
Figure 4: Dashboard showing commitment coverage and realized savings month by month.
A2A uses this dashboard to bring optimization opportunities, realized savings, and commitment performance from AWS, Azure, and Google Cloud into one place so FinOps teams can manage improvement as an ongoing process rather than a one-time review. By grouping recommendations such as rightsizing, storage optimization, decommissioning, and commitment purchases by action type and impact, the team can prioritize what to do first, track whether actions are completed, and measure whether those changes are actually generating financial results over time.
Results
A2A’s FinOps transformation delivered a combination of quantitative and qualitative results that significantly improved cloud financial governance across the organization. Thanks to a fully automated, AWS powered FinOps platform, the company now operates with standardized visibility, predictable cost management practices, and a strong alignment between business ownership and financial accountability.
From a quantitative perspective, the platform enabled more accurate and granular showback and chargeback processes, improved reservation and commitment utilization, and accelerated the identification of cost optimization opportunities across AWS, Azure, and Google Cloud. The introduction of automated dashboards, covering forecasting, anomaly detection, optimization, commitments analysis, and realized savings, allowed teams to systematically identify inefficiencies and convert them into measurable savings.
The solution delivered measurable impact in 2025:
- €1.5 million in annual savings through nearly 100 optimization actions
- €50,000 in daily costs avoided by detecting 15 cost issues early
- Up to 40% reduction in budget consolidation time (from several days to a few hours)
- 20% cost reduction on a critical application through Red Hat OpenShift Service on AWS (ROSA) optimization
Enhanced governance also ensured closer adherence to contractual spend targets, reducing the risk of underutilization or costly overspend.
From a qualitative standpoint, the solution strengthened A2A’s cloud financial culture. Executive stakeholders gained access to clear, trustworthy insights that support budgeting processes and strategic decision making. Application Owners benefit from workload aligned, self-service visibility that promotes responsible consumption and faster issue resolution. FinOps Administrators now operate through a unified, multi-cloud framework that simplifies monitoring, anomaly triage, and optimization workflows.
Next Steps
As A2A’s FinOps platform matures, the next priority is to make cloud financial insights easier to use and optimization actions easier to govern at scale. These next steps are driven by two practical needs. First, A2A’s users want to extend the value of its dashboards beyond specialist users by making analytics more accessible through natural language exploration, AI-generated insights, and AI-supported interpretation of trends, anomalies, and cost drivers. Second, A2A wants to move from identifying optimization opportunities to managing them through execution, with clearer ownership, progress tracking, and validation of realized savings. To address these needs, A2A is pursuing two enhancements:
- Integrating Amazon Quick’s Agentic AI Capabilities
- Implementing a Lifecycle Management System for Optimization Actions
Together, these initiatives will help A2A scale FinOps adoption across the organization while strengthening both data accessibility and operational accountability for financial results.
How you can get started with multi-cloud FinOps
A2A’s journey to automated multi-cloud cost management demonstrates how organizations can achieve significant financial impact through strategic FinOps implementation. Organizations scaling their cloud financial operations can apply these key principles:
- Standardize early: adopting FinOps Open Cost and Usage Specification (FOCUS) as a common data model for multi-cloud analysis, eliminating custom ETL logic for each provider.
Build on proven frameworks: AWS Cloud Intelligence Dashboards (CID) provide a production-ready foundation that A2A customized to meet specific organizational requirements, accelerating time-to-value. - Design for your audience: Role-based dashboards – tailored for executives, application owners, and FinOps administrators – ensure each stakeholder group receives relevant, actionable insights.
- Automate cost monitoring: Proactive anomaly detection prevents budget overruns before they impact monthly results, shifting FinOps from reactive reporting to proactive governance.
- Measure business impact: Track both cost savings and operational efficiency gains to demonstrate clear ROI and secure ongoing stakeholder support for FinOps initiatives.
- Accelerate with expert guidance: A2A partnered with AWS Professional Services to scale their multi-cloud FinOps platform, combining deep cloud and FinOps expertise with proven frameworks to accelerate timelines and deliver faster time to value.
See the AWS Cost Management documentation for detailed implementation guidance, and the AWS Cloud Financial Management Blog for best practices and customer stories.