AWS Cloud Financial Management
Optimize LLM Costs on Amazon Bedrock: From Billing Attribution to Operational Telemetry
As you scale your use of large language models (LLMs), a type of foundation model (FM) on Amazon Bedrock, costs increases. But traditional cloud cost tools only tell you how much you spent, not why. That gap between billing data and operational insight is where cost inefficiencies go undetected. Optimizing LLM costs requires visibility into which developers, models, and operations drive your spend.
In this post, you will learn a three-layer observability framework for Amazon Bedrock that works across AWS-native tools (Kiro, Amazon Q Developer), developer tools (Claude Code, Cursor), and custom applications. This post covers how to implement each layer, starting with native billing attribution through AWS Identity and Access Management (IAM) and the AWS Cost and Usage Report (CUR). It explains which metrics matter most for cost optimization and five concrete levers you can use to reduce spend by 30-50%, depending on your workload.
The Challenge: Visibility Gaps in LLM Spend
You likely start with Amazon Bedrock’s built-in observability: Amazon CloudWatch metrics for invocation counts and token consumption, CUR and AWS Cost Explorer for aggregate spend and visualization, and AWS Budgets for threshold alerts. These tools are essential, but they answer questions at the infrastructure level.
As Amazon Bedrock adoption scales across teams and use cases, you need more than infrastructure-level data. The questions that matter become operational:
- Which developers or teams drive the most token consumption?
- Is the right model assigned to each task, or are premium models handling routine work?
- How effective is prompt caching?
- How much spend is wasted on failed requests?
- What is the cost per session, commit, or pull request?
Enhanced telemetry provides the organizational context that infrastructure tools were never designed to capture.
The Framework: Three Layers of LLM Observability
LLM cost observability has three layers, each building on the previous:
Layer 1: Amazon Bedrock Native Metrics (Start Here)
Enable the foundational observability that Amazon Bedrock provides natively. Amazon Bedrock CloudWatch metrics track invocation counts, latency, and token usage per model. Amazon Bedrock also recently announced a new IAM-based cost allocation feature, a CUR 2.0 capability that attributes spend to the IAM identity that made each call. Combined with cost allocation tags through Application Inference Profiles (to attribute spend to teams or projects regardless of caller identity) and AWS Budgets with threshold-based alerts, you have billing-level visibility without custom pipelines.
To activate this layer:
- Per-user attribution: Tag your IAM users and roles in the IAM console (see Figure 1) with attributes aligned to your organizational structure (team, project, cost center), then activate those tags as cost allocation tags in the AWS Billing and Cost Management console (see Figure 2). Create a CUR 2.0 data export and select “Include caller identity (IAM principal) allocation data” to surface per-user and per-role Amazon Bedrock spend in CUR and Cost Explorer. For implementation details, see using IAM principal for cost allocation.
- Per-team/project attribution: Create Application Inference Profiles and assign cost allocation tags aligned to your organizational structure (team, project, environment). Activate those tags in the AWS Billing and Cost Management console. Set up AWS Budgets with threshold-based alerts for your Amazon Bedrock spend.
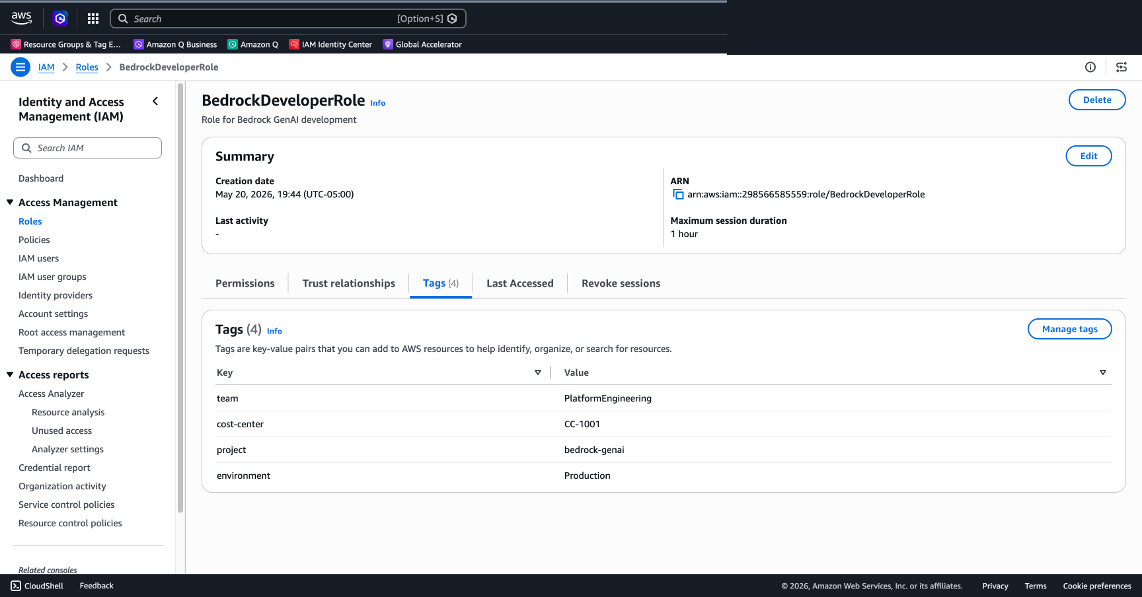
Figure 1: Apply tags to an IAM role in the IAM console (team, cost-center, project, environment)
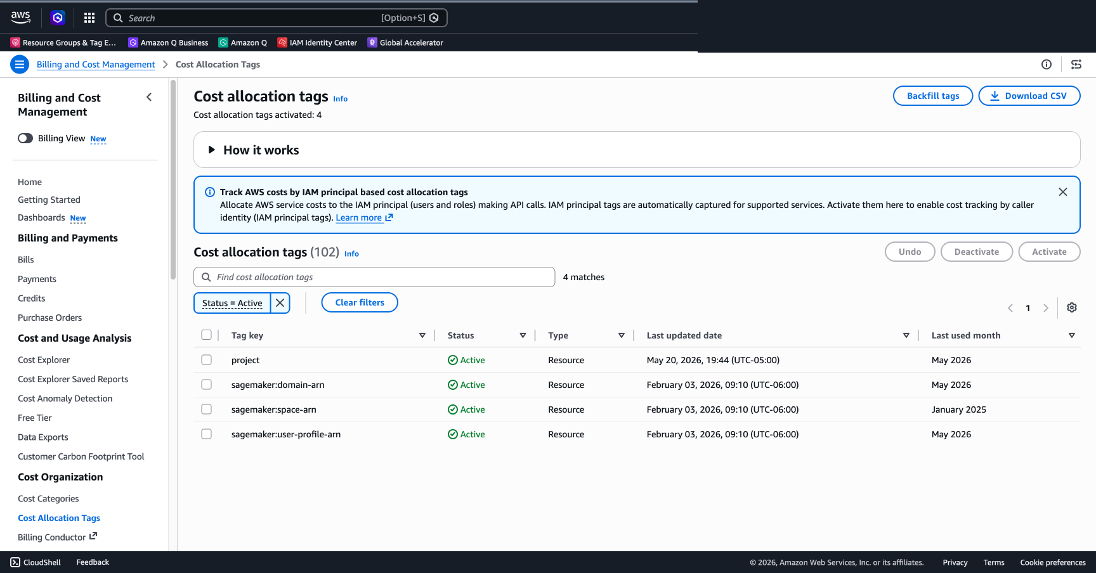
Figure 2: Activate cost allocation tags in the AWS Billing and Cost Management console
Layer 2: Model Invocation Logging (Add Depth)
Model invocation logging captures the full picture of every Amazon Bedrock API call: request data, response data, and metadata. This moves you from “how many tokens” to “what was in those tokens and why.”
Amazon Bedrock can log every API call to Amazon Simple Storage Service (Amazon S3) or Amazon CloudWatch Logs. Once enabled in Bedrock Settings, each log entry includes metadata such as model ID, request duration, and token breakdown. This raw signal enables analytics pipelines using Amazon Athena and Amazon QuickSight that surface usage patterns across models, teams, and time periods.
To set up model invocation logging:
- Enable model invocation logging in the Amazon Bedrock console or through the API (see Figure 3).
- Choose your log destination: Amazon S3 for long-term analytics, CloudWatch Logs for real-time querying.
- Build dashboards in Amazon QuickSight or CloudWatch to visualize token usage by model, team, and time period.
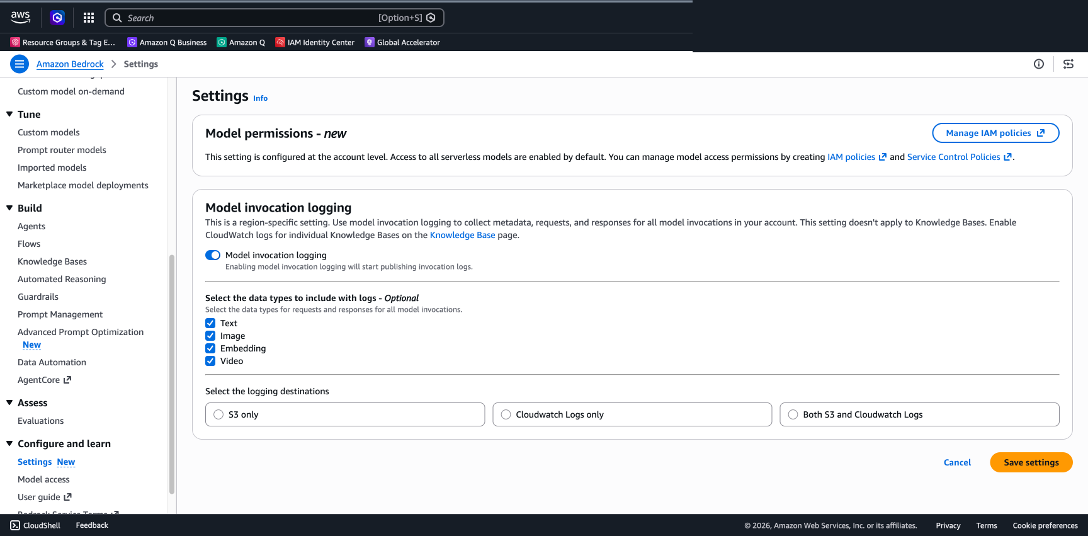
Figure 3: Enable model invocation logging in Amazon Bedrock Settings
For hands-on implementation, see Monitor and optimize your Amazon Bedrock usage with Amazon Athena and Amazon QuickSight.
Layer 3: Application-Level Telemetry (Unlock Optimization)
This is where actionable cost optimization insights emerge. OpenTelemetry (OTEL) adds organizational context that Amazon Bedrock’s native metrics cannot provide: who is using what, how, and how efficiently. Layers 1 and 2 show what Amazon Bedrock is doing, Layer 3 reveals why.
Implement OpenTelemetry instrumentation in the client application, not in Amazon Bedrock itself. The path to Layer 3 visibility depends on which client your teams use:
| Client | OTEL support | Implementation |
|---|---|---|
| Claude Code | Built-in | Anthropic provides client-side OTEL |
| Custom apps | You instrument | Use OTEL SDKs / AWS Distro for OpenTelemetry (ADOT) |
| Kiro / Amazon Q Developer | CloudTrail data events | Use CloudTrail data events + Athena queries |
| Cursor (Bring Your Own Key (BYOK)) | Limited | Layers 1 & 2 only; use Cursor’s admin dashboard |
OpenTelemetry is an open standard that works across LLM clients and model providers. It delivers per-developer and per-team attribution, session-level and operation-level granularity, and rich attributes for multi-dimensional analysis. Claude Code serves as a practical reference implementation. It ships with built-in OpenTelemetry support, making it an excellent example of what enhanced LLM telemetry looks like in practice. For custom applications, you instrument equivalent metrics using the OpenTelemetry SDKs and ADOT.
Key Metrics for Cost Optimization (Claude Code Built-In):
claude_code.token.usage: Tokens consumed per session (direct cost driver)claude_code.cost.usage: Dollar cost per session (immediate spend visibility)claude_code.active_time.total: Active session time to identify idle sessionsclaude_code.commit.count/claude_code.pull_request.count: ROI metrics (cost per unit of output)
Key Events for Deeper Insights (Claude Code Built-In):
claude_code.api_request: Cost, model, latency, token breakdown (input/output/cache). Identify expensive operations and measure cache efficiencyclaude_code.api_error: Error messages, status codes, retry attempts. Quantify wasted spend on failuresclaude_code.tool_result: Execution duration, success/failure. Find which operations drive the most cost
Standard Attributes for Slicing Data:
- model: Per-model cost comparison and switching decisions
- type (input/output/cacheRead/cacheCreation): Cache efficiency analysis
- tool (Edit/Write/Bash/Read): Cost by operation type
- language: Cost by programming language context
For Claude Code implementation, see the Guidance for Claude Code with Amazon Bedrock.
For AWS-native clients (Kiro, Amazon Q Developer), use CloudTrail data events with Athena queries to achieve equivalent per-user, per-feature visibility. See Exploring Telemetry Events in Amazon Q Developer.
Five Cost Levers Driven by Telemetry
With these three layers in place, you can act on five concrete cost optimization levers:
1. Model switching: a significant lever (30-50% savings potential, based on model pricing differences)
The model attribute reveals which model handles which tasks. Look for high token consumption on premium models for routine work like code formatting or simple edits. Configure routing rules to reserve premium models for complex reasoning and use smaller, cheaper models for routine tasks. Monitor the model attribute over time to measure adoption and validate savings. For example, Claude Sonnet 4.5 costs $3/$15 per million tokens (input/output) compared to Claude Haiku 4.5 at $1/$5, representing approximately 67% savings on routine tasks. The 30-50% estimate is a conservative blended figure assuming not all tasks can be routed to smaller models.
2. Cache efficiency: reduce redundant processing (up to 90% cost savings and up to 85% latency reduction on cached tokens, for supported models)
The type attribute breaks down tokens into input, output, cacheRead, and cacheCreation. A high cacheRead ratio means you are reusing context rather than reprocessing it, reducing both cost and inference latency. Low cacheRead ratios signal opportunities to restructure prompts or workflows. Analyze cache hit rates across teams and share best practices from high-efficiency teams. These savings are based on Amazon Bedrock pricing: cached input tokens are charged up to 90% less than standard input tokens for supported models (for example, $0.30 vs $3.00 per million tokens for Claude Sonnet 4.6, per the Amazon Bedrock pricing page). Latency reduction comes from skipping recomputation of cached prompt prefixes.
3. Error-driven waste: stop paying for failures
Every failed request captured by the api_error event consumes tokens with zero productive output. High error rates or repeated retries signal actionable opportunities. Set up CloudWatch alarms on error rate thresholds and investigate root causes. Common fixes include better prompt engineering, input validation, and rate limit management.
4. Tool and operation optimization: know what drives cost
The tool_result and tool_decision events reveal which operations consume the most time and tokens. Identify expensive operations that could be handled more efficiently, or high reject rates indicating wasted computation. Identify top cost-driving operations and evaluate whether they can be optimized, batched, or handled by a less expensive model.
5. Per-developer and per-team visibility: enable accountability
Start with IAM-based cost allocation to get billing-level attribution of Amazon Bedrock spend by IAM user and role directly in CUR and Cost Explorer; no custom pipelines needed. Layer OTEL attributes on top for operational context: cost per session, commit, or pull request. The goal is to surface optimization opportunities at the team and individual level, such as identifying workflows that would benefit from prompt engineering guidance or model switching.
Setting Up Alerts
With enhanced telemetry flowing into CloudWatch, set up tiered alerting:
- Info: Daily spend exceeds baseline by 20% → Dashboard notification
- Warning: Hourly token consumption spikes above the 95th percentile (P95) → Notify team lead through Amazon SNS
- Critical: Error rate exceeds 10% sustained over 15 minutes → Page on-call; investigate wasted spend
- Budget: Monthly projected spend exceeds threshold → Trigger AWS Budgets action; review model selection
Getting Started: A Phased Approach
You don’t need to implement the three layers at once:
Phase 1 (Week 1): Enable Layer 1: IAM cost allocation for per-user billing attribution, Amazon Bedrock native metrics, cost allocation tags, and budget alerts for immediate baseline visibility.
Phase 2 (Week 2-3): Enable Layer 2: Model invocation logging. Build initial dashboards in Amazon QuickSight or CloudWatch to understand usage patterns.
Phase 3 (Week 3-4): Enable Layer 3: OpenTelemetry instrumentation on your LLM clients. Start with a pilot team, validate metrics, then roll out organization-wide.
Ongoing: Review dashboards weekly, act on the five cost levers, and iterate on alerting thresholds as you learn your usage patterns.
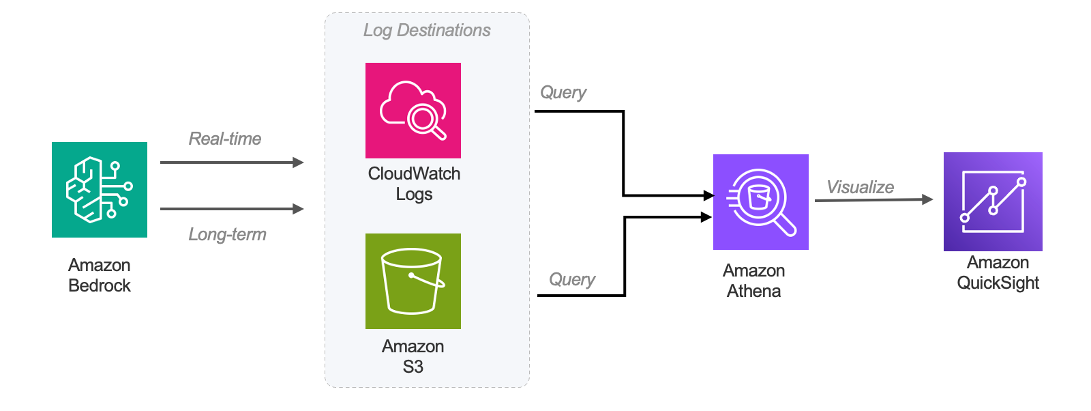
Figure 4: Model Invocation Logging Architecture
Beyond Telemetry: Complementary Strategies
Intelligent Prompt Routing in Amazon Bedrock provides a single serverless endpoint that routes requests to different foundation models (FMs) within a model family, optimizing for both response quality and cost. Intelligent Prompt Routing can reduce costs by up to 30% without compromising on accuracy. Your telemetry investment validates whether routing makes the right decisions. Use your dashboards to compare cost-per-request before and after enabling routing, identify prompt categories where routing saves the most, and detect cases where routing impacts output quality.
Amazon Bedrock also offers Model Distillation (up to 75% cost reduction with less than 2% accuracy loss, based on AWS benchmarks), batch inference (up to 50% discount for non-time-sensitive workloads), Reserved Tier for dedicated capacity on predictable sustained workloads, cross-Region Inference for handling traffic bursts cost-effectively, and Knowledge Bases with S3 Vectors for up to 90% reduction in vector storage costs. For further reading, see Effective cost optimization strategies for Amazon Bedrock, Optimizing cost for using foundational models with Amazon Bedrock, and FinOps for AI Playbooks.
Conclusion
Optimizing LLM costs on Amazon Bedrock requires building the telemetry foundation that enables informed decisions. With native IAM-based cost allocation handling billing attribution, and enhanced telemetry covering operational insight, you have the full stack. By layering Amazon Bedrock native metrics, model invocation logging, and OpenTelemetry instrumentation, you gain visibility to answer the questions that matter: Which model should we use for this task? Are we caching effectively? How much are we losing to errors?
The framework applies to LLM clients running on Amazon Bedrock, whether Claude Code with native OpenTelemetry support, Kiro and Amazon Q Developer with CloudTrail telemetry, Cursor with BYOK, or custom applications instrumented with ADOT. The telemetry path differs by client, but the three-layer framework and five cost levers remain consistent.
Start with the basics, add depth incrementally, and let the telemetry guide your optimization decisions.
To learn more about Amazon Bedrock, see the Amazon Bedrock documentation. For CloudWatch metrics and monitoring, see Amazon CloudWatch documentation. To explore cost management tools, see AWS Cost Explorer and AWS Budgets.
Next steps
After implementing this framework and achieving baseline visibility, prioritize based on your telemetry insights:
- High spend on routine tasks? Explore Intelligent Prompt Routing.
- Consistent workload patterns with repeated prompts? Evaluate prompt caching and Model Distillation.
- Non-time-sensitive workloads? Implement Batch Inference for a 50% discount.
Ready to get started? Enable IAM-based cost allocation in the AWS Billing and Cost Management console today. Review your telemetry dashboards weekly, act on the five cost levers, and iterate on alerting thresholds as you learn your usage patterns.