AWS News Blog
New – High-Resolution Custom Metrics and Alarms for Amazon CloudWatch
Amazon CloudWatch has been an important part of AWS since early 2009! Launched as part of a three-pack that also included Auto Scaling and Elastic Load Balancing, CloudWatch has evolved into a very powerful monitoring service for AWS resources and the applications that you run on the AWS Cloud. CloudWatch custom metrics (launched way back in 2011) allow you to store business and application metrics in CloudWatch, view them in graphs, and initiate actions based on CloudWatch Alarms. Needless to say, we have made many enhancements to CloudWatch over the years! Some of the most recent include Extended Metrics Retention (and a User Interface Update), Dashboards, API/CloudFormation Support for Dashboards, and Alarms on Dashboards.
Originally, metrics were stored at five minute intervals; this was reduced to one minute (also known as Detailed Monitoring) in response to customer requests way back in 2010. This was a welcome change, but now it is time to do better. Our customers are streaming video, running flash sales, deploying code tens or hundreds of times per day, and running applications that scale in and out very quickly as conditions change. In all of these situations, a minute is simply too coarse of an interval. Important, transient spikes can be missed; disparate (yet related) events are difficult to correlate across time, and the MTTR (mean time to repair) when something breaks is too high.
New High-Resolution Metrics
Today we are adding support for high-resolution custom metrics, with plans to add support for AWS services over time. Your applications can now publish metrics to CloudWatch with 1-second resolution. You can watch the metrics scroll across your screen seconds after they are published and you can set up high-resolution CloudWatch Alarms that evaluate as frequently as every 10 seconds.
Imagine alarming when available memory gets low. This is often a transient condition that can be hard to catch with infrequent samples. With high-resolution metrics, you can see, detect (via an alarm), and act on it within seconds:
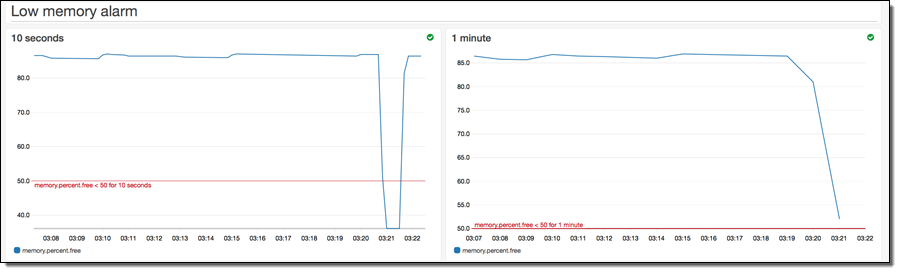
In this case the alarm on the right would not fire, and you would not know about the issue.
Publishing High-Resolution Metrics
You can publish high-resolution metrics in two different ways:
- API – The
PutMetricDatafunction now accepts an optionalStorageResolutionparameter. Set this parameter to 1 to publish high-resolution metrics; omit it (or set it to 60) to publish at standard 1-minute resolution. - collectd plugin – The CloudWatch plugin for collectd has been updated to support collection and publication of high-resolution metrics. You will need to set the
enable_high_resolution_metricsparameter in the config file for the plugin.
CloudWatch metrics are rolled up over time; resolution effectively decreases as the metrics age. Here’s the schedule:
- 1 second metrics are available for 3 hours.
- 60 second metrics are available for 15 days.
- 5 minute metrics are available for 63 days.
- 1 hour metrics are available for 455 days (15 months).
When you call GetMetricStatistics you can specify a period of 1, 5, 10, 30 or any multiple of 60 seconds for high-resolution metrics. You can specify any multiple of 60 seconds for standard metrics.
A Quick Demo
I grabbed my nearest EC2 instance, installed the latest version of collectd and the Python plugin:
Then I downloaded the setup script for the plugin, made it executable, and ran it:
$ wget https://raw.githubusercontent.com/awslabs/collectd-cloudwatch/master/src/setup.py
$ chmod a+x setup.py
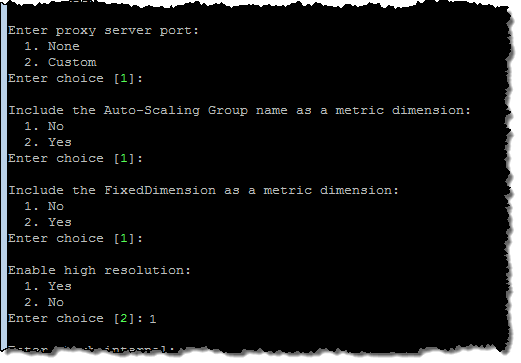
$ sudo ./setup.pyI had already created a suitable IAM Role and added it to my instance; it was automatically detected during setup. I was asked to enable the high resolution metrics:
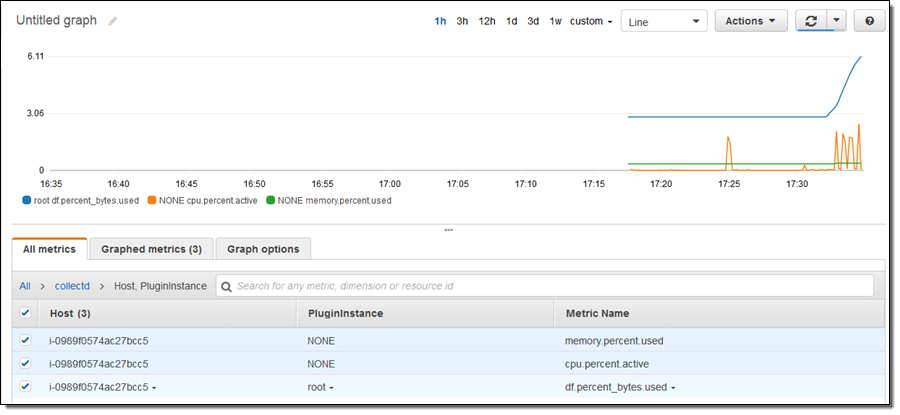
collectd started running and publishing metrics within seconds. I opened up the CloudWatch Console to take a look:
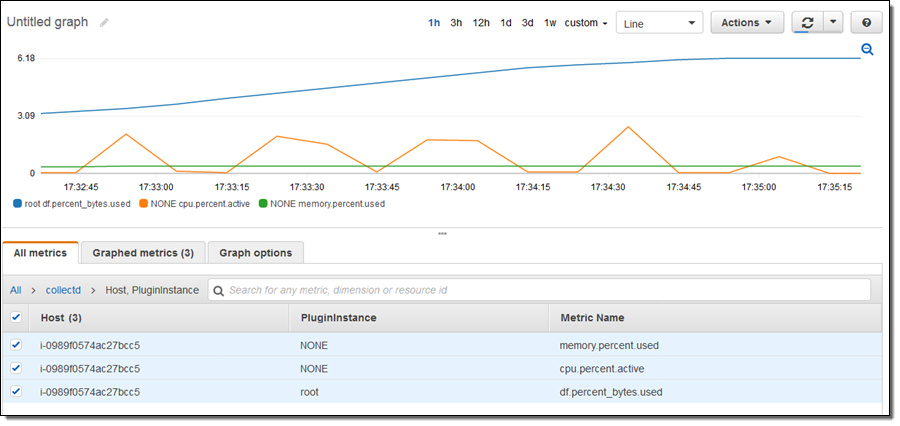
Then I zoomed in to see the metrics in detail:
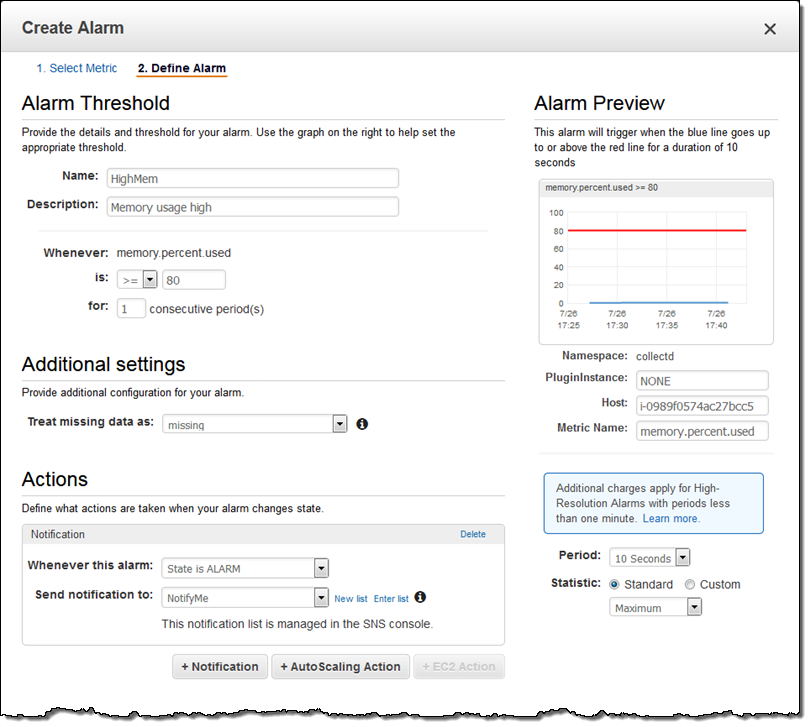
I also created an alarm that will check the memory.percent.used metric at 10 second intervals. This will make it easier for me to detect situations where a lot of memory is being used for a short period of time:
Now Available
High-resolution custom metrics and alarms are available now in all Public AWS Regions, with support for AWS GovCloud (US) coming soon.
As was already the case, you can store 10 metrics at no charge every month; see the CloudWatch Pricing page for more information. Pricing for high-resolution metrics is identical to that for standard resolution metrics, with volume tiers that allow you to realize savings (on a per-metric) basis when you use more metrics. High-resolution alarms are priced at $0.30 per alarm per month.