AWS Big Data Blog
Testing data quality at scale with PyDeequ
June 2024: This post was reviewed and updated to add instructions for using PyDeequ with Amazon SageMaker Notebook, SageMaker Studio, EMR, and updated the examples against a new dataset.
March 2023: You can now use AWS Glue Data Quality to measure and manage the quality of your data. AWS Glue Data Quality is built on Deequ and it offers a simplified user experience for customers who want to this open-source package. Refer to the blog and documentation for additional details.
You generally write unit tests for your code, but do you also test your data? Incoming data quality can make or break your application. Incorrect, missing, or malformed data can have a large impact on production systems. Examples of data quality issues include the following:
- Missing values can lead to failures in the production system that require non-null values (
NullPointerException) - Changes in the distribution of data can lead to unexpected outputs of machine learning (ML) models
- Aggregations of incorrect data can lead to misguided business decisions
In this post, we introduce PyDeequ, an open source Python wrapper over Deequ (an open source tool developed and used at Amazon). Deequ is written in Scala, whereas PyDeequ allows you to use its data quality and testing capabilities from Python and PySpark, the language of choice for many data scientists. PyDeequ democratizes and extends the power of Deequ by allowing you to use it alongside the many data science libraries that are available in that language. Furthermore, PyDeequ allows for fluid interface with pandas DataFrames as opposed to restricting within Apache Spark DataFrames.
Deequ allows you to calculate data quality metrics for your dataset, define and verify data quality constraints, and be informed about changes in data distribution. Instead of implementing checks and verification algorithms on your own, you can focus on describing how your data should look. Deequ supports you by suggesting checks for you. Deequ is implemented on top of Apache Spark and is designed to scale with large datasets (billions of rows) that typically live in a data lake, distributed file system, or a data warehouse. PyDeequ gives you access to this capability, but also allows you to use it from the familiar environment of your Python Jupyter notebook.
For more information about Deequ and PyDeequ, see Test data quality at scale with Deequ and Monitor data quality in your data lake using PyDeequ and AWS Glue.
| Since you’re reading this post, you may also be interested in the following: |
Deequ at Amazon
Deequ is used internally at Amazon to verify the quality of many large production datasets. Dataset producers can add and edit data quality constraints. The system computes data quality metrics on a regular basis (with every new version of a dataset), verifies constraints defined by dataset producers, and publishes datasets to consumers in case of success. In error cases, dataset publication can be stopped, and producers are notified to take action. Data quality issues don’t propagate to consumer data pipelines, reducing their area of impact.
Deequ is also used within Amazon SageMaker Model Monitor. Now with the availability of PyDeequ, you can use it from a broader set of environments—Amazon SageMaker, AWS Glue, Amazon EMR, and more.
Overview of PyDeequ
Let’s look at PyDeequ’s main components and how they relate to Deequ (shown in the following diagram):
- Metrics computation – Deequ computes data quality metrics, which are statistics such as completeness, maximum, or correlation. Deequ uses Spark to read from sources such as Amazon Simple Storage Service (Amazon S3) and compute metrics through an optimized set of aggregation queries. You have direct access to the raw metrics computed on the data.
- Constraint verification – As a user, you focus on defining a set of data quality constraints to be verified. Deequ takes care of deriving the required set of metrics to be computed on the data. Deequ generates a data quality report, which contains the result of the constraint verification.
- Constraint suggestion – You can choose to define your own custom data quality constraints or use the automated constraint suggestion methods that profile the data to infer useful constraints.
- Python wrappers – You can call each Deequ function using Python syntax. The wrappers translate the commands to the underlying Deequ calls and return their response.

Figure 1 Overview of PyDeequ components
Solution overview
As a running example, we have generated a synthetic reviews dataset and introduced various data issues. We demonstrate how to detect these issues using PyDeequ. We begin the way many data science projects do: with initial data exploration and assessment in a Jupyter notebook.
If you’d like to follow along with a live Jupyter notebook, check out the notebook on our GitHub repo.
During the data exploration phase, we want to answer some basic questions about the data:
- Are there fields that have missing values?
- How many distinct categories are there in the categorical fields?
- Are there correlations between some key features?
- If there are two supposedly similar datasets (such as different categories or different time periods), are they really similar?
We also show you how to scale this approach to large-scale datasets, using the same code on an EMR cluster. This is how you’d likely do your ML training as you move into a production setting.
Set up PyDeequ
In this section, we show how to set up PyDeequ in Amazon SageMaker notebooks, Amazon SageMaker Studio Classic, and Amazon SageMaker Studio.
After you complete the setup for your specific environment, the rest of the steps will be the same for all three environments. In all cases, we use the default VPC for SageMaker notebooks as well as SageMaker Studio domains. The examples presented here use PyDeequ library version 1.2.0 (latest at the time of writing).
Set up PyDeequ using SageMaker notebooks
Complete the following steps to set up PyDeequ in a SageMaker notebook. The steps were tested in a SageMaker notebook instance ml.m5.2xlarge and conda_python3 kernel.
- Create a new notebook instance.
As of version 1.1.0, PyDeequ supports Spark up to version 3.3.0 (see the PyDeequ GitHub repository). Your PyDeequ version has to work with your version of Spark (and your Java version).
- In the notebook, run the following lines in a code cell to specify
SPARK_VERSION:
- Install the
pydeequmodule. For consistency, we also set the PyDeequ version: - To import the modules, run the following commands in a code cell:
This completes the steps specific to SageMaker Notebooks.
Set up PyDeequ in SageMaker Studio Classic
The following steps were tested with the Data Science 3.0 image and Python 3 kernel.
- Create a new JupyterLab notebook using the Data Science 3.0 image and Python 3 kernel.
- Launch your terminal in the current SageMaker image (not the system terminal).

Figure 2 Opening image terminal from a JupyterLab notebook
- In the image terminal, install Java and identify its installation path:
In our case, the installation path was /usr/lib/jvm/java-11-openjdk-amd64/. Save the path to use in a later step.
- In the Jupyter notebook, run the following code to define the
SPARK_VERSION(we used 3.3) andJAVA_HOME(from the previous step) variables:
As of version 1.1.0, PyDeequ supports Spark up to version 3.3.0. Your PyDeequ version has to work with your version of Spark (and your Java version).
- In the Jupyter notebook, install the pydeequ and sagemaker_pyspark modules (run each line in a separate code cell). We’ve set the version of PyDeequ for consistency with the Spark version:
- To import the modules, run the following in a code cell:
This completes the steps specific to SageMaker Studio Classic.
Set up PyDeequ in SageMaker Studio
The following steps were tested with the JupyterLab space and SageMaker distribution 1.6.
- Create a new JupyterLab space.
Make sure the role attached to your domain can access the S3 bucket with the synthetic data.
- Open a terminal by navigating to File, New, Terminal.
- Install Java and identify its installation path:
In our case, the installation path is /usr/lib/jvm/java-11-openjdk-amd64/. Save the path to use in later steps.
- In the Jupyter notebook, run the following lines in a code cell to define the
SPARK_VERSION(we used 3.3) andJAVA_HOME(from the previous step) variables:
As of version 1.1.0, PyDeequ supports Spark up to version 3.3.0. Your PyDeequ version has to work with your version of Spark (and your Java version).
- In the Jupyter notebook, install the
pydeequandsagemaker_pysparkmodules (run each line in a separate code cell). We’ve set the version of PyDeequ for consistency with the Spark version: - To import the modules, run the following lines in a code cell:
This completes the steps specific to SageMaker Studio.
Start a PySpark Session
We demonstrate PyDeequ features in a SageMaker notebook instance (ml.m5.2xlarge) and with the conda_python3 kernel.
In the following code, we import modules and set up a Spark session with the following configurations:
config("spark.driver.extraClassPath", classpath)to prepend extra classpath entries to the classpath of the driver.config("spark.jars.packages", pydeequ.deequ_maven_coord)to provide Maven coordinates of JARs to include on the driver and executor classpaths.config("spark.jars.excludes", pydeequ.f2j_maven_coord)to exclude JARs to avoid conflicts.config("spark.driver.memory", "15g")to increase Java heap space.config("spark.sql.parquet.int96RebaseModeInRead", "CORRECTED")to read the datetime values as is. In our synthetic dataset, we introduced review years and dates such as 1696 to simulate a manual entry error. To make sure these timestamps are read correctly, this configuration was necessary. See Spark issue SPARK-31404 about the calendar switch in version 3.0.
For a detailed explanation about these parameters, see Spark Configuration.
Read the dataset
Read the dataset with the following code:
After you load the DataFrame, you can run df.printSchema() to view the schema of the dataset:
Data analysis
Before we define checks on the data, we want to calculate some statistics for the dataset. As with Deequ, PyDeequ supports a rich set of metrics. For more information, see Test data quality at scale with Deequ or the GitHub repo. In the following example, we use the AnalysisRunner to capture the metrics we’re interested in:
The following table summarizes our findings.
| Name | Instance | Value |
Distinctness |
review_id |
0.99266 |
Completeness |
review_id |
1 |
Compliance |
top star_rating |
0.74999 |
Correlation |
helpful_votes,total_votes |
0.98179 |
Correlation |
total_votes,star_rating |
-7.3881 |
Mean |
star_rating |
3.99999 |
Size |
* | 3010972 |
From this, we learn the following:
review_idhas no missing values and approximately 99.27% of the values are distinct- 74.99% of reviews have a
star_ratingof 4 or higher total_votesandstar_ratingare not correlatedhelpful_votesandtotal_votesare strongly correlated- The average
star_ratingis 3.99 - The dataset contains 3,010,972 reviews
Sometimes, you may want to run multiple metrics on a single column. For example, you want to check that all reviews were written either after 1996 or before 2017. In this case, it’s helpful to provide a name for each metric in order to distinguish the results in the output:
| Name | Instance | Value |
Compliance |
after-1996 review_year |
0.9999993 |
Compliance |
before-2017 review_year |
0.999999 |
Alternatively, you can combine the conditions by using logical operators and and or. In the following example, we check that the years for the reviews are between 1996 and 2017 and the values for the insight column are either ‘Y’ or ‘N’:
In some cases, you might prefer a different format for the output. PyDeequ allows you to output the results in a JSON format:
Define and run tests for data
After analyzing and understanding the data, we want to verify that the properties we have derived also hold for new versions of the dataset. By defining assertions on the data distribution as part of a data pipeline, we can make sure every processed dataset is of high quality, and that any application consuming the data can rely on it.
For writing tests on data, we start with the VerificationSuite and add checks on attributes of the data. In this example, we test for the following properties of our data:
- At least 3 million rows in total
review_idis never nullreview_idis uniquestar_ratinghas a minimum of 1.0 and maximum of 5.0- marketplace only contains US, UK, DE, JP, or FR
- year does not contain negative values
- year is between 1996 and 2017
The following code reflects the previous statements. For information about all available checks, see the GitHub repo. You can run this directly in the Spark shell as previously explained:
After calling run(), PyDeequ translates your test description into Deequ, which translates it into a series of Spark jobs that are run to compute metrics on the data. Afterwards, it invokes your assertion functions (for example, lambda x: x == 1.0 for the minimum star rating check) on these metrics to see if the constraints hold on the data. The following table summarizes our findings.
| Constraint | constraint_status | constraint_message |
SizeConstraint(Size(None)) |
Success |
|
MinimumConstraint(Minimum(star_rating,None)) |
Success |
|
MaximumConstraint(Maximum(star_rating,None)) |
Success |
|
CompletenessConstraint(Completeness(review_id,None)) |
Success |
|
UniquenessConstraint(Uniqueness(List(review_id),None)) |
Failure |
Value: 0.9853137126482744 does not meet the constraint requirement! |
CompletenessConstraint(Completeness(marketplace,None)) |
Failure |
Value: 0.8570391886739565 does not meet the constraint requirement! |
ComplianceConstraint(Compliance(marketplace contained in US,UK,DE,JP,FR,`marketplace` IS NULL OR `marketplace` IN ('US','UK','DE','JP','FR'),None)) |
Failure |
Value: 0.8569139799373757 does not meet the constraint requirement! |
ComplianceConstraint(Compliance(review_year is non-negative,COALESCE(CAST(review_year AS DECIMAL(20,10)), 0.0) >= 0,None)) |
Success |
|
MinimumConstraint(Minimum(review_year,None)) |
Failure |
Value: 1696.0 does not meet the constraint requirement! |
MaximumConstraint(Maximum(review_year,None)) |
Failure |
Value: 2202.0 does not meet the constraint requirement! |
Interestingly, the review_id column isn’t unique, which resulted in a failure of the check on uniqueness. We can also look at all the metrics that Deequ computed for this check by running the following:
The following table summarizes our findings.
| Name | Instance | Value |
Completeness |
review_id |
1 |
Completeness |
marketplace |
0.85704 |
Compliance |
marketplace contained in US,UK,DE,JP,FR |
0.85691 |
Compliance |
year is non-negative |
1 |
Maximum |
star_rating |
5 |
Minimum |
star_rating |
1 |
Size |
* |
3,010,972 |
Uniqueness |
review_id |
0.9853137 |
Automated constraint suggestion
If you own a large number of datasets or if your dataset has many columns, it may be challenging for you to manually define appropriate constraints. Deequ can automatically suggest useful constraints based on the data distribution. Deequ first runs a data profiling method and then applies a set of rules on the result. For more information about how to run a data profiling method, see the GitHub repo.
The result contains a list of constraints with descriptions and Python code, so that you can directly apply it in your data quality checks. You can call print(json.dumps(result_json)) to inspect the suggested constraints; the following table shows a subset.
| Column | Constraint | Python code |
customer_id |
customer_id is not null |
.isComplete("customer_id") |
customer_id |
customer_id has type Integral |
.hasDataType("customer_id", ConstrainableDataTypes.Integral) |
customer_id |
customer_id has no negative values |
.isNonNegative("customer_id") |
helpful_votes |
helpful_votes is not null |
.isComplete("helpful_votes") |
helpful_votes |
helpful_votes has no negative values |
.isNonNegative("helpful_votes") |
marketplace |
marketplace has value range '', 'FR', 'JP', 'UK', 'DE', 'US'" |
.isContainedIn("marketplace", ["", "US", "UK", "DE", "JP", "FR"]) |
product_title |
product_title is not null |
.isComplete("product_title") |
star_rating |
star_rating is not null |
.isComplete("star_rating") |
star_rating |
star_rating has no negative values |
.isNonNegative("star_rating") |
vine |
vine has value range “N”, “Y” |
.isContainedIn("vine", ["N", "Y"]) |
You can explore the other tutorials in the PyDeequ GitHub repo.
Scaling to production
So far, we’ve shown you how to use these capabilities in the context of data exploration using a Jupyter notebook running on a SageMaker notebook instance. As your project matures, you need to use the same capabilities on larger and larger datasets, and in a production environment. With PyDeequ, it’s straightforward to make that transition. The following diagram illustrates deployment options for local and production purposes on AWS.
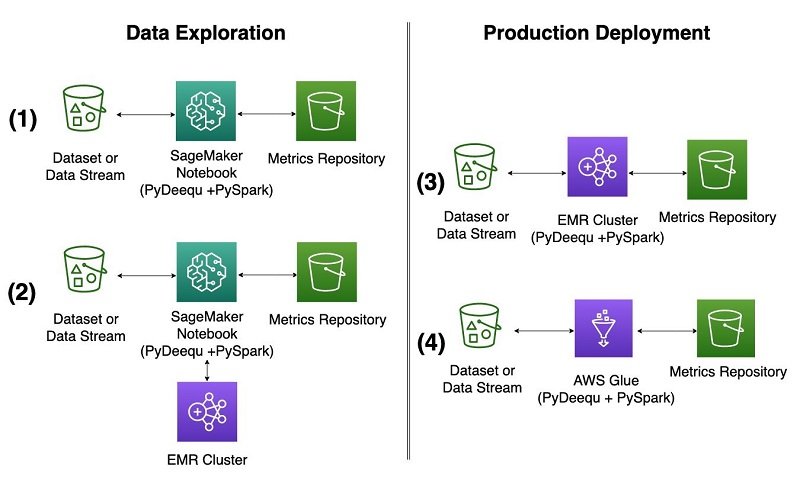
Amazon EMR and AWS Glue interface with PyDeequ through the PySpark drivers that PyDeequ uses as its main engine. PyDeequ can run as a PySpark application in both contexts when the Deequ JAR is added the Spark context. You can run PyDeequ’s data validation toolkit after the Spark context, and drivers are configured and your data is loaded into a DataFrame. We describe the Amazon EMR configuration options and use cases in this section (configurations 2 and 3 in the diagram).
Data exploration from a SageMaker notebook with an EMR cluster
As shown in configuration 2 in the diagram, you can connect to an EMR cluster from a SageMaker notebook or SageMaker Studio to run PyDeequ. This enables you to explore much larger volumes of data than you would on a single notebook instance. We don’t go into great detail about setting up SageMaker Studio and Amazon EMR; for more information, see Create and manage Amazon EMR Clusters from SageMaker Studio to run interactive Spark and ML workloads – part 1.
You launch an architecture using an AWS CloudFormation template that will set up SageMaker Studio Classic, configure appropriate roles and security groups, and launch an EMR cluster from SageMaker Studio. At the time of writing, the CloudFormation template in the GitHub repository for the post Create and manage Amazon EMR Clusters from SageMaker Studio to run interactive Spark and ML workloads – part 1 launched EMR cluster version 6.9.0 with Spark 3.3.0.
When the cluster is up and running, complete the following steps:
- Create a new notebook in SageMaker Studio Classic using a SparkAnalytics image and SparkMagic PySpark kernel (you can use the following
%%configurecell magic to configure the Spark session). - Connect to the cluster.

- Configure a
SparkSessionobject using the following template:
It is critical to provide the correct Apache Maven coordinates of the Deequ JAR that corresponds to your Spark and PyDeequ version using the "spark.jars.packages" argument. One way to identify the correct version is by running pydeequ.deequ_maven_coord in your SageMaker notebook or SageMaker Studio when you experiment with the PyDeequ library within the notebook. In our case, running pydeequ.deequ_maven_coord returned com.amazon.deequ:deequ:2.0.3-spark-3.3.
- Install PyDeequ onto your EMR cluster using the SparkContext (by default named sc) with the following command in a notebook cell:
- Specify the Spark version and import PyDeequ as before:
Now you can start using PyDeequ on Amazon EMR to run tests on much larger volumes of data in the same way you did within your notebook instance.
Run a transient EMR cluster
Another way to take advantage of the power of an EMR cluster is to treat it as a transient cluster and run it in a headless configuration, as shown in configuration 3 in the earlier diagram. You might consider this option when you have completed code experimentation and created a script that you want to submit as a Spark step to Amazon EMR. For our example, we create a simple script that takes a generated DataFrame, runs PyDeequ’s VerificationSuite steps, and writes the results to an S3 bucket. The key for this architecture is to make sure the PyDeequ library is installed on EMR cluster creation during the bootstrapping process and to provide a correct version of the Deequ JAR when submitting a Spark step.
Complete the following steps:
- Create an S3 bucket or repurpose an existing one.
This bucket will be used to store your cluster bootstrapping script, cluster logs when the EMR cluster is up and running, Python script for the Spark step in Amazon EMR, and the output of the PyDeequ analyses.
- Create a bootstrapping script called
pydeequ-emr-bootstrap.shto install the PyDeequ library on Amazon EMR during cluster creation.
Here we provide a bootstrapping script based on the GitHub example for the post Create and manage Amazon EMR Clusters from SageMaker Studio to run interactive Spark and ML workloads – part 1. We install the PyDeequ library version 1.2.0.
- Upload the bootstrapping script to your S3 bucket.
- Create a PySpark PyDeequ script called
pydeequ-test.pyto run as a Spark step on the EMR cluster.
The following sample code demonstrates the usage of PyDeequ on EMR. The result of the PyDeequ’s VerificationSuite analysis is a DataFrame, which is written to an S3 bucket. Make sure to change the placeholder S3 bucket name to the name of your bucket.
- Upload the script to your S3 bucket.
Optionally, we recommend creating an Amazon Elastic Compute Cloud (Amazon EC2) SSH key pair through the AWS Command Line Interface (AWS CLI) using the create-key-pair command, or through the AWS Management Console (for instructions, see Create a key pair for your Amazon EC2 instance). This will allow you to log in to the primary node of Amazon EMR and troubleshoot the script if needed.
- Create default AWS Identity and Access Management (IAM) roles
EMR_EC2_DefaultRoleandEMR_DefaultRoleto use for cluster creation (if not already created). These roles use managed policies to support Amazon EMR functionality and will be specified during cluster creation with the parameter--use-default-roles. - Create an EMR cluster using the AWS CLI.
The following sample command creates an EMR cluster version 6.9.0 with one primary and one core instance in the default VPC running Spark 3.3.0 and with PyDeequ installed using --bootstrap-actions. We highly recommend enabling the cluster logs by providing an Amazon S3 location to the --log-uri parameter. It will allow you to monitor the progress of the submitted Spark step.
- When your cluster is running and in the
Waitingstage, note the cluster ID and submit your Spark job with the PyDeequ script you created earlier to Amazon EMR using the AWS CLI.
It is critical to provide the correct Apache Maven coordinates of the Deequ JAR that corresponds to your Spark and PyDeequ version using the --packages argument to spark-submit. One way to identify the correct version is by running pydeequ.deequ_maven_coord in your SageMaker notebook or SageMaker Studio when you experiment with PyDeequ. In our case, running pydeequ.deequ_maven_coord returned com.amazon.deequ:deequ:2.0.3-spark-3.3.
You have now submitted a PyDeequ PySpark job to Amazon EMR. Give the job a few minutes to run, after which you can view your results at the Amazon S3 output path specified on the last line of pydeequ-test.py.
Now you can use Amazon EMR to process large datasets in batch using PyDeequ to plug into your pipelines and provide scalable tests on your data.
Clean up
When you’re done using this solution, clean up your results and spin down the EMR cluster using the following command:
More examples on GitHub
You can find examples of more advanced features on the Deequ GitHub repo:
- Deequ provides more than data quality checks with fixed thresholds. Learn how to use anomaly detection on data quality metrics to apply tests on metrics that change over time.
- Deequ offers support for storing and loading metrics. Learn how to use the MetricsRepository for this use case.
- If your dataset grows over time or is partitioned, you can use Deequ’s incremental metrics computation For each partition, Deequ stores a state for each computed metric. To compute metrics for the union of partitions, Deequ can use these states to efficiently derive overall metrics without reloading the data.
Conclusion
This post showed you how to use PyDeequ for calculating data quality metrics, verifying data quality metrics, and profiling data to automate the configuration of data quality checks. PyDeequ is available using pip install and on GitHub for you to build your own data quality management pipeline.
Learn more about the inner workings of Deequ in the VLDB 2018 paper Automating large-scale data quality verification.
Stay tuned for another post demonstrating production workflows on AWS Glue.
About the Authors
 Vitalina Komashko is a Data Scientist with AWS Professional Services. She holds a PhD in Pharmacology and Toxicology but transitioned to data science from experimental work because she wanted to own data generation and the interpretation of the results. Earlier in her career, she worked with biotech and pharma companies. At AWS, she enjoys solving problems for customers from a variety of industries and learning about their unique challenges.
 Veronika Megler, PhD, is Principal Data Scientist for Amazon.com Consumer Packaging. Until recently she was the Principal Data Scientist for AWS Professional Services. She enjoys adapting innovative big data, AI, and ML technologies to help companies solve new problems, and to solve old problems more efficiently and effectively. Her work has lately been focused more heavily on economic impacts of ML models and exploring causality.
 Calvin Wang is a Data Scientist at AWS AI/ML. He holds a B.S. in Computer Science from UC Santa Barbara and loves using machine learning to build cool stuff.
 Chris Ghyzel is a Data Engineer for AWS Professional Services. Currently, he is working with customers to integrate machine learning solutions on AWS into their production pipelines.
Audit History
Last reviewed and updated in May 2024 by Vitalina Komashko | Data Scientist