Containers
Enhancing and monitoring network performance when running ML Inference on Amazon EKS
Amazon Elastic Kubernetes Service (Amazon EKS) has become a popular choice for customers looking to run their workloads in the Amazon Web Services (AWS) Cloud with customers increasingly choosing to run their AI and Machine Learning (AI/ML) workloads on Amazon EKS. Customers can use Amazon EKS to customize configuration to match their workload requirements. Furthermore, Platform teams can use it to transfer their existing container orchestration model and expertise when deploying new workloads and standardize on Amazon EKS. Kubernetes also provides access to a rich environment of popular open source AI/ML frameworks, tools, and inference engines such as Ray, vLLM, Triton, PyTorch. Lastly, they can use Kubernetes’ tested capability to auto-scale, deploy and manage containerized workloads at scale, and implement the full cluster automation capabilities of EKS.
Some use cases of AI/ML workloads deployed on Amazon EKS include generative AI Model training for Large Language Models (LLMs), real-time and batch ML inference, and Retrieval Augmented Generation (RAG) Pipelines. ML inference is the process where a trained model generates predictions on a user’s input prompt or query. Inference has become an important part of modern applications and powers applications such as content generation, intelligent assistants, recommendation engines.
Over the years AWS has released a suite of resources and artifacts to accelerate and streamline customers’ usage of Amazon EKS as their service of choice for running AI/ML workloads. These include AI on EKS, Best Practices for Running AI/ML workloads, Amazon EKS-optimized accelerated AMIs for GPU Instances, and AWS Deep Learning Containers.
Recently AWS announced Container Network Observability in Amazon EKS, a set of Amazon EKS network observability features that customers can use to observe, visualize, and enhance their Amazon EKS network environment. In this post we explore the feature sets, deep dive into how it works, and explore an ML inference workload scenario where we use it to monitor and enhance its network performance.
Current challenges with network observability for ML inference workloads
ML inference workloads need efficient access to model artifacts such as Model Weights, model configuration files, and tokenizers (for LLMs). The Model Weights, which are the learned parameters from the model training process, are responsible for converting the user’s prompt into predicted output. They are typically the largest artifact, often being many GBs in size and needing to be loaded into the Amazon Elastic Compute Cloud (Amazon EC2) instance’s GPU memory at runtime. Therefore, the pattern of coupling—either choosing to embed the weights and other model artifacts in the container image or keep it separate in an AWS storage service—and the choice of storage solution are very important decisions to consider when reducing image pull time, pod, and application start-up time. Likewise, this is important in reducing inference latency, which users care about because it determines how long they wait for their response. We recommend not embedding the artifacts in container images and instead storing them in the appropriate AWS storage service for the workload requirement. Amazon EKS supports various Container Storage Interface (CSI) drivers to reduce the management overhead of pod volume mount. For more information on storage design and considerations for optimizing ML inference latency, refer to our guidance in the Amazon EKS Best Practices and this Amazon EKS container start up time guidance.
ML platform teams encounter situations where they need to troubleshoot network connectivity issues related to their workload affecting inference. For example, a pod might fail to respond to requests and they must quickly determine if this is an application issue, network issue, or something else. It gets more complex when the ML inference workloads depend on cluster external AWS services such as Amazon Simple Storage Service (Amazon S3). Furthermore, the view into the AWS network path is important, and users might have issues with high inference latency, in which case the team would want to quickly identify the bottleneck to optimize. Moreover, they might also get users encountering issues with intermittent timeouts or disconnects. Therefore, the platform teams need to have an end-to-end view of the path from client request to inference pod to cluster external dependencies and back that is Kubernetes-enriched. Today teams with their choice of observability stack or AWS network monitoring feature often struggle with this. Container Network Observability in Amazon EKS addresses this, where network optimization and troubleshooting becomes data driven. This leads to improvements in system metrics such as Mean Time to Detect (MTTD), Mean Time to Recover (MTTR), and inference metrics such as Time to First Token (TTFT), end-to-end latency, and output tokens per second.
Deep-dive into Container Network Observability in Amazon EKS
Container Network Observability in Amazon EKS is enabled by Amazon CloudWatch Network Flow Monitor. It operates a Network Flow Monitor agent running as a DaemonSet on all worker nodes in the Amazon EKS Cluster and is installed using the Amazon EKS Network Flow Monitor Agent add-on. When it is running, it collects network observability metrics from all pods and worker nodes and exposes them in the Open Metrics Format for scrapping by your platform team’s observability stack. Therefore, they can continue to use their existing stack, and it provides a visualization from the Amazon EKS console through the Network tab of your cluster’s Observability Dashboard and the CloudWatch Network Monitoring Flow Monitor Console.
Container Network Observability in Amazon EKS has three features:
- Service map: You can use this to visualize communication between pods and services in your ML inference workload.
- Flow table: This provides detailed flow level metrics across your ML inference workload, segmenting the data by views. An important one for ML inference workloads is the “AWS service view,” which provides information on pod traffic to AWS services (such as Amazon S3 and Amazon DynamoDB). Some of the metrics include TCP Retransmissions and Data Transferred.
- Performance metrics: This feature allows pod and worker nodes’ system metrics to be scraped and observed from your observability stack. Some of the metrics include Ingress and Egress Flow, and Bandwidth In and Out Allowance Exceeded. For a full list, refer to the Amazon EKS documentation.
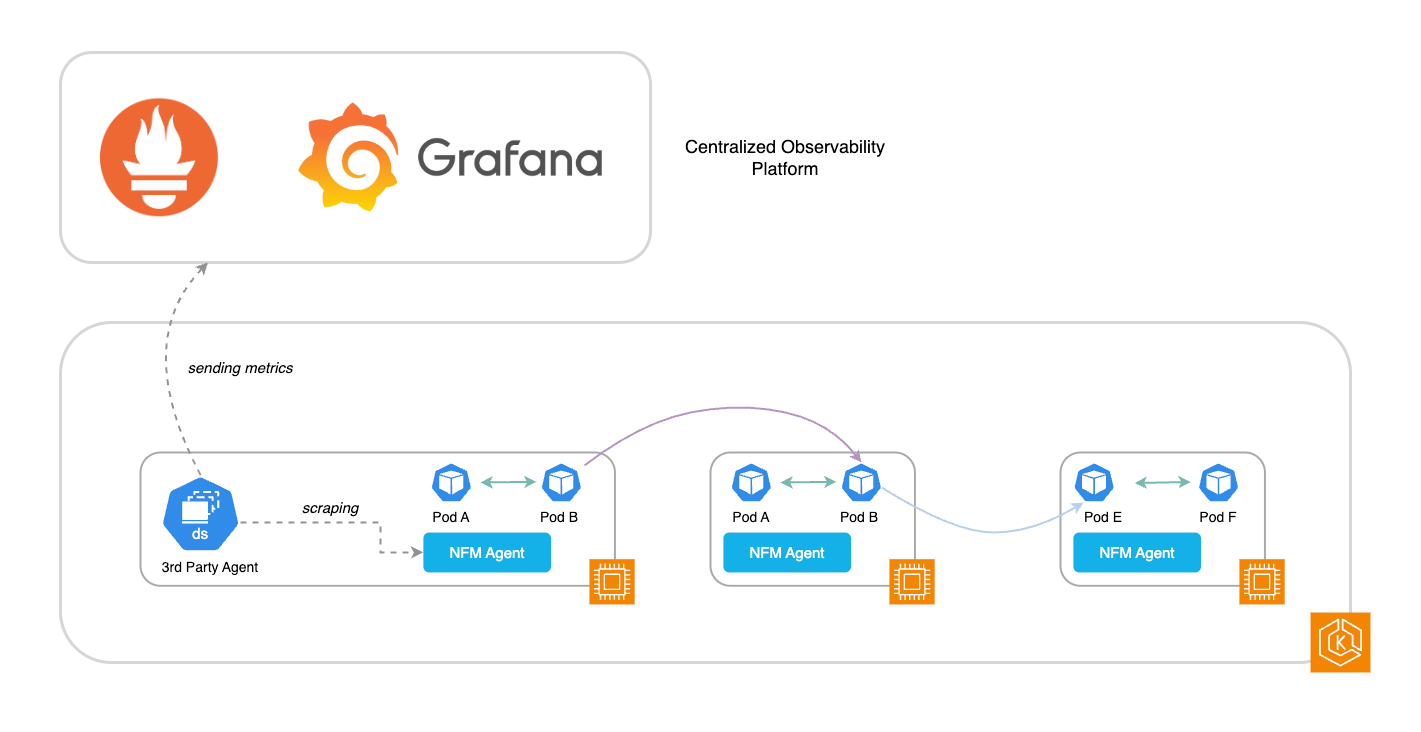
Figure 1: Architecture of Container Network Flow Monitor Agent and integration with observability stacks
ML inference workload scenario
To demonstrate how to use the Container Network Observability feature in Amazon EKS, we deploy a sample ML inference workload running on Amazon EKS and use the feature to enhance and monitor network performance across a range of use cases.
The ML inference workload is Image Generation using the popular Stable Diffusion (SD) model that generates photorealistic images from text and image prompts. The workload is deployed using the Guidance for Asynchronous Image Generation with Stable Diffusion on AWS from the AWS Solutions Library, as shown in the following figure.
When a user submits an image generation prompt, the request arrives at an Amazon API Gateway frontend, which forwards it to an AWS Lambda function for validation. The Lambda function publishes validated requests to an Amazon Simple Notification Service (Amazon SNS) topic, which subsequently delivers them to an Amazon Simple Queue Service (Amazon SQS) queue. Kubernetes Event Driven Auto-Scaler (KEDA) launches new pods in response to the SQS queue to process the prompt request. Karpenter, an open source node lifecycle management project, provisions GPU EC2 instances such as g5 and p4 to schedule the pods. The pods run an SD Runtime container image, and when they reach the Running state they load the SDXL-Turbo Model Weights (stored in safetensor format) from an S3 bucket using the Mountpoint for Amazon S3 CSI Driver. The generated images are stored in another S3 bucket.
This architecture uses the pattern discussed previously of decoupling storing the Model Weights from the container image. This leads to faster pod and application start time, more efficient memory usage, and scaling of the ML workload.
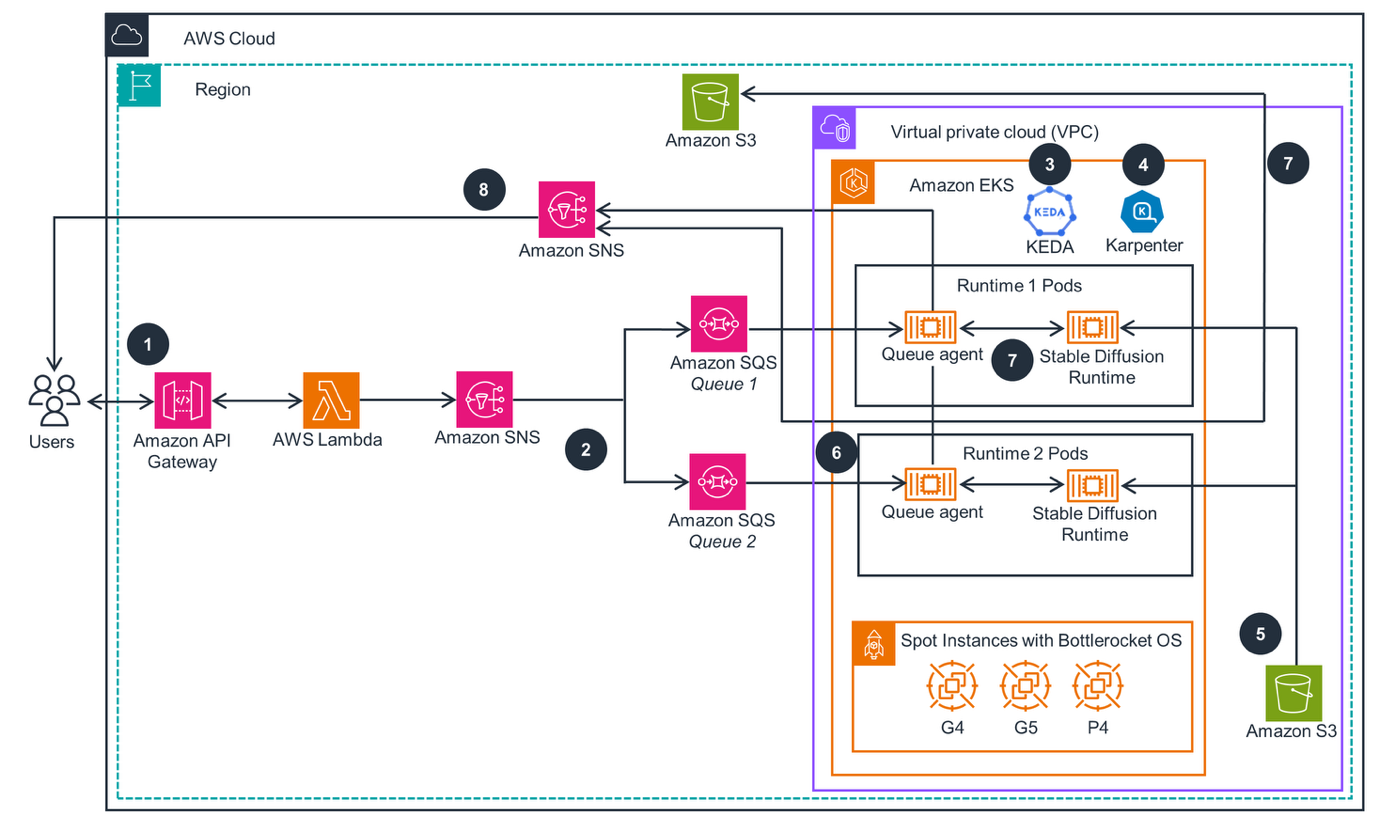
Figure 2: Image generation with SD on AWS Solution Reference architecture
Setting up
The following prerequisites are needed to get started:
- An AWS account with access to EC2 G5 instances. Request a quota increase if needed.
- AWS Command Line Interface (AWS CLI), to deploy and manage AWS resources.
- kubectl, to access and deploy Kubernetes Resources.
- eksctl, to access the EKS cluster.
- Your development environment or setup.
Step 1: Clone the solutions GitHub repository
Step 2: Deploy the solution
This takes about 1 hour to complete, the solution uses AWS Cloud Development Kit (AWS CDK) to deploy the necessary AWS services and all resources. You can monitor its creation in the console and through AWS CloudFormation.
Step 3: Enable Container Network Observability on the EKS cluster
To enable Container Network Observability on the EKS cluster, navigate to the EKS cluster and choose Monitor cluster, as shown in the following figure. This takes you to the Observability Dashboard of the cluster, where you choose Network. Choose Edit container network observability, choose Enable network monitoring, and choose a Pod Identity AWS Identity and Access Management (IAM) role that the Network Flow Monitor Agent uses when installed on the cluster. Then, choose Save changes.
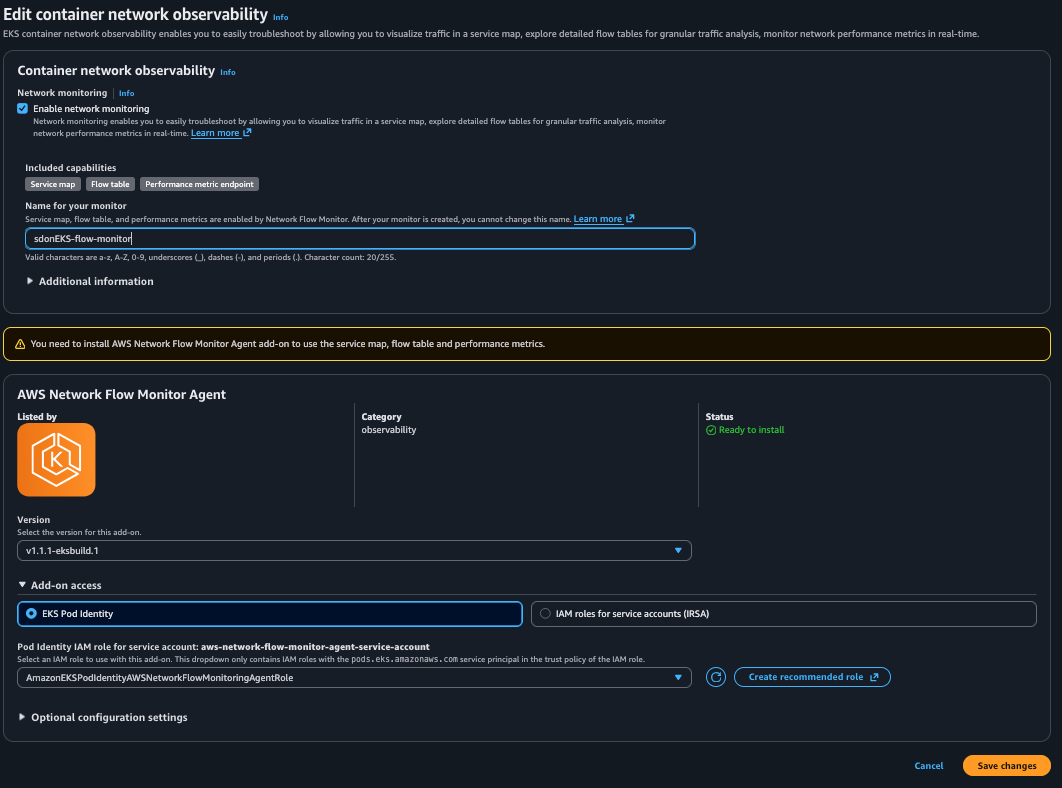
Figure 3: Amazon EKS console showing Container Network Observability
Confirm that the Network Flow Monitor Agent is installed by checking the installed add-ons in the Amazon EKS console, or by running the following command.
Step 4: Configure observability stack to collect and visualize metrics
MLOps and platform teams often standardize on an observability stack to track metrics and to alert if they’re breaching defined thresholds. In this scenario we use Amazon Managed Service for Prometheus to ingest the metrics and Amazon Managed Grafana to visualize them in a dashboard. We’d deploy an Amazon Managed Service for Prometheus managed collector to scrape the metrics exposed by the Network Flow Monitor Agent on its port 9101 and on path /metrics.
To create an Amazon Managed Service for Prometheus workspace for the EKS cluster, follow the steps in the Amazon Managed Service for Prometheus and Amazon Managed Grafana documentation.
Create an Amazon Managed Service for Prometheus workspace:
This Containers post also goes into the details of setting it up for Container Network Observability.
When the workspaces are created, configure a scraper to scrape the metrics from the Network Flow Monitor Agent. We use Amazon Managed Service for Prometheus Managed Collector. To do this, navigate to the Observability section of the EKS cluster, and under Scrapers choose Add, as shown in the following figure.
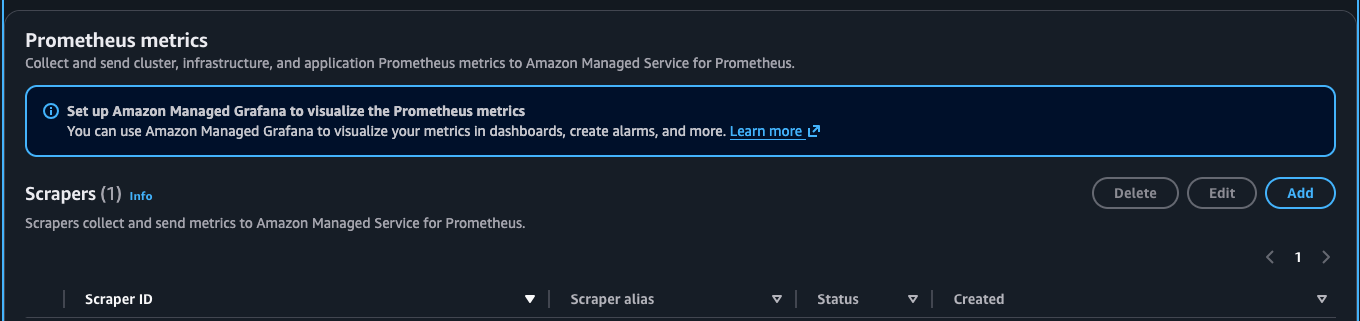
Figure 4: Amazon EKS console showing Amazon Managed Service for Prometheus Managed collector
Choose the existing workspace and choose the Amazon Managed Service for Prometheus workspace that you configured previously. Under the Scraper configuration, append the following scraper job to the end. This is the job that scrapes Network Flow Monitor metrics from the Agent and forwards them to Amazon Managed Service for Prometheus.
Step 5: Deploy user and generate image
Create a UI deployment and SD Runtime service. You can use these to send traffic from the UI to the SD Runtime Deployment and visualize it.
Generate an image of a dog or your choice of image by sending the following image generation prompt:

Figure 5: Image of a dog generated from the SD Runtime Pod (stored in the S3 bucket output)
Container Network Observability use cases for ML inference workload
This section walks through the container network observability use cases for ML inference workload.
Visualize and confirm intercommunication between services for troubleshooting
Using the Service Map feature we visualize the intercommunication between the pod and services in our workload. This is a quick way to view and understand the workload and confirm whether or not services are communicating with each other. In the following figure we can observe and confirm that the UI and SD Runtime Deployments are communicating. This is a quick and visual way to rule out issues such as security misconfiguration (NetworkPolicy, Security Groups, Network Access Control Lists).
We can also filter for the namespaces we’re interested in to streamline the view.
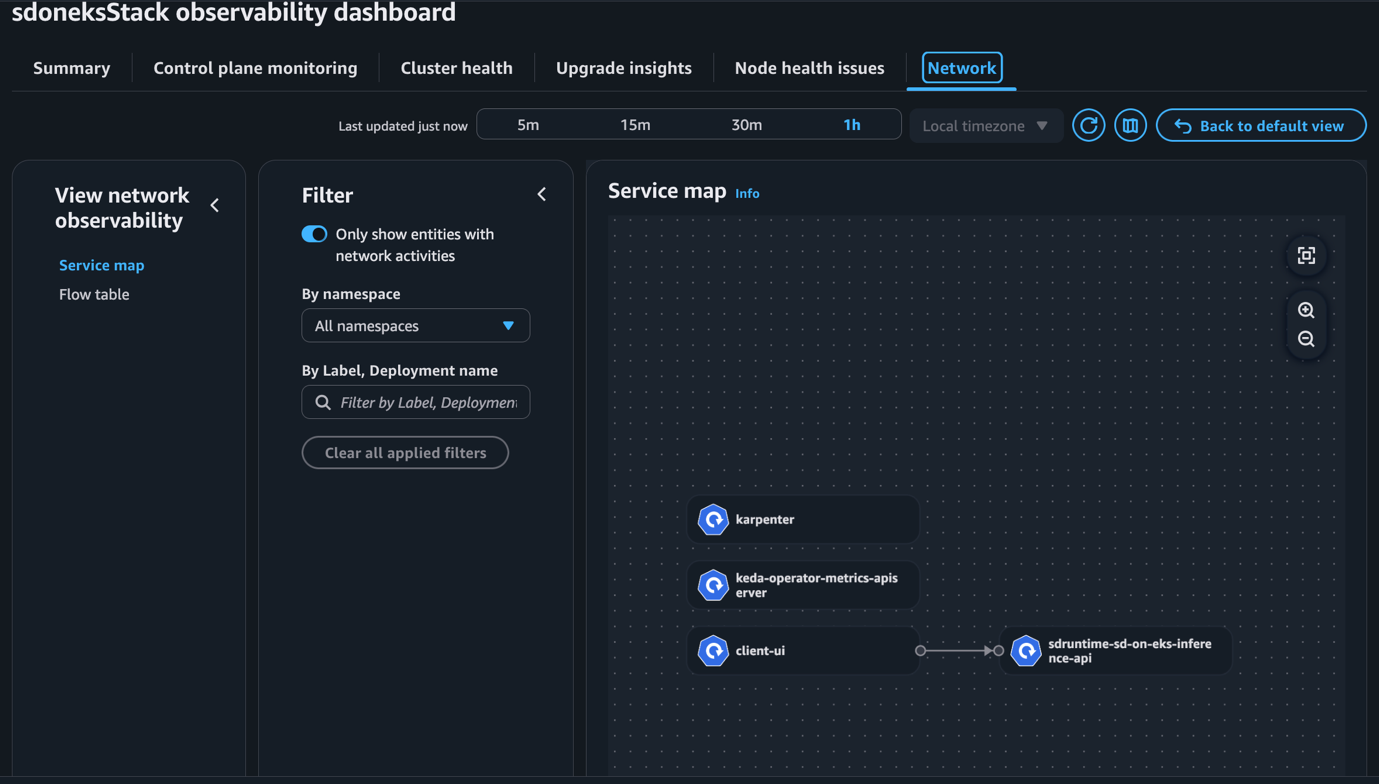
Figure 6: Container Network Observability console in Amazon EKS showing Service map view
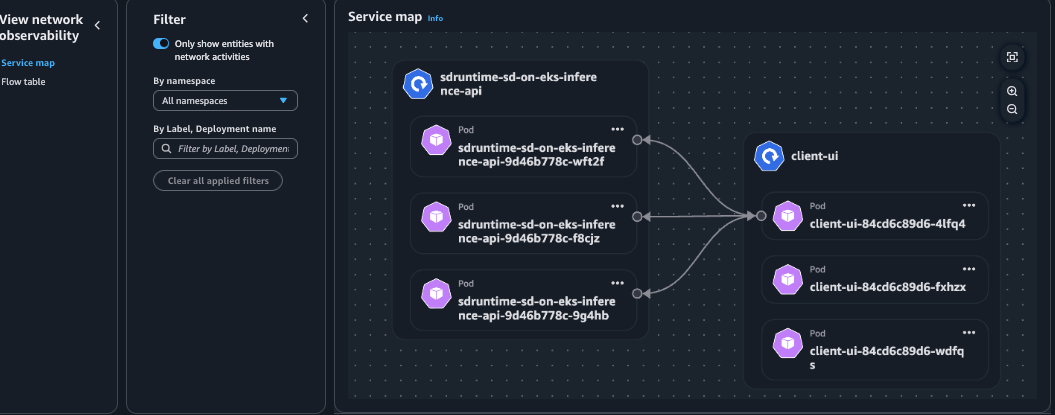
Figure 7: Container Network Observability console in Amazon EKS showing Pod view
Analyze Availability Zone (AZ) traffic pattern between deployments
Using the Flow table feature and CloudWatch Network Monitoring Flow Monitor we can analyze the AZ traffic pattern for inter-AZ and intra-AZ traffic. This is useful if we’re optimizing for a very low latency ML inference and decide that pods communicating between services should only communicate intra-AZ.
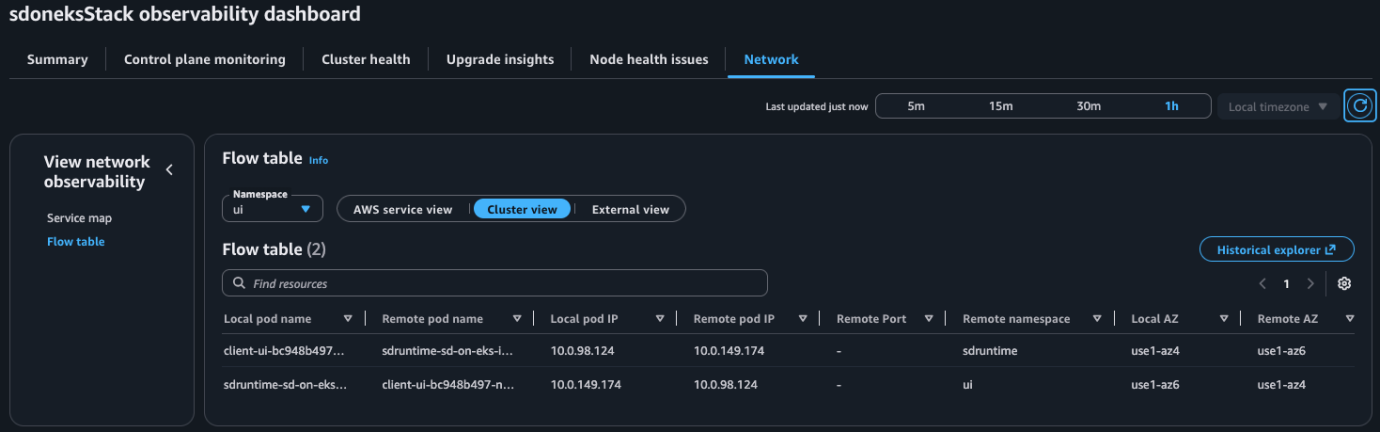
Figure 8: Container Network Observability console in Amazon EKS showing Flow table view
In Kubernetes you can use a feature such as Topology Aware Routing to implement this, and confirm it is working using Container Network Observability. In our example we observe that UI Pods are communicating with the SD Runtime pods inter-AZ (az4 ↔ az6).
Network Health Indicator
We can investigate if an AWS Network Issue has occurred using Network Health Indicator (NHI), as shown in the following figure. The Network Flow Monitor generates an NHI value of 0 (signifying healthy) or 1 (signifying an AWS network issue). This is important when troubleshooting ML inference for high latency. You want to quickly confirm if there was an AWS Network issue or not and then focus your investigation.
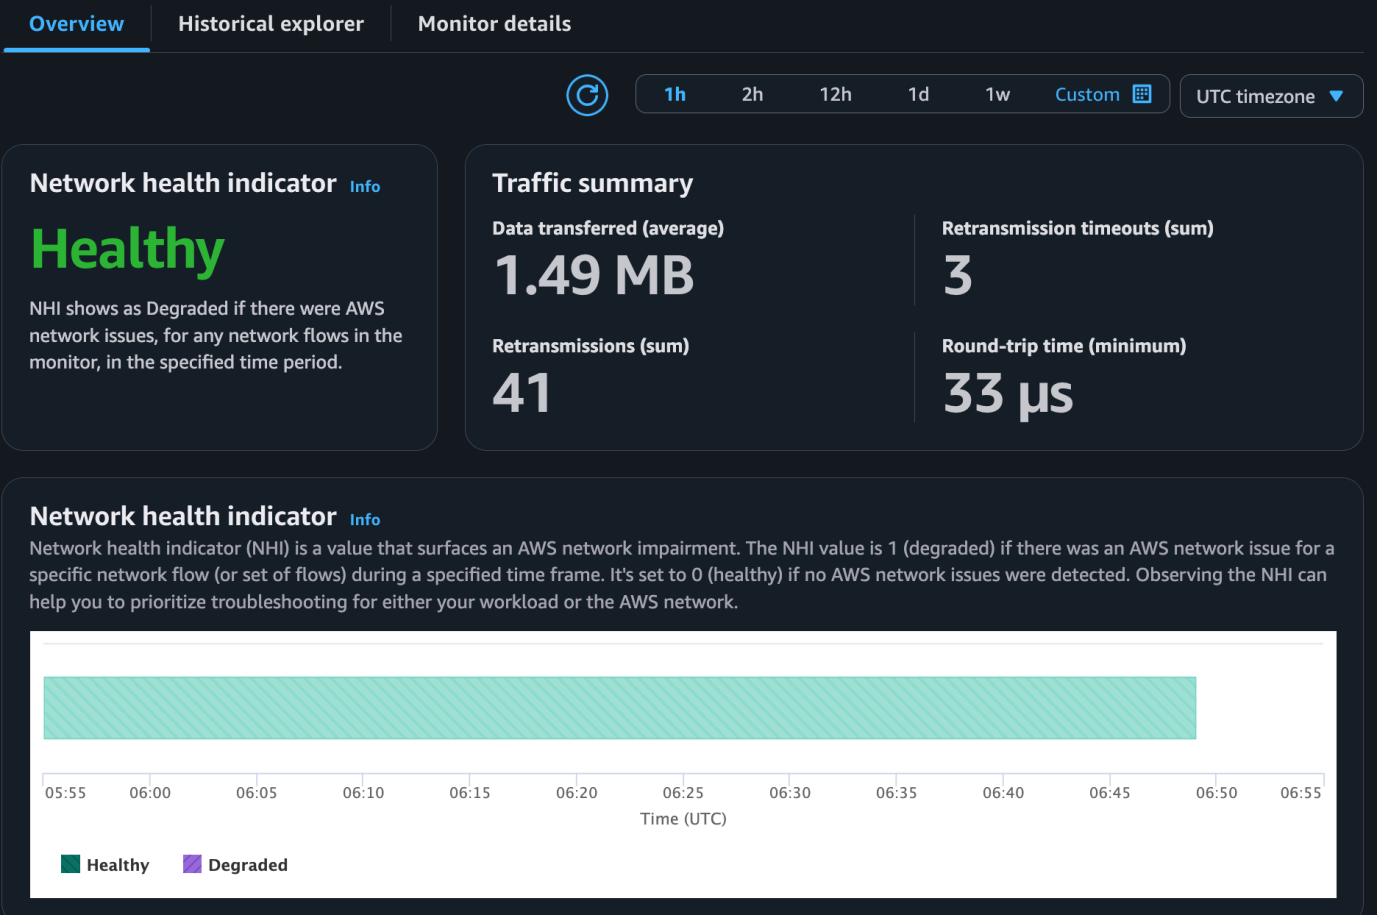
Figure 9: CloudWatch Network Monitoring Flow Monitor console showing NHI healthy
Investigating ML inference Latency using performance metrics in Amazon Manged Grafana
We can use performance metrics to identify ML inference optimization opportunities. The key metrics include the following:
- TTFT
- End-to-end latency
- Output tokens per second (throughput)
Common root causes of increased ML inference latency include the following:
- Pod and application startup time
- Model loading duration
To visualize the performance metrics collected by our Network Flow Monitor Agent in Amazon Managed Grafana, we can use this already built dashboard that provides detailed network monitoring. Import it by going to your Amazon Managed Grafana Workspace URL. Then, navigate to Dashboard, choose New, choose Import, and upload the JSON copied.
Next, generate lots of image generation requests.
We notice something when isolating the Metrics for Ingress Bytes and Bandwidth In Allowance Exceeded (a metric that represents packets that are queued or dropped due to inbound bandwidth limit). At the time when the pod is launched, running, and beginning to download the SDXL-Turbo Model Weights from the S3 buckets, there are noticeable events of the underlying g5.2xlarge EC2 instance getting its packets queued or dropped. g5.2xlarge has a Network Bandwidth of up to 10 Gbps, and this is being breached. We also correlate this in our CloudWatch Network Monitoring Flow Monitor were we observe at the same time a large spike in Retransmissions, which occurs when receipt of a data segment isn’t confirmed by the receiver. In this case the pod isn’t confirming receipt of data segments of the Model Weights sent by Amazon S3 because the maximum bandwidth of the underlying g5.2xlarge instance was breached. Therefore, Amazon S3 is re-transmitting that segment until the pod acknowledges. This can contribute to ML inference time and poor user experience.
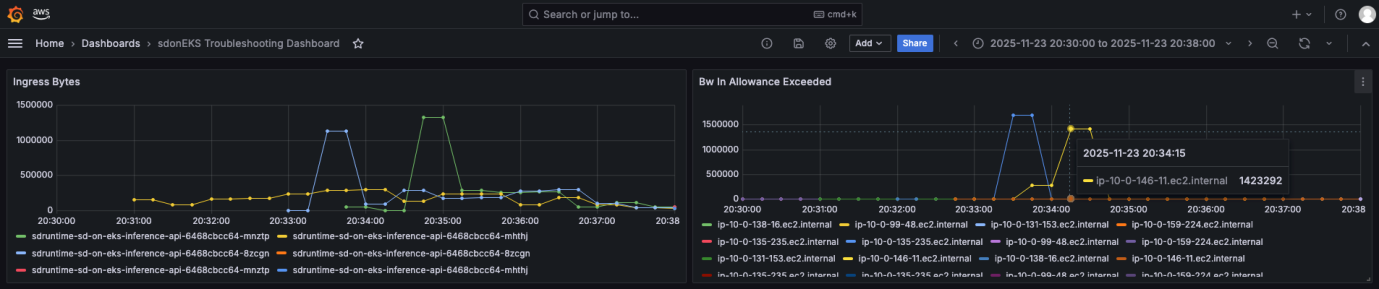
Figure 10: Amazon Managed Grafana dashboard showing performance metrics
In this case, choosing to use an instance type with a larger maximum bandwidth (for example g5.4xlarge has a Network Bandwidth up to 25 Gbps) would be appropriate, or you could use other optimization techniques.
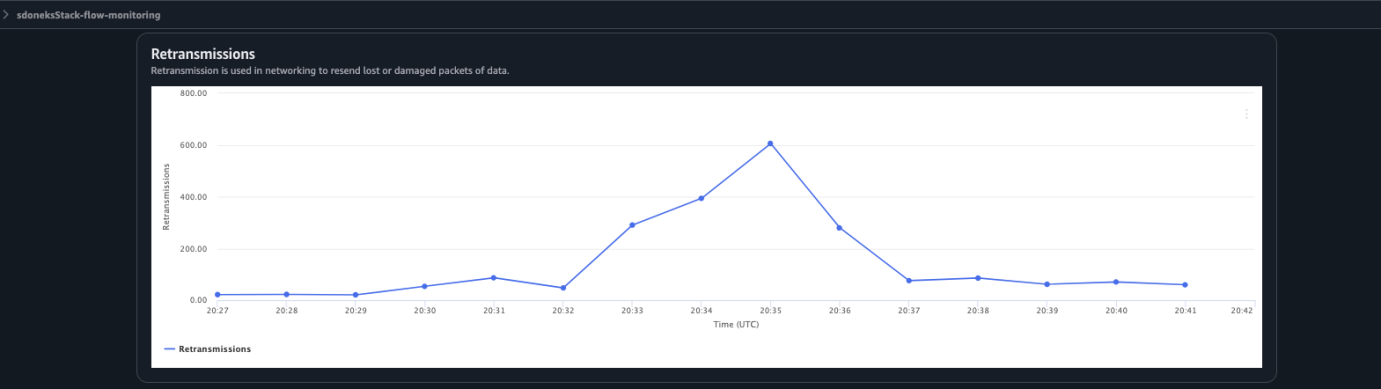
Figure 11: CloudWatch Network Monitoring Flow Monitor console showing Retransmissions spike
Cleaning up
After concluding, delete and clean up all resources deployed. This prevents you incurring other costs. To delete the solution, navigate to the CloudFormation console, choose the sdoneks Stack, and choose Delete.
Furthermore, navigate to your Amazon Managed Service for Prometheus and Amazon Managed Grafana console to delete the workspaces. Finally navigate to Amazon S3 and delete the two S3 buckets for Model Storage and for Image Output Storage.
Conclusion
This post explored the importance of Container Network Observability for ML inference workloads, emphasizing the critical need for low inference latency. We examined the networking challenges that teams encounter when optimizing and troubleshooting these workloads. The newly launched Container Network Observability in Amazon EKS offers a solution through the Service Map, Flow Table, and Performance Metrics features. These capabilities provide Kubernetes-enriched data for both internal cluster traffic and communications with external AWS services. Furthermore, platform teams have the flexibility to integrate these insights with their existing observability stack.
We used a sample image generation ML inference workload to explore various network enhancement and troubleshooting use cases addressed by the feature.
For more information on this feature, please check out the following resources:
Container Network Observability in Amazon EKS
Container Network Observability in Amazon EKS Launch Blog
Amazon CloudWatch Network Flow Monitor
About the authors
 Chiedu Eluehike is a Senior Solutions Architect at AWS based in Sydney, Australia. In his role he works with Large Enterprise customers and helps them translate business problems to technology solutions using the Cloud. He specializes in Application Modernization using container technologies and the intersection with Networking. Outside of work he enjoys playing soccer and basketball, reading books, and spending time with friends and family. He is CCIE #48238 (Emeritus).
 Frank Fan is a Sr. Container Solutions Architect at AWS Australia. As a passionate advocate for application modernization, Frank specializes in containerization and overseeing large-scale migration and modernization initiatives. Frank is a frequent speaker at prominent tech events including AWS re:Invent, AWS Summit, and Kubernetes Community Day. You can get in touch with Frank through his LinkedIn page, and his presentations are available on his YouTube channel.